Abstract
Background
Preoperative assessment of anterior communicating artery (AcoA) aneurysms with cerebral angiography is common, but not without risk. Computed tomography angiography (CTA) is a widely available imaging modality that provides quick acquisition, low morbidity, and low cost. One disadvantage is that it does not provide dynamic information. In this study, the authors sought to determine whether CTA alone can reliably predict the inflow dominance to an AcoA aneurysm.
Methods
Eighty-three patients with ruptured AcoA aneurysms were reviewed retrospectively. Only those patients with both preoperative CTA and cerebral angiogram were included, thus excluding six patients. Four independent observers reviewed the CTAs and attempted to identify the dominant A1. Additionally, three mathematical models were created to identify the dominant A1. These responses were compared to cerebral angiograms.
Results
Four observers were correct in judging the dominant A1 an average of 93% of the time. Seventeen cases were read incorrectly by only one of four observers, and three cases were read incorrectly by two observers. For cases with incorrect readings, the average percentage difference in A1 sizes was 19.6%. For cases read unanimously correct, the average percentage difference in A1 sizes was 42.7%. Mathematical model #3 correctly evaluated the dominant A1 in 97% of the cases.
Conclusions
This study found CT angiograms can be reliable in predicting the inflow dominance to the majority of AcoA aneurysms.
Keywords: Aneurysm, anterior communicating artery, computed tomography angiography, subarachnoid hemorrhage
Introduction
The anterior communicating artery (ACoA) is a frequent site for aneurysm formation. ACoA aneurysms are responsible for approximately 30%–37% of intracranial aneurysms, and they account for the highest frequency of ruptured aneurysms.1–6
Digital subtraction angiography (DSA) represents the gold standard in aneurysm detection, location, and surgical planning. Since the advent and continuous improvements in computed tomography angiography (CTA), it has supplemented and at times replaced DSA for surgical planning of aneurysms. CTA has shown to adequately predict surgical anatomy around the ACoA aneurysm.5 CTA has also shown to have high sensitivity and specificity in detecting cerebral aneurysms.7
Frontal intraparenchymal hematomas associated with ruptured AcoA aneurysms may warrant evacuation and urgent intervention of the aneurysm. Forgoing a DSA may be necessary to avoid time needed to obtain a conventional angiography. Avoiding a DSA also bypasses the inherent risks of the procedure.8,9 One advantage of DSA is that it provides real-time information regarding blood flow circulation. Knowledge of which anterior cerebral artery supplies the ACoA aneurysm will influence which side the craniotomy is performed on. Typically, the surgical approach is performed on the same side as the dominant ACoA supply to obtain proximal control of the aneurysm. This study looks to determine the accuracy of CTA in determining the dominant artery supply to the ACoA aneurysm.
Methods
Patient selection
From 2006 to 2011, 83 patients presented to Louisiana State University Health Sciences Center in Shreveport with ACoA aneurysms. Only patients who received a CTA and DSA prior to any intervention were included in the study. Therefore, six patients were excluded for insufficient imaging. Each CT angiogram was independently reviewed by two neurosurgeons and two neuroradiologists blinded to radiographic interpretations and reports, DSA images and reports, and operative findings. Results were reviewed in a single-blinded fashion.
DSAs were interpreted using a similar reviewer blinding to CTA findings. Radiographic interpretations for all four reviewers were attached to the randomly assigned identification number and compared.
Statistics were recorded from the neurosurgery database including gender, examination upon presentation, location of aneurysm, rupture of aneurysm, and presence of vasospasm.
Mathematical models
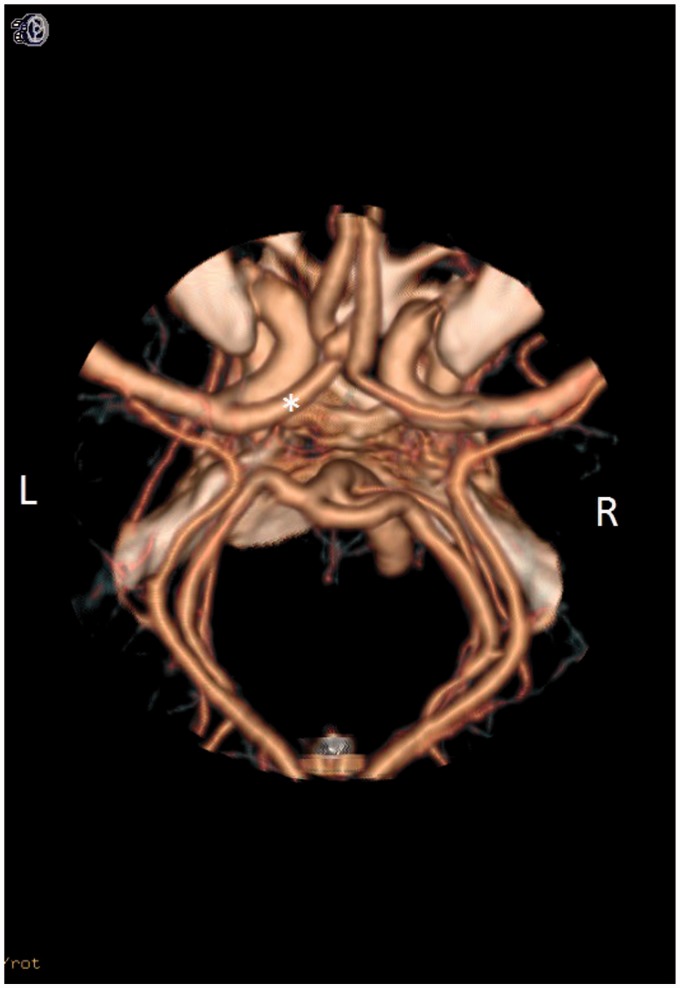
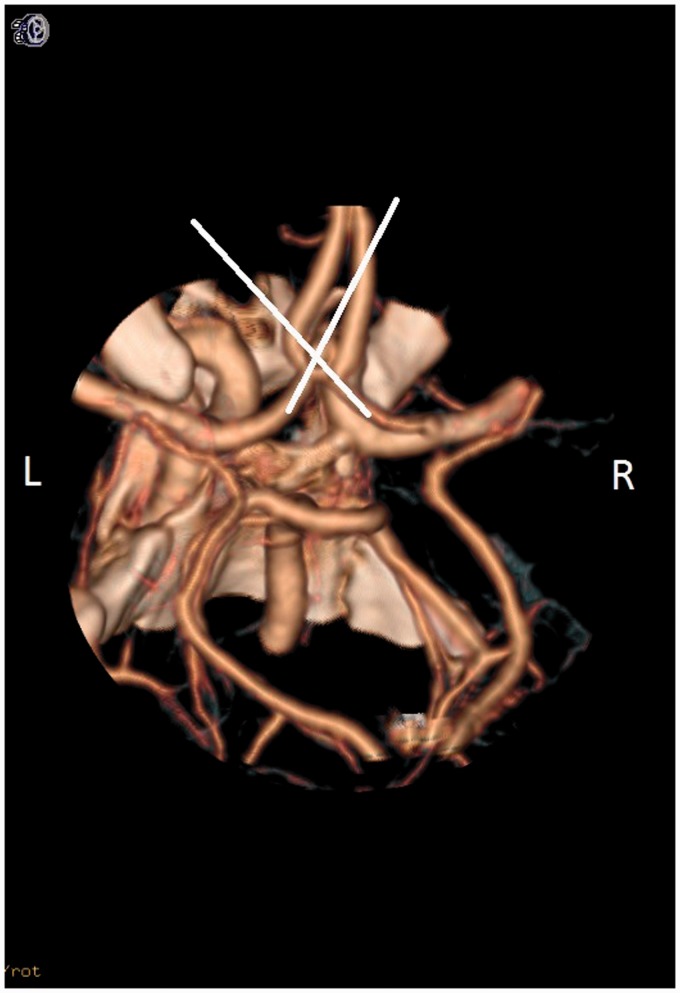
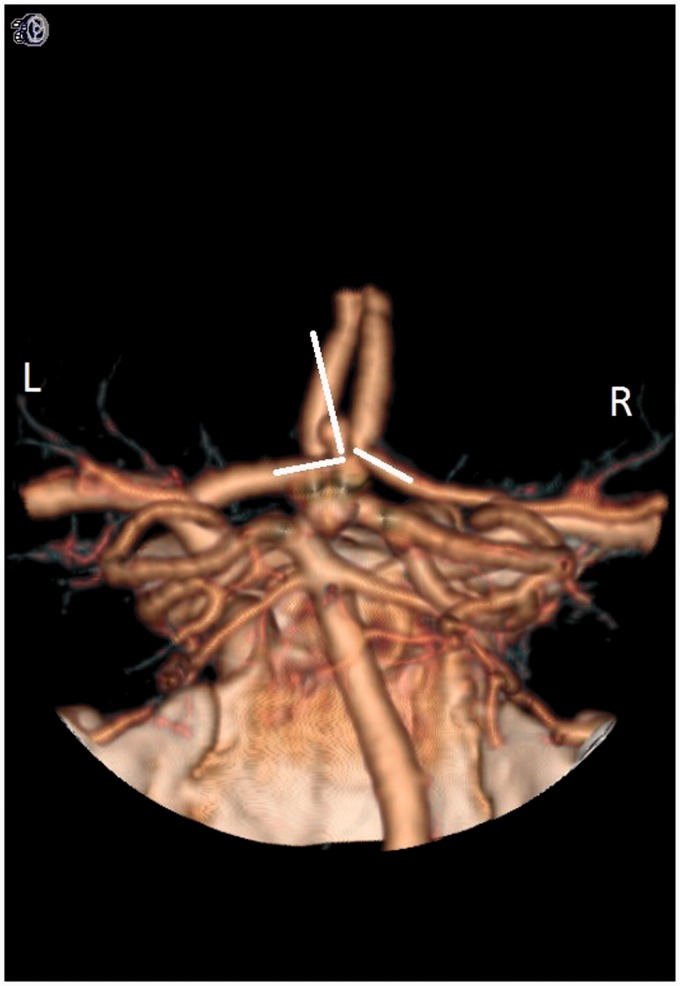
Three mathematical models were used to correctly identify the dominant anterior cerebral artery to the ACoA aneurysm based on CTA. The first mathematical model (MM1) compared the diameter of the two A1s and selected the larger A1 as the dominant artery. The second model (MM2) measured the angle formed by the long axis of the A1 segment and the long axis of the aneurysm. The angle that was closest to 180 degrees was considered to have the most direct trajectory to the aneurysm. Thus, the A1 segment with an angle closest to 180 degrees was considered the dominant inflow artery. The third model (MM3) measured the degree between both A1 arteries and the aneurysm. If the difference in angles was greater than 30 degrees, it chose the larger angle as the side of dominance. This signified a straighter trajectory to the AcoA complex. If the difference between these angles was less than 30 degrees, the larger A1 was determined to be dominant.
Radiographic acquisition
Standard protocol was used for obtaining the CTA. An intravenous catheter was placed in an antecubital vein, and a CT scan of the head was obtained for localization. The starting and ending lines were selected with the gantry set to the orbitomeatal line. The contrast medium was injected with the use of power injector at 3 ml/sec. Twenty seconds after the contrast injection, the CT table was drawn through the gentry at velocity of 1.25 mm/second while the scan was performed.
Angiograms are routinely accessed with the Seldinger technique. The anterior-posterior (AP), lateral and digital subtraction views were obtained for each angiogram using standard technique and a biplane Phillips machine. Manual injection of the contrast was performed.
Measurement technique and statistical analysis
All images and angles were measured on axial views of the CTA. The diameter of A1 was measured at the midpoint between the internal carotid artery (ICA) terminus and the A2 origin. The diameter of A2 was measured at the point of origin. The angles were measured by projecting a line along the long axis of A1 toward the AcoA complex. Another line was created along the long axis of the aneurysm in the axial plane. The angles were measured off the lines created.
All demographic information collected was calculated with a mean and standard deviation. The size of the aneurysm, direction of the aneurysm, side of inflow dominance, and vasospasm were all determined on DSA.
Results
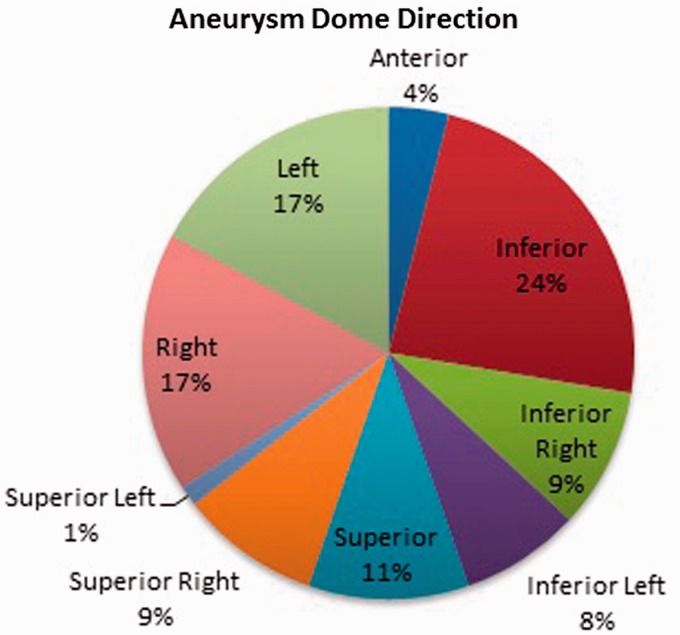
Seventy-seven patients with CTAs and DSAs were analyzed by four blinded reviewers and calculated by three mathematical models to determine inflow dominance. Thirty-nine patients (51%) were male with a mean age of 51.3 (Table 1). Seventy-one patients (92%) had a ruptured AcoA aneurysm, of which only five patients (6.5%) had vasospasm on DSA. The average size of the aneurysms was 6.1 mm ± 3.1 mm (Table 2). The projections of the aneurysms are displayed in Figure 1. Forty-five patients (58%) had dominant inflow from the left anterior cerebral artery to the ACoA aneurysm (Table 3).
Table 1.
Patient characteristics.
| Summary statistics on patient characteristics | ||
|---|---|---|
| Characteristic | ||
| Male | 39 | 50.65% |
| Female | 38 | 49.35% |
| Ruptured Aneurysms | 71 | 92.21% |
| Non-Ruptured | 6 | 7.79% |
| Vasospasm present | 5 | 6.49% |
| Vasospasm absent | 72 | 93.51% |
| Age (years of age) | ||
| Mean | 51.27 | |
| Standard deviation | 13.55 | |
| Median | 51.98 | |
| Range | 20–81 | |
Table 2.
Size of aneurysms.
| Size of aneurysm (mm) | |
|---|---|
| Mean | 6.14 |
| SD | 3.10 |
| Median | 6 |
| Range | 1.5–22 |
Figure 1.
Aneurysm dome direction.
Table 3.
Aneurysm fill direction.
| Aneurysm fill direction | ||
|---|---|---|
| Both | 1 | 1.30% |
| Right | 31 | 40.26% |
| Left | 45 | 58.44% |
MM1 compared the diameter of both A1 segments and selected the larger artery as the dominant artery (Figure 4). CT angiogram results (Table 4) showed right A1 with a mean of 1.61 ± 0.80 mm, left A1 with a mean of 1.98 ± 0.69 mm, right A2 with a mean of 1.88 ± 0.34 mm, and left A2 with a mean of 1.86 ± 0.35 mm. This model correctly evaluated the dominant inflow artery 92.2% of the time.
Figure 4.
This picture denotes the use of mathematical model #1 (MM1). MM1 selected the dominant inflow by looking at the caliber of the A1 segment supplying the anterior communicating artery (AcoA) complex. The caliber of the A1 segment was assessed on the axial view of the computed tomography (CT) angiogram. In this picture, the three-dimensional (3D) reconstruction shows the A1 segments. The A1 labeled with the asterisk signifies the dominant inflow artery.
Table 4.
CTA data.
| CTA data | ||||
|---|---|---|---|---|
| RA1 | LA1 | RA2 | LA2 | |
| Mean | 1.612207792 | 1.978181818 | 1.875714286 | 1.862337662 |
| Standard Deviation | 0.799495932 | 0.690275931 | 0.339978438 | 0.351009432 |
| Median | 1.82 | 2.06 | 1.86 | 1.86 |
| Range | 0–2.82 | 0–3.32 | 1.22–2.8 | 1.12–2.65 |
CTA: computed tomography angiography.
Table 5.
Summary of angles.
| Summary of angles | |
|---|---|
| Right side angle | |
| Average | 115.0621212 degrees |
| Standard deviation | 47.24595796 degrees |
| Range | 18.4–177.7 degrees |
| Median | 121.35 degrees |
| Percent <90 | 31.82% |
| Percent >90 | 68.18% |
| Left side angle | |
| Mean | 134.4479452 degrees |
| Standard Deviation | 44.81843343 degrees |
| Range | 7.9–180 degrees |
| Median | 147.9 degrees |
| Percent <90 | 15.07% |
| Percent >90 | 84.93% |
In MM2, the mean for the right-sided angles was 115.06 ± 47.25 degrees (Figure 5). Of the angles measured on the right, 68.2% of the angles were obtuse, signifying a straighter trajectory to the aneurysm. The mean for the left-sided angles was 134.45 ± 44.82 degrees, of which 84.9% were obtuse (Table 5). MM2 correctly determined the dominant inflow 93.5% of the time.
Figure 5.
This picture denotes the use of mathematical model #2 (MM2). The long axis of the distal A1 segment that was closest to the long axis of the aneurysm was determined as the dominant inflow. In this picture, the long axis of the aneurysm and the left A1 segment are in the same trajectory, creating a 180-degree angle. The A1 segment that was closest to 180 degrees to the long axis of the aneurysm was deemed the dominant inflow artery. In this case, the left A1 is determined as the dominant inflow artery.
MM3 measured the angles between the A1 segment and the aneurysm (Figure 6). If the difference in angles was greater than 30 degrees, that A1 segment was considered the dominant artery. This model was correct 97.4% of the time.
Figure 6.
This picture denotes the use of mathematical model #3 (MM3). The angle between the A1 segment and aneurysm was assessed bilaterally. If the difference in the angles was greater than 30 degrees, the side of the larger angle was chosen as the dominant inflow. In this case, the right A1 is determined as the dominant inflow artery.
Four observers interpreted inflow dominance on CT angiogram without mathematical models. The observers were correct an average of 93% of the time. The individual scores were 98.7%, 100%, 81.8%, and 90.9% (kappa = 0.86). Seventeen cases were read incorrectly by one of four observers, and two observers read three cases incorrectly. The cases read correctly by all four observers had an average percentage difference of 42.7% in the diameter of the A1 segments. For those cases with incorrect readings, the average percentage difference was 19.6%. Of the six CTAs read incorrectly by the model, four were also read incorrectly by the observer.
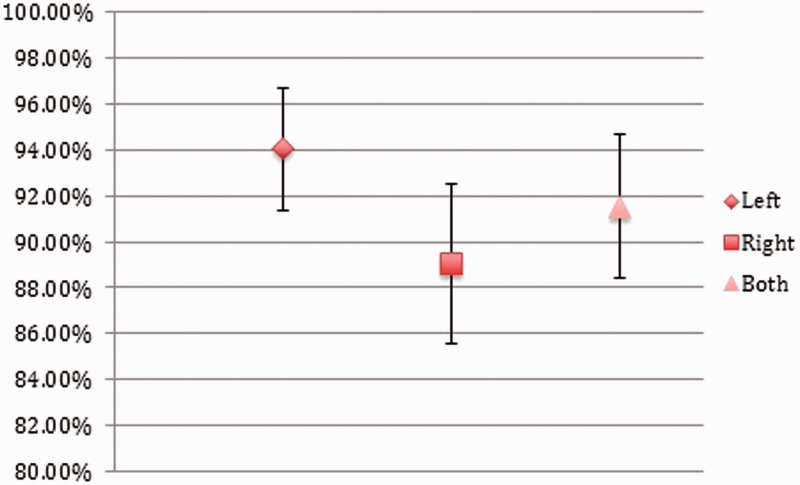
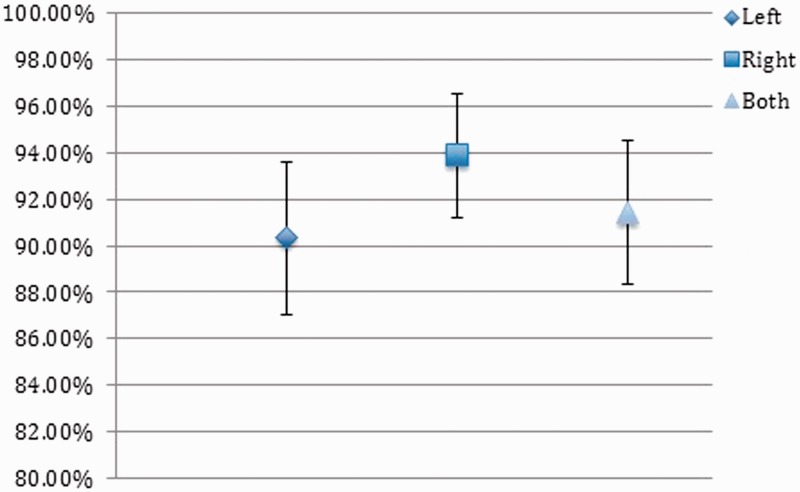
The average sensitivity of the four independent observers was 91.54% (Figure 2), and the average specificity was 91.44% (Figure 3). Further accuracy of inflow dominance is described in Table 6.
Figure 2.
Sensitivity of computed tomography angiography (CTA) in predicting aneurysm fill direction.
Figure 3.
Specificity of computed tomography angiography (CTA) in predicting aneurysm fill direction.
Table 6.
Average pretest probabilities.
| Average pretest probabilities | ||
|---|---|---|
| Probability | Confidence interval | |
| Average sensitivity left fill | 94.02% | 2.65% |
| Average specificity left fill | 90.32% | 3.30% |
| Average sensitivity right fill | 89.06% | 3.49% |
| Average specificity right fill | 93.89% | 2.68% |
| Average sensitivity overall | 91.54% | 3.11% |
| Average specificity overall | 91.44% | 3.12% |
Discussion
AcoA is the most common location for intracranial aneurysms and accounts for a large percent of rupture aneurysms.1 Treatment of AcoA aneurysms involve either endovascular coiling or microsurgical clipping. If surgery is deemed the treatment of choice, the complex arterial relationship, A1 dominance, projection of the aneurysm, and direction of the A2 segments are all reviewed prior to surgery.1 In the case of an intraoperative rupture during surgery, it is essential the surgeon have access to the dominant inflow artery to control bleeding. This is usually achieved by performing the craniotomy on the same side as the dominant A1.5
Historically, DSA is the standard for diagnosing dominant blood supply to an aneurysm. DSA provides high-resolution imaging, real-time information regarding blood flow, vascular architecture, and vascular anomalies.10 However, the use of DSA exposes the patient to an invasive procedure, incurs additional risk of neurological complications and time delay of acquisition, and requires a high skill level for the procedure.8,9 Since the advent of CT, CTA has gained popularity, and in some instances, has replaced DSA. CTA provides a noninvasive procedure, low-cost imaging modality, rapid acquisition, and a lower risk of neurologic complications.7,11–14 It has not been studied whether CTA can accurately provide information regarding inflow dominance to the AcoA complex, thus potentially replacing the need for DSA.
One-sided dominance can lead to the development of AcoA aneurysms. Cohen and Samson found that 57% of patients with AcoA aneurysms had A1 dominance.15 Yasargil noted that 80% of patients with AcoA aneurysms had some degree of A1 dominance, and suggested that an aneurysm will originate from the dominant (larger) A1, which was the basis of MM1. He also suggested that if the A1 supply is equal, the AcoA aneurysm will originate from the middle of the AcoA complex, again suggesting that hemodynamic turbulence may play a role in predisposing patients.16 Kasuya et al. studied the angles between A1 and A2 via three-dimensional (3D) CTA. They found that smaller angles between A1 and A2 were associated with AcoA aneurysms, thus providing the basis for MM2.3
González-Darder looked at the spatial arrangement of the AcoA complex, in relation to A1 and A2, via CTA in subarachnoid hemorrhage patients.2 The normal anatomic arrangement has the AcoA in a transverse plane to the A1 and A2, which was found in half the patients. There are numerous variations to this anatomical relationship. When the A1/A2 junction was located anterior to the transverse plane, and that side was dominant, 100% of the patients were found to have an AcoA aneurysm. This can be explained by altered or turbulent hemodynamics in that region, predisposing patients to AcoA aneurysms. This theory served the foundation for the development of MM3 in this study.
The use of mathematical models in this study was to provide an objective method for determining inflow dominance. MM1 and MM2 were relatively equivalent in predicting inflow dominance, 92.2% and 93.5%, respectively. Independent observer interpretation of the CT angiogram accurately predicted the dominant A1 artery in approximately 93% of the cases. The most accurate method in determining inflow dominance was MM3, accurately predicting the dominant A1 segment in 97.4% of the cases.
Limitations of this study include its retrospective nature. Although the independent observers were blinded to the radiographic information, the designers were not. Most of the patients studied presented with a ruptured AcoA aneurysm, which could complicate CT angiogram interpretation. Since there was a small group of patients that had radiographic vasospasm on DSA, the caliber of the A1 segments could have led to misinterpretation as well.
Conclusion
Based on this study, MM3 provided the most accurate method in determining dominant inflow to the AcoA aneurysm. CT angiogram accurately predicted the dominant artery in 97% of the cases. Therefore, this study supports that CTAs can be a reliable, independent imaging tool in predicting the inflow dominance to AcoA aneurysms. To our knowledge, this is the first study to quantitate the accuracy of CTA in determining inflow dominance to the AcoA complex.
Acknowledgment
This study was conducted and written with ethical adherence by all authors.
Funding
This research received no specific grant from any funding agency in the public, commercial, or not-for-profit sectors.
Conflict of interest
None declared.
References
- 1.Agrawal A, Kato Y, Chen L, et al. Anterior communicating artery aneurysms: An overview. Minim Invas Neurosurg 2008; 51: 131–135. [DOI] [PubMed] [Google Scholar]
- 2.González-Darder JM. ACoA angle measured by computed tomographic angiography and its relevance in the pterional approach for ACoA aneurysms. Neurol Res 2002; 24: 291–295. [DOI] [PubMed] [Google Scholar]
- 3.Kasuya H, Shimizu T, Nakaya K, et al. Angles between A1 and A2 segment of the anterior cerebral artery visualized by three-dimensional computed tomographic angiography and association of anterior communicating artery aneurysms. Neurosurgery 1999; 45: 89–93. [DOI] [PubMed] [Google Scholar]
- 4.Moniz E. L’encephalographie arterielle, son importance dans la localisation des tumeurs cerebrales. Rev Neurol 1927; 2: 72–90. [Google Scholar]
- 5.Tarulli E, Fox AJ. Potent risk factor for aneurysm formation: Termination aneurysms of the anterior communicating artery and detection of A1 vessel asymmetry by flow dilution. AJNR Am J Neuroradiol 2010; 31: 1186–1191. [DOI] [PMC free article] [PubMed] [Google Scholar]
- 6.van Gelder JM. Computed tomographic angiography for detecting cerebral aneurysms: Implications of aneurysm size distribution for the sensitivity, specificity, and likehood ratios. Neurosurgery 2003; 53: 597–605. [DOI] [PubMed] [Google Scholar]
- 7.Anderson GB, Steinke DE, Petruk AC, et al. Computed tomographic angiography versus digital subtraction angiography for the diagnosis and early treatment of ruptured intracranial aneurysms. Neurosurgery 1999; 45: 1315–1322. [DOI] [PubMed] [Google Scholar]
- 8.Cloft HJ, Joseph GJ, Dion JE. Risk of cerebral angiography in patient with subarachnoid hemorrhage, cerebral aneurysm, and arteriovenous malformation: A meta-analysis. Stroke 1999; 30: 317–320. [DOI] [PubMed] [Google Scholar]
- 9.Willinsky RA, Taylor SM, TerBrugge K, et al. Neurologic complications of cerebral angiography: Prospective analysis of 2,899 procedures and review of the literature. Radiology 2003; 227: 522–528. [DOI] [PubMed] [Google Scholar]
- 10.Raney RB, Raney AA. The contribution of cerebral angiography in diagnosis. Calif Med 1950; 73: 342–349. [PMC free article] [PubMed] [Google Scholar]
- 11.Alberico RA, Patel M, Casey S, et al. Evaluation of the circle of Willis with three-dimensional CT angiography in patients with suspected intracranial aneurysms. AJNR Am J Neuroradiol 1995; 16: 1571–80. [PMC free article] [PubMed] [Google Scholar]
- 12.Ogawa T, Okudera T, Noguchi K, et al. Cerebral aneurysms: Evaluation with three-dimensional CT angiography. AJNR Am J Neuroradiol 1996; 17: 447–454. [PMC free article] [PubMed] [Google Scholar]
- 13.White PM, Teasdale EM, Wardlaw JM, et al. Intracranial aneurysms: CT angiography and MR angiography for detection prospective blinded comparison in a large patient cohort. Radiology 2011; 219: 739–749. [DOI] [PubMed] [Google Scholar]
- 14.White PM, Wardlaw JM, Easton V. Can noninvasive imaging accurately depict intracranial aneurysms? A systematic review. Radiology 2000; 217: 361–370. [DOI] [PubMed] [Google Scholar]
- 15.Cohen A and Samson D. Anterior Communicating Artery Aneurysms, http://www.neurosurgicalatlas.com/index.php/video-conference-archive/anterior-communicating-artery-aneurysms/ (20 October 2014).
- 16.Yasargil MG. Microneurosurgery, Vol 1, New York: Thieme-Stratton, 1984. [Google Scholar]


