Dry eye (DE) is a common disease whose symptoms of pain (described as discomfort, burning, and dryness) and blurry vision negatively impact quality of life.1 We previously demonstrated that approximately 1 in 6 United States (US) veterans carried a diagnosis of DE and that environmental factors (air pollution coupled with weather conditions) affected the occurrence of DE.2 By integrating health care data from the National Veterans Administration (VA) database and environmental data from the National Climatic Data Center (NCDC) and National Aeronautics and Space Administration (NASA), we found that air pollution and atmospheric pressure were the two most influential risk factors for DE. Building on this information, we subsequently used the same dataset to assess occurrence of DE by season. This analysis was performed to formally quantify the clinical impression that DE has a seasonal pattern.
Patient information
All patients seen in a VA eye clinic July 5, 2006 through July 4, 2011 were included in this retrospective analysis. DE cases were defined as those who had an ICD-9 code for DE (375.15) and used medication or underwent a procedure for the condition. The Miami VA Institutional Review Board approved this study, which was conducted in accordance with the principles of the Declaration of Helsinki.
Findings
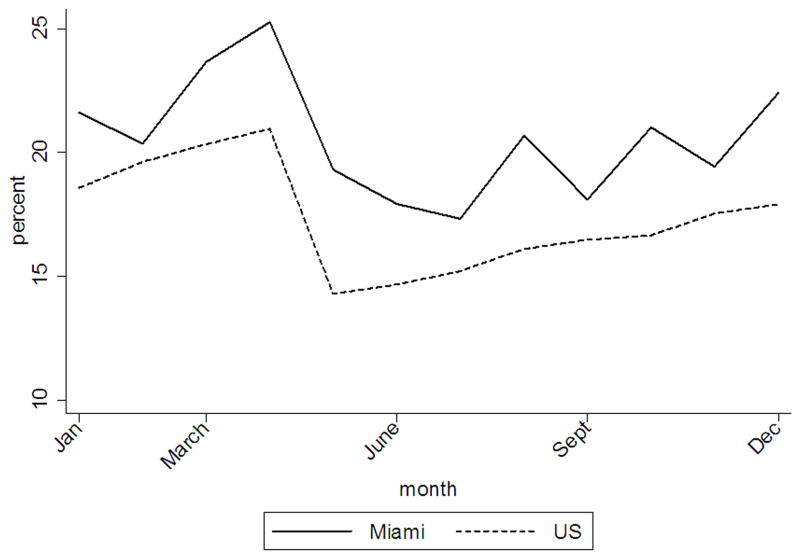
During the study period, there were a total of 3.41 million visits to a VA eye clinic within the continental US. In total, 17.4% of veterans (95% confidence interval (CI) ±1.24) were diagnosed with DE. Looking at the distribution of cases, a clear seasonal pattern is evident (Figure 1 available at http://aaojournal.org), with the highest period prevalence of DE in winter and spring (18.7%±0.98 and 18.5%±4.16 respectively) and lowest prevalence in summer (15.3%±0.82). Furthermore, there was a higher monthly variation in the occurrence of DE during the spring season as compared to winter months, with a standard error of mean 4.16% in spring versus 0.98% in winter. The highest prevalence of DE occurred in April (20.9% ± 0.14). Interestingly, the year round prevalence of DE in Miami was higher than the national average by approximately 3.2% (p<0.001).
Figure 1.
Monthly prevalence of dry eye among veterans in the US and Miami, 2006-11.
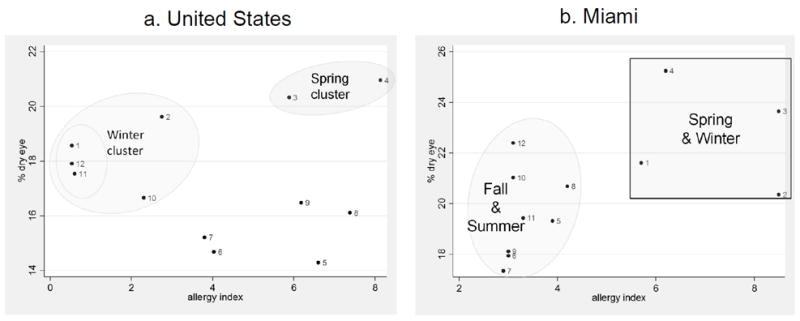
Our findings suggest that seasonality plays a role in DE. The observed seasonal pattern suggests that outdoor conditions, such as allergen exposure, explain approximately 3% of DE variability. The remaining DE burden, therefore, is likely due to other factors, including indoor environment, demographics, and co-morbid conditions. To further evaluate the link between allergens and seasons, we obtained information from pollen.com which provides a monthly allergy index (based on pollen concentrations) for various locations throughout the US. We selected 16 random zip codes, spread across the north, south, central, eastern and western US and averaged allergy index information to estimate monthly pollen counts in the US (not including Miami) and compared this to Miami estimates (zip code 33146) (Figure 2 available at http://aaojournal.org). Our analysis clearly shows a strong seasonal pattern of DE and allergy index for both the US and Miami. Specifically, in Figure 2a, two distinct DE clusters are visible: one with low outdoor allergy indices in winter, and one with high allergy indices in spring. We hypothesize that low indoor humidity during winter months (due to heating in the absence of a humidifier) may be one potential factor underlying the elevated winter prevalence in the US. Conversely, elevated outdoor pollen concentrations in spring likely contribute to the elevated spring prevalence. In Figure 2b, one can see that Miami has two main seasons, dry and wet. In winter and spring, we see relatively higher allergy indices which correspond to spring season in the rest of the US. In a multi-variable analysis considering meteorological conditions, season, and allergy index on DE prevalence, seasonality showed the strongest association with DE, with DE prevalence during peak seasons (winter-spring) being 3.7% higher in the US and 5.2% higher in Miami, compared to summer-fall.
Figure 2.

Distribution of monthly prevalence of dry eye with respect to allergy index (latter information obtained from pollen.com).
The overall higher frequency of DE in Miami may be explained by Miami’s humid sub-tropical climate (where relative humidity and temperature are high year round). This can support the growth of allergens (such as pollens outdoors, and fungus and mold spores indoors).3 In a pilot study in Miami, we gave mold-test kit (from Pro-Lab, Weston, FL) to 45 Master of Public Health (MPH) students to deploy indoor. Of these 45, 27 (60%) tested positive for airborne mold spores in their homes, suggesting that indoor air pollution may play an important role in DE in climates such as Miami.
The strength of our study is that it included information from a large patient population convering the entire continental US. However, with all retrospective reports, our study has limitations which need to be considered. This study relied on ICD9 coding to define DE and as such we cannot further subtype DE by severity or clinical characteristics (aqueous vs evaporative). Furthermore, it is possible that patients with DE but without a documented diagnosis were excluded from the case group. Also, it is likely that patients with other ocular surface pathologies such as allergic conjunctivitis were lumped in with our DE cases. While a prospective study that included an ocular exam and tear film measurement would have been optimal, it would not have been feasible considering the number and distribution of patients in this study. It is also important to consider that our population of US veterans seeking eye care services may not be generalizable to other populations. Regarding our analysis, it was limited by the aggregated nature of the data sets for DE, allergy indices, and meteorological conditions. Further investigation is needed to assess the time-space lag effects of environmental factors, including exposure to pollen and mold spores, on the prevalence of DE, as studied for other disease such as COPD.4
In summary, our study supports the general clinical impression that DE has a seasonal pattern and suggests that different mechanisms may underlie DE in winter versus spring months. This is important as the treatment approach to DE may differ based on whether allergy is a component of disease. Furthermore, environmental manipulations are, in general, more cost effective than medical ones. Understanding which indoor and outdoor environmental conditions, across different seasons, most closely align with DE can open up new treatment algorithms that include environmental manipulation (e.g. air filters, humidifiers indoors, and use of goggles for outdoor environment).
Acknowledgments
We would like to note that the contents of this study do not represent the views of the Department of Veterans Affairs or the United States Government.
Financial support: Supported by the Department of Veterans Affairs, Veterans Health Administration, Office of Research and Development, Clinical Sciences Research and Development’s Career Development Award CDA-2-024-10S (Dr. Galor), NIEHS/NIH grant # ES0140 (Kumar), NIH Center Core Grant P30EY014801, Research to Prevent Blindness Unrestricted Grant, Department of Defense (DOD- Grant#W81XWH-09-1-0675 and Grant# W81XWH-13-1-0048 ONOVA) (institutional).
Footnotes
Conflicts of interest: None
References
- 1.Pouyeh B, et al. Impact of ocular surface symptoms on quality of life in a United States veterans affairs population. Am J Ophthalmol. 2012;153(6):1061–66. e3. doi: 10.1016/j.ajo.2011.11.030. [DOI] [PubMed] [Google Scholar]
- 2.Galor A, et al. Environmental Factors Affect the Risk of Dry Eye Syndrome in a United States Veteran Population. Ophthalmology. 2014 doi: 10.1016/j.ophtha.2013.11.036. [DOI] [PubMed] [Google Scholar]
- 3.Barnes C, et al. Allergenic materials in the house dust of allergy clinic patients. Ann Allergy Asthma Immunol. 2001;86(5):517–23. doi: 10.1016/S1081-1206(10)62899-2. [DOI] [PubMed] [Google Scholar]
- 4.Kumar N, et al. Satellite-based PM concentrations and their application to COPD in Cleveland, OH. Journal of exposure science & environmental epidemiology. 2013;23(6):637–46. doi: 10.1038/jes.2013.52. [DOI] [PMC free article] [PubMed] [Google Scholar]


