

Abstract
To yield cholinesterase (ChE) from prokaryotic expression, the ChE gene that belongs to Daphnia magna was amplified by reverse transcription-polymerase chain reaction (RT-PCR) using forward primer 5'-CCCYGGNGCSAT GATGTG-3' and reverse primer 5'-GYAAGTTRGCCCAATATCT-3'. To express the gene, one sequence of the amplified DNA, which was able to encode a putative protein containing two conserved carboxylesterase domains, was connected to the prokaryotic expression vector PET-29a(+). The recombinant vector was transformed into Escherichia coil BL21 (DE3). Protein expression was induced by isopropy-D-thiogalactoside. The expressed ChE was used as an immunogen to immunize BALB/c mice. The obtained antibodies were tested for their specificity towards crude enzymes from species such as Alona milleri, Macrobrachium nipponense, Bombyx mori, Chironomus kiiensis, Apis mellifera, Eisenia foetida, Brachydanio rerio, and Xenopus laevis. Results indicated that the antibodies had specificity suitable for detecting ChE in Daphnia magna. A type of indirect and non-competitive enzyme-linked immunosorbent assay (IN-ELISA) was used to test the immunoreactive content of ChE (ChE-IR) in Daphina magna. The detection limit of the IN-ELISA was found to be 14.5 ng/ml at an antiserum dilution of 1:22 000. Results from tests on Daphnia magna exposed to sublethal concentrations of triazophos indicated a maximal induction of 57.2% in terms of ChE-IR on the second day after the animals were exposed to a concentration of 2.10 μg/L triazophos. Testing on animals acclimatized to a temperature of 16 °C indicated that ChE-IR was induced by 16.9% compared with the ChE-IR content detected at 21 °C, and the rate of induction was 25.6% at 10 °C. The IN-ELISA was also used to test the stability of ChE-IR in collected samples. Repeated freezing and thawing had no influence on the outcome of the test. All these results suggest that the polyclonal antibodies developed against the recombinant ChE are as efficient as those developed against the native ChE in detecting ChE content in Daphnia magna.
Keywords: Daphnia magna, Cholinesterase (ChE), Polymerase chain reaction (PCR), Recombinant protein ChE, Enzyme-linked immunosorbent assay (ELISA), Triazophos
1. Introduction
Cholinesterases (ChEs) are a group of serine hydrolases that are liable to be inhibited, either in vivo or in vitro, by anticholinesterases such as organophosphates (OPs) and carbamates (CBs) (Villatte and Bachmann, 2002; Hackenberger et al., 2008). This extraordinary characteristic makes it possible to use them to predict field existence and stress induced by these chemicals (Sanchez-Hernandez et al., 1998; Stien et al., 1998; Cajaraville et al., 2000; den Besten et al., 2001; Abdel-Halim et al., 2006; Denoyelle et al., 2007; Sáenz et al., 2010; van Oosterom et al., 2010; Printes et al., 2011). To this end, the “normal” activity of ChE should first be confirmed.
It is known that in vivo activity of ChE is affected by inherent factors, such as age, genotype, circadian rhythms, sex, and nutritional status. External factors such as food supply, ambient temperature, and water quality can also alter in vivo activity of the enzyme (Hill, 1989; Sturm et al., 1999; Phillips et al., 2002; Xuereb et al., 2007; Garabrant et al., 2009). These factors impair determination of the “normal” activity of ChE and thus hinder identification of “abnormal” activity, including that caused by anticholinesterases.
“Normal” activity is a feature that is determined by the molecular structure of the enzyme. Neither the inherent nor the external factors can change activity without altering the content of the enzyme in the body. To ascertain the “normal” activity of ChE in samples, a technique is required that is capable of quantifying the content of the enzyme. Due to its quick, sensitive, and cost-effective nature, an immunoassay, such as enzyme-linked immunosorbent assay (ELISA), is well suited for fulfilling this task (Khattab et al., 1994; Li et al., 2005; Khattab and Ali, 2007).
Daphnia magna is a species of zooplankton that belongs to the phylum Arthropoda, Class Crustacea, Order Cladocera, and Family Daphniidae. It consumes algae and other small phytoplanktons and in turn acts as prey for freshwater fish and large aquatic invertebrates. Due to its worldwide distribution and the importance of the species in maintaining the sustainability of aquatic ecosystems, the animal has long been noted for its responses in terms of ChE during anticholinesterase exposure (Gälli et al., 1994; Guilhermino et al., 1996; Sturm and Hansen, 1999; Barata et al., 2001; Carvalho et al., 2003; Duquesne, 2006; Vesela et al., 2006; Damásio et al., 2007; Jemec et al., 2007; Printes et al., 2008; Duquesne and Küster, 2010; Coelho et al., 2011; Li and Tan, 2011).
For better utilization of the species in predicting field exposure to OPs and CBs, a batch of polycolonal antibodies has been produced by immunizing mice with a type of ChE separated from whole bodies of Daphnia magna (Liu et al., 2012a). The procedure proved to be laborious and inefficient, and had low throughput, and both the quality and quantity of the antibodies were limited by the status of the population from which the immunogens (i.e. Daphnia magna ChEs) were separated. A more effective method for producing the immunogen is therefore needed.
The development of molecular biology makes it possible to produce the immunogen within strains of bacteria or fungi. To do so, the ChE gene should be amplified and then expressed. The aim of this study was to produce polyclonal antibodies against the recombinant protein ChE of Daphnia magna, to determine characteristics of the antibodies, and to explore the efficiency of the antibodies in utilization.
According to published information, no type of ChE gene has been amplified from species that belong to the Class Crustacea. However, several types of ChE have been amplified from insects such as Aedes aegypti (Anthony et al., 1995), Aphis gossypii (Li and Han, 2002), Plutella xylostella (Ni et al., 2003), Pseudophacopteron canarium (Lin et al., 2007), Culex pipiens (Li et al., 2007), Drosophila melanogaster (Zhang, 2008), and Anopheles gambiae (Jiang et al., 2009). Among these, some have been expressed in strains of bacteria or fungi (Anthony et al., 1995; Li et al., 2007; Zhang, 2008; Jiang et al., 2009). The results of these studies were helpful for designing primers and selecting vectors and hosts in the present study.
2. Materials and methods
2.1. Reagents
Host bacteria, Escherichia coli BL21 (DE3) and E. coli DH5α, were donated by the Institute of Biotechnology, Zhejiang University, China. The pMD19-T vector, PET-29a(+) plasmid, Expand High Fidelity PCR system, HisTALON™ Gravity Columns Purification Kit, DNA Recovery Kit, and all of the restriction enzymes were purchased from TaKaRa (Dalian, China). Horseradish peroxidase (HRP)-labelled goat anti-mouse immunoglobulin G (IgG), Coomassie Brilliant Blue G-250, acetylthiocholine iodide, propionylthiocholine iodide, Freund’s complete adjuvant, Freund’s incomplete adjuvant, and bovine serum albumin (BSA, with a molecular weight (MW) of 67 000) were purchased from Sigma-Aldrich (Steinheim, Germany). Tramethylbenzidine (TMB), which consists of solutions A and B, was purchased from the Yingchuang Company (Huzhou, China). TRIzol Kit and Amplex Red Acetylcholine/Acetylcholinesterase Assay Kit (A12217) (which contains Amplex Red reagent, dimethyl sulfoxide, HRP, hydrogen peroxide, and choline oxidase originating from Alcaligenes sp., etc.) were bought from Invitrogen (Eugene, Oregon, USA). Defatted milk was purchased from the Shanghai Chemical Reagents Company (Shanghai, China). All other chemicals were sourced domestically and were of analytical grade, unless otherwise stated.
2.2. Daphnia magna
The organisms employed in this study were obtained from the Chinese Center for Disease Control and Prevention (Beijing, China) and belong to breed 62 of Daphnia magna (DM). The breed was maintained in M4 medium (Elendt and Bias, 1990) and fed with unicellular algae Scenedesmus subspicatus. The following settings were maintained: water temperature (22±1) °C, pH 7.8±0.2, light intensity 1500‒2500 lx, and a light cycle of 16 h light to 8 h dark.
2.3. RNA isolation, cDNA synthesis, and PCR
About 1 g of Daphnia magna was used as a sample for total RNA isolation. The Daphnia magna was ground in liquid nitrogen. The ground sample was stored at −80 °C until used. Isolation was performed using the TRIzol Kit according to the manufacturer’s instructions. The quality of the isolation was assessed at 260 and 280 nm by NanoDrop ND1000 (Thermo Fisher Scientific, Waltham, MA, USA). Agarose electrophoresis, using Nucleic Acid Horizontal Electrophoresis Units (Bio-Rad Inc., USA), was carried out to visualize the integrity of the isolated RNA. The gel was stained with ethidium bromide (EB) and displayed using a gel-imaging analysis system Tanon-2500 (Tanneng Co. Ltd., Shanghai, China).
First strand complementary DNA (cDNA) was synthesized from 1 μg of total RNA. One microliter of oligo(dT)15 and 1 μl of diethyl phosphorocyanidate (DEPC) water were added to 4 μl of RNA. After 5 min incubation at 70 °C, the mixture was placed on ice and 2 μl 5×buffer, 1 μl (200 U) ribonuclease inhibitor, and 1 μl of 10 mmol/L 2'-deoxynucleoside 5'-triphosphate (dNTP) mixture were added. After another 70 °C incubation for 10 min, 1 μl (200 U) RevertAid™ H Minus M-MuLV reverse transcriptase was added and the mixture was incubated at 42 °C for 60 min. The cDNA obtained was stored at −20 °C until used for polymerase chain reaction (PCR).
The ChE gene was amplified to take 5'-CCCYG GNGCSATGATGTG-3' and 5'-GYAAGTTRGCCCA ATATCT-3' as forward and reverse primers, respectively. One microliter of forward primer (10 mmol/L), 1 μl reverse primer (10 mmol/L), 2 μl dNTP mixture (2.5 mmol/L), 2.5 μl 10×Ex Taq buffer, 0.125 μl TaKaRa Ex Taq DNA polymerase, and 17.125 μl double-distilled water (ddH2O) were added to 1.25 μl cDNA. The total volume was 25 μl. The amplification started with 2 min pre-denaturation at 94 °C, followed by 33 cycles of 45 s denaturation at 94 °C, 40 s annealing at 52 °C, and 30 s extension at 72 °C, and the protocol was terminated after 10 min more of extension at 72 °C. The above procedure was completed using PTC-200 (Bio-Rad Inc., USA). The PCR products were analyzed by agarose electrophoresis. The isolates were stained with EB. To obtain purified DNA, the gel was cut and treated using a DNA Recovery Kit.
2.4. Gene transformation and sequence analysis
For connecting the amplified DNA to the vector pMD19-T, 4.5 μl purified DNA was mixed with 0.5 μl pMD19-T and 5.0 μl Solution I. The mixture was incubated at 16 °C for 3 h to finish the connection. The 10 μl of connected vector was spiked into 100 μl of competent cells of E. coli DH5α. The cell suspension was kept at 42 °C for 90 s and then kept on cold ice for at least 10 min to finish the transfection. To revive the cells to express the inserted ChE gene, the cell suspension was incubated in LB liquid medium for 1 h at 37 °C. To verify the transfection, the cell suspension was inoculated on an LB plate medium that contained 100 μg/ml ampicillin and incubated overnight at 37 °C. The untransfected cells of E. coli DH5α were incubated in the same way to serve as negative controls. Colonies appearing on the plate were collected and incubated for 6‒8 h in LB liquid medium at 37 °C. The cell suspension was collected and used as a template to carry out PCR. Agarose electrophoresis of the PCR products was carried to visualize the result, and the isolates were stained with EB.
Cells that were confirmed by PCR to be transfected were sent to Sangon Biotech for gene sequence analysis. The results and the deduced amino acid sequences were compared using the National Center for Biotechnology Information (NCBI) BLAST network sources (http://www.ncbi.nlm.nih.gov/BLAST).
2.5. Generation of expression vectors and expression of ChE protein
To start protein expression, gene amplification was performed using the forward primer 5'-CCGA ATTCCCCYGGNGCSATGATGTG-3' that contains restriction site EcoRI, and the reverse primer 5'-GC GTCGACGYAAGTTRGCCCAATATCT-3' that contains restriction site SalI. The PCR products were digested with the restriction endonucleases EcoRІ and SalI and then ligated into the plasmid pET-29a(+) that was digested with the same enzymes. The recombinant plasmid pET-29a(+)-ChE was transfected into competent E. coli BL21 (DE3). To confirm the transfection, the recombinant plasmids were separated from the cells and digested with the above-mentioned restriction endonucleases. Meanwhile, the cell suspension was used as a template to carry out PCR. Agarose electrophoresis was performed to visualize the results of the PCR and enzyme digestion, and the isolates were stained with EB.
Clones of E. coli BL21 (DE3) with the correct transformation were cultured at 37 °C in LB liquid medium containing 50 μg/ml kanamycin to achieve log phase growth of the bacteria. Isopropy-D-thiogalactoside (IPTG) was added, at a final concentration of 0.2 mmol/L, to induce protein expression in condition in which the optical density at 600 nm (OD600) of the culture reached a value of 0.5–0.6. After 4 h induction, the culture was centrifuged for 15 min at 10 000g at 4 °C. Sodium dodecyl sulfate polyacrylamide gel electrophoresis (SDS-PAGE) was performed to visualize the expression, and the isolates were stained with Coomassie Brilliant Blue G-250.
2.6. Purification and renaturation of recombinant protein ChE
Clones with the correct transformation were cultured on a large scale using the procedure described above. The cells were harvested by centrifugation for 20 min at 8000g at 4 °C and resuspended in 6 ml cold HisTALON×Tractor buffer. After being spiked with 3 μl of nuclease, the resuspended cells were lysed on ice by sonication (200 W, 99 cycles of 3 s working and 5 s rest) and centrifuged for 20 min at 8000g at 4 °C. The supernatant was used as the source of the recombinant ChE.
The supernatants were batch-purified by nickel-nitrilotriacetate (Ni-NTA) affinity chromatography according to the manufacturer’s instructions. Briefly, a 50% slurry of Ni-NTA was added at a ratio of 1:4 (v/v) to the supernatant and mixed gently by shaking for 60 min at room temperature. The mixture was carefully loaded into an empty column of 20 cm×1.2 cm. The column was washed with ten volumes of washing buffer and then eluted with five volumes of elution buffer. The eluent was added drop-by-drop to refolding buffer (0.1 mol/L Tris/HCl, 1.5 mmol/L reduced glutathione, 0.3 mmol/L oxidized glutathione, 0.35 mol/L guanidinium chloride, and 0.5 mol/L L-arginine, pH 8.0) with stirring, and then stored at 4 °C for 24 h to ensure adequate renaturation. Finally, the solution of the refolded recombinant protein was concentrated by ultrafiltration (Minitan ultrafiltration membrane with normal molecular weight limit (NMWL): 20 000; Millipore Corp., Bedford, MA, USA). At each purification step, the recombinant protein was assessed by SDS-PAGE, accompanied by staining with Coomassie Brilliant Blue G-250.
2.7. ChE activity measurement
Total activity of the recombinant protein was measured by a relatively sensitive method developed by Zhou et al. (2000). The protocol was in accord with that described by Liu et al. (2012a) and Yang et al. (2013). Acetylthiocholine iodide and propionylthiocholine iodide were used as substrates in this protocol. The protein content of the samples was determined by the method of Bradford (1976) using BSA as the reference.
2.8. Production of polyclonal antibodies against the recombinant protein ChE
2.8.1. Immunization of BALB/c mice
Two individuals of the BALB/c mice (7 weeks old) were immunized subcutaneously with the refolded recombinant protein ChE (Section 2.6) mixed with an equal volume of Freund’s complete adjuvant. The mice were booster-immunized with the protein once every two weeks. At the same time, another two mice that were immunized with phosphate buffered saline (PBS) were used as negative controls and another that was not immunized was taken as a blank control. Blood was collected 7 d after the last immunization, clarified by 3‒4 h incubation at 4 °C, and centrifuged for 15 min at 3000g. The supernatant was collected as antiserum and stored at −20 °C.
2.8.2. Determination of titer of antiserum
A type of indirect and non-competitive ELISA was carried out to detect titers of the antiserum (Liu et al., 2012b). To start the procedure, the microplate was coated with 10 μg/ml of recombinant protein ChE (dissolved in 50 mmol/L carbonate-bicarbonate buffer, pH 9.6) by overnight incubation at 4 °C. The plate was washed three times with PBST (i.e. 10 mmol/L PBS containing 0.05% Tween 20, pH 7.4) and then blocked by 0.5 h incubation with 2% (0.02 g/ml) skim milk in PBS (300 μl/well) at 37 °C. After another step of washing, antiserum of various dilutions (1:16 000, 1:18 000, 1:20 000, 1:22 000, 1:24 000, 1:26 000, 1:28 000, and 1:30 000) that was diluted with PBST was added (100 μl/well). After 1 h incubation at 37 °C, the plate was washed and 100 μl of diluted (1:5000) goat anti-mouse IgG-HRP was added. After another 1 h incubation at 37 °C, the plate was washed and 100 μl TMB solution (i.e. a mixture of 400 μl 0.6% (6 mg/g) TMB dissolved with dimethyl sulfoxide (DMSO) and 100 μl 1% (0.01 g/ml) H2O2 with 25 ml citrate-acetate buffer of pH 5.5) was added to activate the peroxidase reaction. The reaction lasted for 30 min and was stopped by adding 50 μl 2 mol/L H2SO4. The optical absorbance was measured at 450 nm (OD450) by a Model 680 microplate reader (Bio-Rad Inc., Hercules, CA, USA). The titer of the antiserum was determined as the dilution that gave an OD450 closest to the value of 1.0.
2.8.3. Determination of cross-reactivity
Species such as Daphnia magna, Alona milleri, Macrobrachium nipponense, Bombyx mori, Chironomus kiiensis, Apis mellifera, Brachydanio rerio, Eisenia foetida, and Xenopus laevis were employed as test species to prepare crude enzymes (antigens). Samples of Alona milleri and Chironomus kiiensis were collected from a pond within Huajiachi Campus, Zhejiang University, Hangzhou, Zhejiang Province, China. The Macrobrachium nipponense were purchased as sexually mature adults (>50 d) from the Hangzhou Dayang Aquaculture Company, Zhejiang Province. The Bombyx mori (variety Qiufeng×Baiyu) were purchased as diapaused eggs from the Silkworm Egg Production Company, Hangzhou, Zhejiang Province. The Apis mellifera were purchased as a queen colony from a beekeeper in Deqing, Zhejiang Province. The Brachydanio rerio (Tuebingen breed) were purchased as adults (≥60 d) from the China Zebrafish Resource Centre, Wuhan, Hubei Province. The Eisenia foetida (Taiping-2 breed) were purchased from an earthworm culturist in Jinhua, Zhejiang Province. Adult Xenopus laevis were kindly donated by the Guangzhou Institute of Biomedicine and Health, Chinese Academy of Sciences, Guangdong Province, China.
The Daphnia magna and Alona milleri were raised in the same conditions, as described in Section 2.2. Sexually mature adults were employed as specimens. The Chironomus kiiensis and Xenopus laevis were bred in tap water. Individuals of both species were raised from eggs. For Chironomus kiiensis, the larvae of the 4th instar were used, and for Xenopus laevis, tadpoles of stages 51‒56. The eggs of Bombyx mori were induced to hatch before use. The larvae were fed with mulberry leaf. Those at the beginning of the 2nd instar were used as specimens. The bee colony was placed in a field and the worker bees were collected just before being used. The Eisenia foetida were raised in garden soil and fed with cow manure. Adults about 60 d old (with clitellum) were used as specimens. The adults obtained of Macrobrachium nipponense and Brachydanio rerio were temporarily raised in tap water and fed with commercial fish food for at least 7 d before being used.
In a proportion of 1:5 (w:v), the whole bodies (or tissues) of the animals were homogenized in ice-cold buffer containing 0.25% (2.5 g/L) Triton X-100, 1 mmol/L ethylenediaminetetraacetic acid (EDTA), and 50 mmol/L Tris (pH 7.5). After 30 min centrifugation at 10 000g and at 4 °C, the supernatant was collected as crude enzyme. The protein content of the crude enzyme was measured using the method of Bradford (1976).
Serially diluted antiserum was allowed to react with crude enzymes according to the procedure described in Section 2.8.2 to determine the titers of the antiserum for different species. Before the test, the crude enzymes were diluted to a concentration of 4.7 mg protein/ml and the antiserum was diluted in series to ensure that optical absorbance close to the value of 1.0 could be obtained. The cross-reactivity of the antiserum was expressed as the ratio of the titer of the antiserum for Daphnia magna to that of the test species.
The ChE activity of the crude enzymes was determined using propionylthiocholine iodide as substrate by the method described by Liu et al. (2012a) and Yang et al. (2013).
2.9. Development of ELISA
2.9.1. To determine optimal dilutions of antiserum
To investigate the optimal dilutions of antiserum for the ELISA, serially diluted antiserum (1:18 000, 1:20 000, 1:22 000, 1:24 000, 1:26 000, and 1:28 000) was used to react with recombinant protein ChE at 0.3, 0.6, 1.2, 2.5, 5.0, 7.0, 9.6, 15.0, and 20.0 μg/ml, respectively, according to the procedure described in Section 2.8.2. The optimal dilution of antiserum against a certain level of antigen was determined as the titer.
2.9.2. To establish a standard curve for determination of immunoreactive content of ChE (ChE-IR)
Recombinant protein ChE at various concentrations was allowed to react with antiserum according to the procedure described in Section 2.8.2. Dilution of the antiserum was in accordance with results of the experiment performed in Section 2.9.1.
The concentration of recombinant ChE was taken as the independent variable (x) and the measured OD450 as the dependent variable (y) to establish the standard curve of y=a(1–e−bx) by CurveExpert 1.3 following the route of “apply fit-user model…”.
2.9.3. To determine the detection limit of ELISA
Samples that contained no recombinant protein ChE were used to react with antiserum according to the procedure described in Section 2.8.2. Dilution of the antiserum was the same as that adopted in Section 2.9.1. The values at OD450 were used to calculate the average (Ā) and the standard deviation (S). The test limit (x min) was calculated using the formula x min=Ā−2S (Yang et al., 1998). The standard curve, as established in Section 2.9.2, was taken to simulate the detection limit (y min) of ELISA.
2.9.4. To determine the precision of ELISA
To determine the precision (i.e. repeatability) of the ELISA, different concentrations of recombinant protein ChE (1, 2, 4, 6, 8, and 10 μg/ml) were used to react with antiserum according to the procedure described in Section 2.8.2. Each concentration was spiked in 3 batches, each consisting of 15 replicates. Dilution of the antiserum was the same as that used in Section 2.9.2.
2.10. Applicability of the antiserum
2.10.1. Detecting ChE-IR in Daphnia magna exposed to sublethal concentrations of triazophos
Concentrations of triazophos of 0.06, 0.35, and 2.10 μg/L were used, corresponding to 1/216, 1/36, and 1/6 half maximal effective concentration (EC50) of the insecticide, respectively (Liu et al., 2012a). The insecticide was spiked as a working solution of acetone. The final concentration of the acetone in dilutions (including the control) was set at 13 μg/L. The Daphnia magna were raised in 500-ml beakers that each contained 400 ml of a given triazophos dilution. Ten beakers were used for each of the concentrations (including the control). To start the exposure, 100 Daphnia magna of 7 to 14 d old were introduced to each beaker. The exposure lasted 21 d. Specimens were collected on the 2nd, 6th, 10th, 14th, 18th, and 21st days.
The collected specimens were used to prepare the crude enzymes at 4.7 mg protein/ml according to the protocol described in Section 2.8.3. The content of ChE in the crude enzyme was determined according the protocol described in Section 2.8.2. The dilution of the antiserum was the same as that adopted in Section 2.9.2.
2.10.2. Detecting ChE-IR in Daphnia magna acclimatized to different water temperatures
Daphnia magna 7 to 14 d old were acclimatized to water temperatures of 10, 16, or 21 °C for 21 d. Specimens were collected at the end of the acclimatization. The collected specimens were used to prepare crude enzymes at 4.7 mg protein/ml according to the protocol described in Section 2.8.3. The content of ChE in the crude enzymes was determined using the protocol described in Section 2.8.2. Dilution of the antiserum was the same as that used in Section 2.9.2.
2.10.3. Detecting the impact of repeated freeze-and-thaw on ChE-IR levels in collected samples
Daphnia magna were collected from a population acclimatized to a water temperature of 21 °C. After collection, the specimens were subjected to two treatments, i.e. either six or twelve cycles of sequential freeze-and-thaw. During each cycle the specimens were frozen at −80 °C for 12 h and then thawed at 22.3 °C for 12 h. Specimens that were not subjected to freeze-and-thaw were used as controls.
Crude enzymes at 4.7 mg protein/ml were prepared according to the protocol described in Section 2.8.3. The content of ChE in the crude enzymes was determined according to the protocol described in Section 2.8.2. The dilution of the antiserum was the same as that used in Section 2.9.2.
2.11. Statistical analysis
One-way analysis of variance (ANOVA) and the consequent comparisons among treatments were conducted using data processing software DPS© following the route of “experimental statistics→ completely randomized design One-way ANOVA→ Duncan method”.
3. Results
3.1. Sequence of ChE gene amplified from Daphnia magna
Based on the cDNA of Daphnia magna, DNA segments of about 200, 350, and 700 bp were obtained by PCR using 5'-CCCYGGNGCSATGATGT G-3' as forward primer and 5'-GYAAGTTRGCCC AATATCT-3' as reverse primer (Fig. 1b). After collection and purification, the segments were connected to pMD19-T and then introduced into E. coli DH5α. The cells with correct transfections were sent for DNA sequence analysis. Results of the analysis indicated a 717-bp (Fig. 1c) nucleotide open reading frame (ORF) that encoded a putative protein consisting of 239 amino acid residues with a calculated molecular mass of 26 kDa. Sequence alignment at amino acid level indicated that the putative protein contained two conserved carboxylesterase domains: characteristic site 2 of carboxylesterase B (EDCLFIN IVTP) and serine activity site of carboxylesterase B (FGGNPHNITLFGESAG) (Fig. 2). The DNA segments of about 200 and 350 bp showed low homology with the sequences of ChE.
Fig. 1.
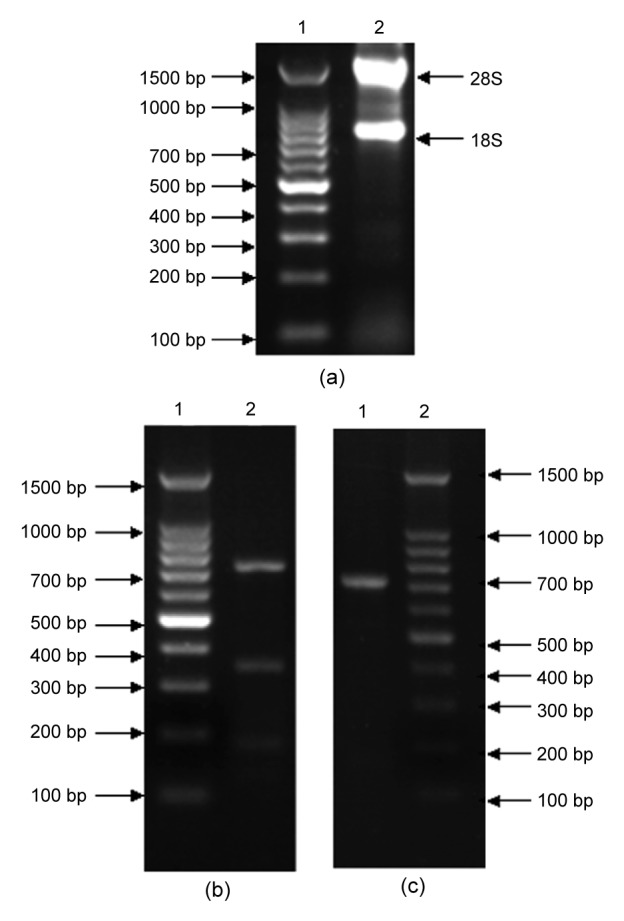
Results of PCR amplification
(a) Result of RNA isolation. Lane 1: 100 bp DNA ladder;Lane 2: total RNA. (b, c) Result of PCR using cDNA as template. (b) Lane 1: 100 bp DNA ladder; Lane 2: PCR product which indicates gene segments of about 200, 350,and 700 bp. (c) Lane 1: purified PCR product of about 700 bp; Lane 2: 100 bp DNA ladder
Fig. 2.

cDNA nucleotide sequence and deduced amino acid sequence of ChE gene in Daphnia magna
The underlined sequence represents characteristic site 2 of B type of carboxylesterases. The framed sequence represents serine active site of B type of carboxylesterases
3.2. Expression vectors
ChE genes were amplified using primers containing the restriction sites EcoRІ and SalI. The PCR fragment was then inserted into expression vector pET-29a. The expression vector obtained was a band of about 750 bp, identified by PCR amplification using the cell suspension as a template (Fig. 3a). Subsequent digestion with EcoRІ and SalI produced DNA bands of 750 and 2500 bp that represented the target gene and the gene that belonged to the vector, respectively (Fig. 3b). These results indicated that the expression vector pET-29a(+)-ChE had been successfully constructed.
Fig. 3.
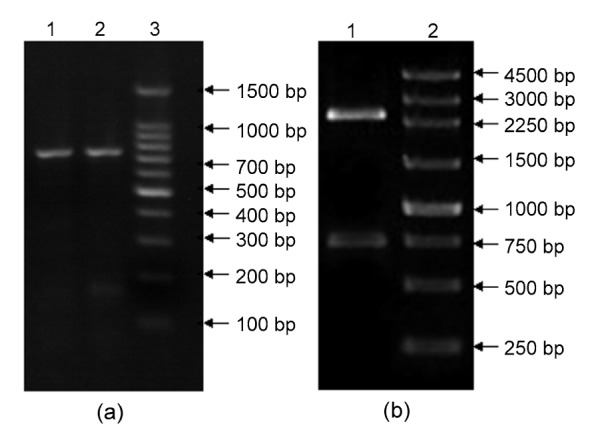
Identification of the recombinant plasmid pET-29a(+)-ChE by PCR (a) and by restriction enzyme EcoRI and SalI (b)
(a) Lanes 1 and 2: result of PCR amplification using trans-fected cells as template; Lane 3: 100 bp DNA Ladder.(b) Lane 1: digested pET-29a(+)-ChE by EcoRI and SalI;Lane 2: 250 bp DNA ladder marker
3.3. Recombinant protein ChE
Results of SDS-PAGE for the transfected E. coli BL21 (DE3) and its inclusion bodies are summarized in Fig. 4. The recombinant protein ChE, which had an expected molecular weight of 26 kDa, appeared as one of the major products in the cell lysates (Fig. 4a). A single band of 26 kDa was obtained after the Ni-NTA affinity chromatography (Section 2.6) (Fig. 4b).
Fig. 4.
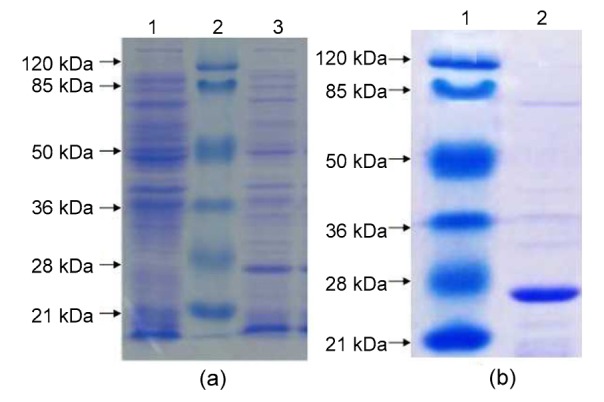
SDS-PAGE analyses of ChE expression
(a) Lane 1: total protein of E. coli strain BL21 (DE3) transfected with plasmid pET-29a(+) (control); Lane 2: protein molecular weight standards; Lane 3: total protein of E. coli strain BL21 (DE3) containing recombinant plasmid pET-29a(+)-ChE. (b) Lane 1: protein molecular weight standards; Lane 2:inclusion bodies purified by HisTALONTM Gravity Column chromatography
3.4. Activity of recombinant protein ChE
The activity of the recombinant ChE was investigated using acetylthiocholine iodide and propionylthiocholine iodide as substrates, respectively. The ChE was able to hydrolyze propionylthiocholine (Table 1), but it was virtually inactive towards acetylthiocholine (Table 2).
Table 1.
Activity of purified recombinant protein ChE towards propionylthiocholinea
| c (μg/ml) | Activityb (U/ml) | RSD (%) | n |
| 0.2 | 0.102±0.009 | 8.8 | 3 |
| 2.0 | 0.878±0.036 | 4.1 | 3 |
| 20.0 | 9.773±0.740 | 7.6 | 3 |
c: concentration of purified protein; RSD: relative standard deviation; n: number of replicate.
Taking 100 mmol/L propionylthiocholine iodide as substrate
The data are expressed as mean±standard deviation
Table 2.
Activity of purified recombinant protein ChE towards acetylthiocholinea
| c (μg/ml) | Activityb (U/ml) | RSD (%) | n |
| 0.2 | 0.024±0.002 | 8.3 | 3 |
| 2.0 | 0.023±0.002 | 8.7 | 3 |
| 20.0 | 0.026±0.003 | 11.5 | 3 |
c: concentration of purified protein; RSD: relative standard deviation; n: number of replicate.
Taking 100 mmol/L acetylthiocholine iodide as substrate
The data are expressed as mean±standard deviation
3.5. Properties of the antiserum
3.5.1. Titer of antiserum
Values of OD450 corresponding to a series of dilutions of antiserum are summarized in Fig. 5. Differences in terms of OD450 correspond to Antiserum 1 and Antiserum 2. Since the immunogen employed was identical in this study, it is reasonable to believe that the difference was caused by the mice and that the immunoreactive character of the antibodies had little influence.
Fig. 5.
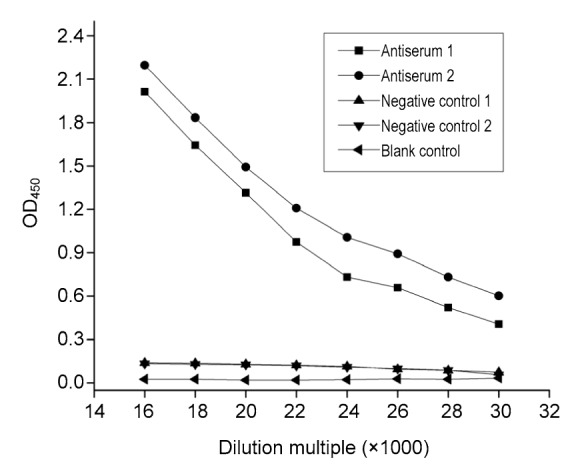
Titer of antiserum
Concentration of recombinant protein ChE was set to be 10 μg/ml. Values were means of three separate measurements
Based on the definition given in Section 2.8.2, the titers of Antiserum 1 and Antiserum 2 were 1:24 000 and 1:22 000, respectively, against a ChE concentration of 10 μg/ml (Fig. 5).
As the titer of Antiserum 1 was higher than that of Antiserum 2, subsequent tests were conducted with Antiserum 1 unless otherwise stated.
3.5.2. Cross-reactivity of antiserum
Table 3 shows rates of cross-reaction of the antiserum with the ChEs of different species. Taking the titer of the antiserum for Daphnia magna as reference, the antiserum showed high rates of cross-reaction (i.e. 33.33% and 18.67%, respectively) with the enzymes from Alona milleri and Macrobrachium nipponense, two species that belong to the Class Crustacea, whereas it showed low rates of cross-reaction (i.e. 5.33%, 3.53%, 3.07%, 0.87%, 2.20%, 2.33%, and 0.67%) with Bombyx mori, Chironomus kiiensis, Apis mellifera, Eisenia foetida, Brachydanio rerio (brains), Brachydanio rerio (whole bodies without brain), and Xenopus laevis (tadpoles), respectively (Table 3).
Table 3.
Rate of cross-reaction of antiserum with ChEs from different species
| Species | Titer of antiserum | Rcr a(%) | AChE b(U/mg protein) |
| Daphnia magna | 1:15 000 | 100.00 | 6.52±0.22 |
| Alona milleri | 1:5000 | 33.33 | 5.80±0.14 |
| Macrobrachium nipponense | 1:2800 | 18.67 | 11.51±1.21 |
| Bombyx mori | 1:800 | 5.33 | 1.76±0.37 |
| Chironomus kiiensis | 1:530 | 3.53 | 0.20±0.18 |
| Apis mellifera | 1:460 | 3.07 | 18.74±2.64 |
| Eisenia foetida | 1:130 | 0.87 | 5.51±1.39 |
| Brachydanio rerio (brains) | 1:330 | 2.20 | 87.58±6.72 |
| Brachydanio rerio (whole bodies without brain) | 1:350 | 2.33 | 67.43±4.58 |
| Xenopus laevis (tadpoles) | 1:100 | 0.67 | 1.22±0.47 |
R cr: cross-reactivity rate; A ChE: ChE activity in crude enzyme.
Rate of cross-reaction was calculated as: (antiserum titer for Daphnia magna)/(antiserum titer for test species (or tissue))×100%.
The concentration of the crude enzymes was 4.7 mg protein/ml; the data are expressed as mean±standard deviation
3.6. Development of ELISA
3.6.1. Optimal dilutions of antiserum
Results of the measurement of optical absorbance corresponding to various dilutions of antiserum and concentrations of antigen are listed in Table 4. Based on the definition given in Section 2.9.1, the optimal dilution of antiserum should be 1:22 000 at ChE concentrations of 7.0, 9.6, 15.0, and 20.0 μg/ml, 1:20 000 at a ChE concentration of 5.0 μg/ml, and 1:18 000 at a ChE concentration of 2.5 μg/ml. As all values of OD450 were much lower than 1.0 at ChE concentrations of ≤1.2 μg/ml, it is reasonable to infer that to upgrade the value of OD450, dilution of the antiserum needs to be reduced.
Table 4.
OD450 values corresponding to different dilutions of antiserum and different concentrations of antigen
| Dilution of antiserum (×1000) | OD450
|
||||||||
| 0.3 μg/ml* | 0.6 μg/ml | 1.2 μg/ml | 2.5 μg/ml | 5.0 μg/ml | 7.0 μg/ml | 9.6 μg/ml | 15.0 μg/ml | 20.0 μg/ml | |
| 28 | 0.119 | 0.124 | 0.177 | 0.361 | 0.536 | 0.547 | 0.572 | 0.671 | 0.708 |
| 26 | 0.121 | 0.137 | 0.202 | 0.407 | 0.647 | 0.655 | 0.706 | 0.765 | 0.768 |
| 24 | 0.153 | 0.175 | 0.254 | 0.465 | 0.716 | 0.725 | 0.779 | 0.884 | 0.886 |
| 22 | 0.165 | 0.183 | 0.303 | 0.580 | 0.944 | 0.984 | 0.994 | 1.063 | 1.097 |
| 20 | 0.173 | 0.214 | 0.407 | 0.705 | 0.984 | 1.013 | 1.229 | 1.035 | 1.138 |
| 18 | 0.229 | 0.293 | 0.546 | 0.917 | 1.369 | 1.387 | 1.516 | 1.684 | 1.664 |
Concentration of purified recombinant protein ChE
3.6.2. Standard equation for determination of ChE-IR
The standard equation for determining the immunoreactive content of ChE was established at an antiserum dilution of 1:22 000. The relationship between signal (y) and concentration of recombinant ChE (x) follows the equation y=1.628(1–e–0.1401x) with a correlation coefficient (r) of 0.9981 and a standard deviation (S) of 0.0251 (Fig. 6). The curve includes four points that are within the upper asymptote. It seems that samples with a ChE concentration of >10 μg/ml cannot be accurately quantified at antiserum dilutions of >1:22 000.
Fig. 6.
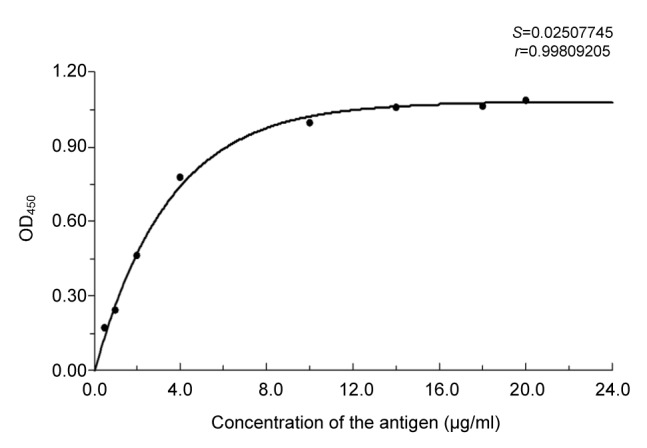
Standard curve for determining content of immunoreactive ChE
The data were the means of three determinations
3.6.3. Detection limit of ELISA
The result of ten observations of “0” samples (i.e. samples that contained no ChE) indicated that the average (Ā) and the standard deviation (S) of OD450 were 0.0087 and 0.0027, respectively. By inserting Ā and S into the formula y min=Ā−2S, a y min of 0.0033 is obtained. Inserting the value of 0.0033 into the standard equation shown above, a detection limit of 14.5 ng/ml is obtained.
3.6.4. Precision of ELISA
Actual levels of spiked ChE were tested at an antiserum dilution of 1:22 000. The results of the test are listed in Table 5. The relative standard deviations (RSDs) of inter- and intra-batches were 3.17 and 3.90, respectively.
Table 5.
Repeatability of indirect and non-competitive ELISA
| Spiked level of ChE (μg/ml) | Batch | Replicates per batch | ChE-IR (μg/ml) | RSD (%) |
||
| Inter-batch | Intra-batch | Total | ||||
| 1 | 3 | 15 | 0.9854 | 3.49 | 4.36 | 5.20 |
| 2 | 3 | 15 | 1.9945 | 1.93 | 1.03 | 2.04 |
| 4 | 3 | 15 | 4.0878 | 2.01 | 3.12 | 4.08 |
| 6 | 3 | 15 | 6.0285 | 2.41 | 3.57 | 4.87 |
| 8 | 3 | 15 | 7.8579 | 4.71 | 5.62 | 6.71 |
| 10 | 3 | 15 | 9.8742 | 4.49 | 5.70 | 6.15 |
RSD: relative standard deviation
3.7. Applicability of antiserum
3.7.1. ChE-IR in Daphnia magna exposed to sublethal concentrations of triazophos
Fluctuations of ChE-IR in exposed Daphnia magna were tested at an antiserum dilution of 1:22 000. The results are listed in Fig. 7. Induction in terms of ChE-IR was detected throughout most of the period of exposure. The maximal induction detected was 57.2% on the second day of exposure to 2.10 μg/L triazophos. The rate of induction declined over time. No induction could be detected at any of the three concentrations (2.10, 0.35, and 0.06 μg/L) 21 d after the start of exposure.
Fig. 7.
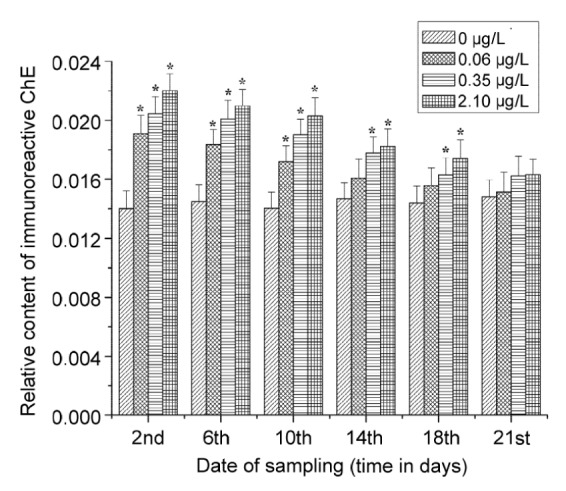
Fluctuation of ChE-IR in Daphnia magna magna exposed to triazophos of 0, 2.10, 0.35, and 0.06 μg/L, respectively
Heights of the columns represented the ratios of ChE-IR and total protein content in crude enzyme. Bars represent stand- ard divisions of three samples. Each sample consisted of 100 pooled specimens collected randomly from 10 replications of a treatment group. The columns marked by asterisks (*) are significantly different from control (P<0.05)
3.7.2. ChE-IR in Daphnia magna acclimatized to different water temperatures
ChE-IR in Daphnia magna acclimatized to different water temperatures was tested at an antiserum dilution of 1:22000. The results are listed in Table 6. The induction of immunoreactive content of ChE was greater at lower temperatures. The rate of induction was 16.9% at 16 °C and 25.6% at 10 °C.
Table 6.
Effect of water temperature acclimatization on ChE-IR in Daphnia magna
| Tw (°C) | ChE-IRa(μg/mg protein) | RSD (%) | n | Percentage of induced ChE (%) |
| 21 | 0.0160±0.0010 | 6.3 | 3 | |
| 16 | 0.0187±0.0007* | 3.7 | 3 | 16.9 |
| 10 | 0.0201±0.0011* | 5.5 | 3 | 25.6 |
T w: water temperature; RSD: relative standard deviation; n: number of replicates (each replicate consisted of 100 pooled specimens collected randomly from each temperature group).
The values are expressed as mean±standard deviation. Those marked by an asterisk (*) are significantly different from the control (P<0.05)
3.7.3. Impact of repeated freeze-and-thaw on ChE-IR levels in collected samples
The level of immunoreactive content of ChE in collected specimens that underwent repeated freeze- and-thaw was measured at an antiserum dilution of 1:22 000. Results are listed in Table 7. There were no differences in ChE content between the treatments and the control.
Table 7.
Impact of repeated freeze-and-thaw on ChE-IR level in collected samples of Daphnia magna
| Freeze-and-thaw cycles | ChE-IRa(μg/mg protein) | RSD (%) | n |
| 0 | 0.0160±0.0010 | 6.3 | 3 |
| 6 | 0.0156±0.0007 | 4.5 | 3 |
| 12 | 0.0153±0.0009 | 5.6 | 3 |
RSD: relative standard deviation; n: number of replicates (each replicate consisted of 100 pooled specimens collected randomly from each temperature group).
The values are expressed as mean±standard deviation. There were no differences between the treatments and the control (P>0.05)
4. Discussion
4.1. Structure and activity of recombinant protein ChE
The key to obtaining recombinant ChE is to design proper primers for PCR amplification. Since Daphnia magna is a species that belongs to the Phylum Arthropoda, the primers should be designed, from a phylogenetic systematic point of view, based on the species that belong to the Family Daphniidae, Order Cladocera, or Class Crustacea. Because no gene sequences of ChE that belong to these groups of species are reported in GenBank, the sequences that belong to insects, such as Prodenia litura Fabricius, Cocytodes coerulea Guenee, Phopalosiphum padi Linnaeus, and Aphis gossypii Glover, were taken into consideration. Five pairs of degenerate primers were designed: F1: GAR(A, g)CCN(A, T, g, C)CCN(A, T, g, C)GCN(A, T, g, C)ATY(C, T)ATG, R1: GCN(A, T, g, C)ACGCAN(A, T, g, C)GGR(A, g)AAY(C, T)TC; F2: CCCY(C, T)GGN(A, T, g, C)GCS(g, C)ATGATG TG, R2: GY(C, T)AAGTTR(A, g)GCCCAATATCT; F3: TGGATH(A, T, C)TAY(C, T)GW(A, T)GN(A, T, g, C)GGN(A, T, g, C)GG, R3: CCN(A, T, g, C)GCN (A, T, g, C)S(g, C)W(A, T)Y(C, T)TCN(A, T, g, C) CCR(A, g)AA; F4: GGN(A, T, g, C)ATY(C, T)CCN (A, T, g, C)AAN(A, T, g, C)AAY(C, T)GT, R4: AA CCAR(A, g)ACN(A, T, g, C)GTR(A, g)TAY(C, T)TC; F5: GGATY(C, T)W(A, T)CIGGIGAR(A, g)GAY(C, T)ATTTCGAAY(C, T)CCN(A, T, g, C)AA, R5: TCI AY(C, T)Y(C, T)TCR(A, g)TCICCY(C, T)TGIAII ACICCCATCCA.
Results of PCR amplification based on the second pair of primers (i.e. F2 and R2) yielded a 717-bp ORF that encoded a putative protein consisting of 239 amino acid residues. The PCR fragments were connected to pET-29a and the pET-29a(+)-ChE obtained was expressed within E. coli BL21 (DE3). A recombinant protein ChE with a molecular weight of about 26 kDa was finally obtained. Phylogenetic analysis suggested that the overall homology between the recombinant ChE and the ChE from Spodoptera litura and Anopheles stephensi was 65.4% and 47.3%, respectively (Hall and Malcolm, 1991; Chen et al., 2010).
The activity of the recombinant enzyme was tested using acetylthiocholine iodide and propionylthiocholine iodide as substrates. The enzyme seemed able to hydrolyze propionylthiocholine, but was virtually inactive for acetylthiocholine (Tables 1 and 2). According to Diamantino et al. (2003), crude ChE from Daphnia magna showed a maximal activity of 19.92 U/mg protein for propionylthiocholine and a maximal activity of 8.15 U/mg protein for acetylthiocholine. The behavior of the crude enzyme verified the existence of ChE with propionylthiocholine-affinity similar to that of the ChE developed in this study and suggested coexistence with a ChE that had higher affinity towards acetylthiocholine.
ChE with propionylthiocholine-affinity was not found in species such as Chasmagnathus granulate, Palaemonetes pugio, and Gammarus pulex, the species that belong to the same Order as Daphnia. Crude enzymes from these species were more active for acetylthiocholine than for propionylthiocholine (Monserrat and Bianchini, 1998; Key and Fulton, 2002; Xuereb et al., 2009). This suggests that the preference of the enzyme for propionylthiocholine might be a feature of the species from the Class Crustacea but not of those from the Order Cladocera. The significance of this feature in determining the immunoreactive character of ChEs needs to be explored further.
According to Yang et al. (2013), the molecular weight of a subunit of native ChE was 84 kDa, a value that is over three times that of the recombinant ChE (i.e. 26 kDa). This suggests the failure to amplify the complete sequence of the ChE gene from Daphnia magna.
4.2. Specificity of the antiserum
Crude enzymes from a number of species were tested for their affinity for the antiserum. The anti recombinant ChE antiserum showed the highest rate of cross-reaction (i.e. 33.33%) with the enzyme from Alona milleri, a species that belongs to the Order Cladocera, and the second highest rate of cross-reaction (i.e. 18.67%) with the enzyme from Macrobrachium nipponense, a species that belongs to the Order Decapoda. Both of these species belong to the Crustacea, the Class to which Daphnia magna belongs. The rates of cross-reaction of the antiserum with the enzyme from insects (Bombyx mori, Chironomus kiiensis, and Apis mellifera), Annelida (Eisenia foetida), fish (Brachydanio rerio), and Amphibia (Xenopus laevis) were negligible (all below 6%).
For practical purposes, the protein concentration of the crude enzymes was set to 4.7 mg protein/ml for all of the species tested in this study, but differences in terms of ChE activity were detected among the species. The ChE activity was as low as 0.2 U/mg protein in Chironomus kiiensis and as high as 87.6 U/mg protein in Brachydanio rerio (brains). It is known that the titer of the antiserum relates to the concentration of ChE but not the concentration of total protein. Thus, the cross-reaction was underestimated for the ChE from Chironomus kiiensis and overestimated for the enzyme from Brachydanio rerio.
According to Liu et al. (2012b), the antiserum developed from native ChE had rates of cross-reaction of 10.19%, 2.81%, 2.13%, 3.93%, 5.00%, 3.88%, 3.56%, and 2.75% with the crude ChE from Alona milleri, Bombyx mori, Chironomus kiiensis, Apis mellifera, Eisenia foetida, Brachydanio rerio (brains), Brachydanio rerio (whole bodies without brain), and Xenopus laevis (tadpoles), respectively. The antiserum developed in this study behaved the same, except that it showed a higher rate of cross-reaction (33.33%) with the crude ChE from Alona milleri.
4.3. Sensitivity of ELISA
Based on the standard equation established by anti recombinant ChE antiserum at a dilution of 1:22 000, the detection limit of the method was calculated to be 14.5 ng/ml. This value is comparable to the value of 24 ng/ml that was derived from a similar protocol in which anti native ChE antiserum was used at a dilution of 1:8000 (Liu et al., 2012b).
A protocol of competitive ELISA indicated a detection limit of 0.15 ng/ml when a type of polyclonal antibody was used for detection of butyrylcholinesterase content in avian blood (Khattab and Ali, 2007). Another protocol of competitive ELISA indicated a detection limit of 5 ng/ml when a type of monoclonal antibody was used for detection of ChE content in human serum (Kondo et al., 1995). These examples suggest the possibility of reducing the value of the detection limit by optimizing the protocols for ELISA.
4.4. Applicability of antiserum
Data summarized in Fig. 7 indicate elevation of ChE-IR in Daphnia magna exposed to sublethal concentrations of triazophos. Similar elevation was reported in the study by Liu et al. (2012a). According to Kaufer et al. (1999), animals accelerate synthesis of ChE when they are exposed to anticholinesterases so as to rectify the disabling of the enzyme. This process may compromise the determination of the actual inhibition of ChE. As indicated by Khattab et al. (1994) and Li et al. (2005), the problem could be solved by predetermination of ChE-IR levels using antibodies. The results of the present study suggest that the polyclonal antibodies developed against the recombinant protein ChE are as efficient as those developed against the native ChE in detecting ChE content in Daphnia magna exposed to anticholinesterase.
Daphnia magna were acclimatized to ambient temperatures of 10, 16, and 21 °C in this study. ChE-IR was found to be induced at lower temperatures. The lower the temperature, the higher was the level of ChE-IR detected (Table 6). It has long been noticed that in vivo activity of ChE alters with ambient temperature. There are some species in which the activity increases with temperature (Hogan, 1970), others in which it decreases (Baslow and Nigrelli, 1964; Rattner, 1982; Scaps and Borot, 2000; Botté et al., 2013), and some in which the activity remains steady as the temperature changes (Scaps and Borot, 2000; Phillips et al., 2002). Results of the present study suggest that changes in the activity of the enzyme can be explained by changes in ChE-IR. Since ChE-IR affects an animal’s susceptibility to anticholinesterases, it is reasonable to infer that species in which ChE activity declines with increasing temperature, e.g. the reef fish Acanthochromis polyacanthus (Botté et al., 2013) and the polychaete Nereis diversicolorv (Scaps and Borot, 2000), are more sensitive to anticholinesterases at higher temperatures, whereas those in which ChE activity increases with temperature, e.g. the walleye Stizostedion vitreum (Phillips et al., 2002), are more sensitive to anticholinesterases at lower temperatures.
According to the study conducted by Yang (2010), the ChE from Daphnia magna showed an 80% decline in activity at 25 °C 24 h after it was sampled, but the enzyme showed only an 8.6% decline in terms of ChE-IR, and the rate of decline was only 31% 7 d after sampling. It seems that ChE is more stable as an antigen than as an enzyme. To explore the sensitivity of the antigen towards repeated freezing and thawing, ChE-IR was tested in this study before and after the treatment. Repeated freezing and thawing had no influence on the test results of ChE-IR (Table 7). This suggests that collected specimens can be frozen and thawed repeatedly before they are used for testing of ChE-IR, so there is no need to subpackage them before they go through cold storage.
5. Conclusions
Taking 5'-CCCYGGNGCSATGATGTG-3' as forward primer and 5'-GYAAGTTRGCCCAATAT CT-3' as reverse primer, PCR products of about 250, 700, and 1200 bp were obtained in this study, based on the cDNA of Daphnia magna. The DNA segments were connected to pMD19-T and then introduced into E. coli DH5α. The transfected cells were sent for gene sequence analysis and results of the analysis indicated a 717-bp nucleotide ORF that encoded a putative protein consisting of 239 amino acid residues. Sequence alignment at amino acid level indicated that it contained two conserved carboxylesterase domains, i.e. the characteristic site 2 of carboxylesterase B and the serine activity site of carboxylesterase B. The sequence was then inserted into plasmid pET-29a(+) and an efficient procedure was developed for expression of pET-29a(+)-ChE within E. coli BL21 (DE3). Results of SDS-PAGE indicated a major band with a molecular weight of 26 kDa. The recombinant protein ChE was found to be able to hydrolyze propionylthiocholine, but it was virtually inactive towards acetylthiocholine.
For the purpose of producing anti-ChE antibodies, the purified recombinant protein ChE was used as an antigen to immune BALB/c mice. The antiserum obtained was tested for its specificity towards crude enzymes from animals of various species. Taking the titer for Daphnia magna as a reference, the rates of cross-reaction were 33.33%, 18.67%, 5.33%, 3.53%, 3.07%, 0.87%, 2.20%, 2.33%, and 0.67% for Alona milleri, Macrobrachium nipponense, Bombyx mori, Chironomus kiiensis, Apis mellifera, Eisenia foetida, Brachydanio rerio (brains), Brachydanio rerio (whole bodies without brain), and Xenopus laevis (tadpoles), respectively. This revealed that the antiserum had specificity suitable for detecting ChE in Daphnia magna and species that belong to the Class Crustacea.
A type of indirect and non-competitive ELISA was developed for testing ChE-IR in Daphnia magna. Results of the test on “0” samples indicated a detection limit of 14.5 ng/ml. Tests on repeatability indicated an inter-batch RSD of 3.17 and an intra-batch RSD of 3.90.
ELISA was used to test ChE-IR in Daphnia magna exposed to sublethal concentrations of triazophos and those acclimatized to different water temperatures. Maximal induction of 57.2% in terms of ChE-IR was detected on the second day after the animal was exposed to a concentration of 2.10 μg/L triazophos. ChE-IR was found to be induced by 16.9% at 16 °C compared with the value detected at 21 °C, and the rate of induction was found to be 25.6% at 10 °C. ELISA was also employed for testing of stability of ChE-IR in collected samples. It seemed that repeated freeze-and-thaw had no influence on the outcome of the test. All these results suggest that the polyclonal antibodies developed against the recombinant ChE are as efficient as those developed against the native ChE in detecting the ChE content of Daphnia magna.
Footnotes
Project supported by the Zhejiang Provincial Natural Science Foundation (No. LY12B07008), China
Compliance with ethics guidelines: Hong-cui LIU, Bing-qiang YUAN, and Shao-nan LI declare that they have no conflict of interest.
All institutional and national guidelines for the care and use of laboratory animals were followed.
References
- 1.Abdel-Halim KY, Salama AK, El-khateeb EN, et al. Organophosphorus pollutants (OPP) in aquatic environment at Damietta Governorate, Egypt: implications for monitoring and biomarker responses. Chemosphere. 2006;63(9):1491–1498. doi: 10.1016/j.chemosphere.2005.09.019. (Available from: http://dx.doi.org/10.1016/j.chemosphere.2005.09.019) [DOI] [PubMed] [Google Scholar]
- 2.Anthony N, Rocheleau T, Mocelin G, et al. Cloning, sequencing and functional expression of an acetylcholinesterase gene from the yellow fever mosquito Aedes aegypti . FEBS Lett. 1995;368(3):461–465. doi: 10.1016/0014-5793(95)00711-h. (Available from: http://dx.doi.org/10.1016/0014-5793(95)00711-H) [DOI] [PubMed] [Google Scholar]
- 3.Barata C, Baird DJ, Soares AMVM, et al. Biochemical factors contributing to response variation among resistant and sensitive clones of Daphnia magna Straus exposed to ethyl parathion. Ecotoxicol Environ Saf. 2001;49(2):155–163. doi: 10.1006/eesa.2001.2052. (Available from: http://dx.doi.org/10.1006/eesa.2001.2052) [DOI] [PubMed] [Google Scholar]
- 4.Baslow MH, Nigrelli RF. The effects of thermal acclimation on brain cholinesterase of the killifish, Fundulus heteroclitus . Zoologica. 1964;49:41–51. [Google Scholar]
- 5.Botté ES, Smith-Keune C, Jerry DR. Temperature: a prolonged confounding factor on cholinesterase activity in the tropical reef fish Acanthochromis polyacanthus . Aquat Toxicol. 2013;140-141:337–339. doi: 10.1016/j.aquatox.2013.06.021. (Available from: http://dx.doi.org/10.1016/j.aquatox.2013.06.021) [DOI] [PubMed] [Google Scholar]
- 6.Bradford MM. A rapid and sensitive method for quantitation of microgram quantities of protein utilizing principle of protein dye binding. Anal Siochem. 1976;72(1-2):248–254. doi: 10.1016/0003-2697(76)90527-3. [DOI] [PubMed] [Google Scholar]
- 7.Cajaraville MP, Bebianno MJ, Blasco J, et al. The use of biomarkers to assess the impact of pollution in coastal environments of the Iberian Peninsula: a practical approach. Sci Total Environ. 2000;247(2-3):295–311. doi: 10.1016/s0048-9697(99)00499-4. (Available from: http://dx.doi.org/10.1016/S0048-9697(99)00499-4) [DOI] [PubMed] [Google Scholar]
- 8.Carvalho FD, Machado I, Martinez MS, et al. Use of atropine-treated Daphnia magna survival for detection of environmental contamination by acetylcholinesterase inhibitors. Ecotoxicol Environ Saf. 2003;54(1):43–46. doi: 10.1016/s0147-6513(02)00018-0. (Available from: http://dx.doi.org/10.1016/S0147-6513(02)00018-0) [DOI] [PubMed] [Google Scholar]
- 9.Chen L, Li B, Pu GQ. Cloning and sequence analysis of cDNA fragment of acetylcholinesterase gene in Spodoptera litura . Sci Sericult. 2010;36(1):0138–0142. [Google Scholar]
- 10.Coelho S, Oliveira R, Pereira S, et al. Assessing lethal and sub-lethal effects of trichlorfon on different trophic levels. Aquat Toxicol. 2011;103(3-4):191–198. doi: 10.1016/j.aquatox.2011.03.003. (Available from: http://dx.doi.org/10.1016/j.aquatox.2011.03.003) [DOI] [PubMed] [Google Scholar]
- 11.Damásio J, Guilhermino L, Soares AMVM, et al. Biochemical mechanisms of resistance in Daphnia magna exposed to the insecticide fenitrothion. Chemosphere. 2007;70(1):74–82. doi: 10.1016/j.chemosphere.2007.07.026. (Available from: http://dx.doi.org/10.1016/j.chemosphere.2007.07.026) [DOI] [PubMed] [Google Scholar]
- 12.den Besten PJ, Valk S, van Weerlee E, et al. Bioaccumulation and biomarkers in the sea star Asterias rubens (Echinodermata: Asteroidea): a North Sea field study. Mar Environ Res. 2001;51(4):365–387. doi: 10.1016/s0141-1136(00)00134-3. (Available from: http://dx.doi.org/10.1016/S0141-1136(00)00134-3) [DOI] [PubMed] [Google Scholar]
- 13.Denoyelle R, Rault M, Mazzia C, et al. Cholinesterase activity as a biomarker of pesticide exposure in Allolobophora chlorotica earthworms living in apple orchards under different management strategies. Environ Toxicol Chem. 2007;26(12):2644–2649. doi: 10.1897/06-355.1. (Available from: http://dx.doi.org/10.1897/06-355.1) [DOI] [PubMed] [Google Scholar]
- 14.Diamantino TC, Almeida E, Soares AMVM, et al. Characterization of cholinesterases from Daphnia magna Straus and their inhibition by zinc. Bull Environ Contam Toxicol. 2003;71(2):219–225. doi: 10.1007/s00128-003-0153-7. (Available from: http://dx.doi.org/10.1007/s00128-003-0153-7) [DOI] [PubMed] [Google Scholar]
- 15.Duquesne S. Effects of an organophosphate on Daphnia magna, at subspeciesal and speciesal levels: implications for population dynamics. Ecotoxicol Environ Saf. 2006;65(2):145–150. doi: 10.1016/j.ecoenv.2006.01.008. (Available from: http://dx.doi.org/10.1016/j.ecoenv.2006.01.008) [DOI] [PubMed] [Google Scholar]
- 16.Duquesne S, Küster E. Biochemical, metabolic, and behavioural responses and recovery of Daphnia magna after exposure to an organophosphate. Ecotoxicol Environ Saf. 2010;73(3):353–359. doi: 10.1016/j.ecoenv.2009.11.008. (Available from: http://dx.doi.org/10.1016/j.ecoenv.2009.11.008) [DOI] [PubMed] [Google Scholar]
- 17.Elendt BP, Bias WR. Trace nutrient deficiency in Daphnia magna cultured in standard medium for toxicity testing: effects of the optimization of culture conditions on life history parameters of Daphnia magna . Water Res. 1990;24(9):1157–1167. (Available from: http://dx.doi.org/10.1016/0043-1354(90)90180-E) [Google Scholar]
- 18.Gälli R, Rich HW, Scholtz R. Toxicity of organophosphate insecticides and their metabolites to the water flea Daphnia magna, the Microtox test and an acetylcholinesterase inhibition test. Aquat Toxicol. 1994;30(3):259–269. (Available from: http://dx.doi.org/10.1016/0166-445X(94)90063-9) [Google Scholar]
- 19.Garabrant DH, Aylward LL, Berent S, et al. Cholinesterase inhibition in chlorpyrifos workers: characterization of biomarkers of exposure and response in relation to urinary TCPy. J Expo Sci Environ Epidemiol. 2009;19(7):634–642. doi: 10.1038/jes.2008.51. (Available from: http://dx.doi.org/10.1038/jes.2008.51) [DOI] [PubMed] [Google Scholar]
- 20.Guilhermino L, Lopes MC, Carvalho AP, et al. Inhibition of acetylcholinesterase activity as effect criterion in acute tests with juvenile Daphnia magna . Chemosphere. 1996;32(4):727–738. doi: 10.1016/0045-6535(95)00360-6. (Available from: http://dx.doi.org/10.1016/0045-6535(95)00360-6) [DOI] [PubMed] [Google Scholar]
- 21.Hackenberger BK, Jarić-Perkušić D, Stepić S. Effect of temephos on cholinesterase activity in the earthworm Eisenia fetida (Oligochaeta, Lumbricidae) Ecotoxicol Environ Saf. 2008;71(2):583–589. doi: 10.1016/j.ecoenv.2007.11.008. (Available from: http://dx.doi.org/10.1016/j.ecoenv.2007.11.008) [DOI] [PubMed] [Google Scholar]
- 22.Hall LMC, Malcolm CA. The acetylcholinesterase gene of Anopheles stephensi . Cell Mol Neurobiol. 1991;11(1):131–141. doi: 10.1007/BF00712805. (Available from: http://dx.doi.org/10.1007/BF00712805) [DOI] [PMC free article] [PubMed] [Google Scholar]
- 23.Hill EF. Sex and storage affect cholinesterase activity in blood plasma of Japanese quail . J Wildl Dis. 1989;25(4):580–585. doi: 10.7589/0090-3558-25.4.580. (Available from: http://dx.doi.org/10.7589/0090-3558-25.4.580) [DOI] [PubMed] [Google Scholar]
- 24.Hogan JW. Water temperature as a source of variation in specific activity of brain acetylcholinesterase of bluegills. Bull Environ Contam Toxicol. 1970;5(4):347–353. (Available from: http://dx.doi.org/10.1007/BF01539949) [Google Scholar]
- 25.Jemec A, Drobne D, Tisler T, et al. The applicability of acetylcholinesterase and glutathione S-transferase in Daphnia magna toxicity test. Comp Biochem Physiol C: Toxicol Pharmacol. 2007;144(4):303–309. doi: 10.1016/j.cbpc.2006.10.002. [DOI] [PubMed] [Google Scholar]
- 26.Jiang HB, Liu SW, Zhao PC, et al. Recombinant expression and biochemical characterization of the catalytic domain of acetylcholinesterase-1 from the African malaria mosquito, Anopheles gambiae . Insect Biochem Mol Biol. 2009;39(9):646–653. doi: 10.1016/j.ibmb.2009.07.002. (Available from: http://dx.doi.org/10.1016/j.ibmb.2009.07.002) [DOI] [PMC free article] [PubMed] [Google Scholar]
- 27.Kaufer D, Friedman A, Seidman S, et al. Anticholinesterases induce multigenic transcriptional feedback response suppressing cholinergic neurotransmission. Chem Biol Interact. 1999;119-120:349–360. doi: 10.1016/s0009-2797(99)00046-0. (Available from: http://dx.doi.org/10.1016/S0009-2797(99)00046-0) [DOI] [PubMed] [Google Scholar]
- 28.Key PB, Fulton MH. Characterization of cholinesterase activity in tissues of the grass shrimp (Palaemonetes pugio) Pestic Biochem Physiol. 2002;72(3):186–192. (Available from: http://dx.doi.org/10.1016/S0048-3575(02)00006-8) [Google Scholar]
- 29.Khattab AD, Ali LS. Immunoassays for avian butyrylcholinesterase: implications for ecotoxicological testing and clinical biomonitoring. Environ Toxicol Pharmacol. 2007;24(3):275–285. doi: 10.1016/j.etap.2007.06.006. (Available from: http://dx.doi.org/10.1016/j.etap.2007.06.006) [DOI] [PubMed] [Google Scholar]
- 30.Khattab AD, Walker CH, Johnston G, et al. An ELISA assay for avian serum butyrylcholinesterase: a biomarker for organophosphates. Environ Toxicol Chem. 1994;13(10):1661–1667. (Available from: http://dx.doi.org/10.1002/etc.5620131016) [Google Scholar]
- 31.Kondo M, Hada T, Fukui K, et al. Enzyme-linked immunosorbent assay (ELISA) for Aleuria aurantia lectin-reactive serum cholinesterase to differentiate liver cirrhosis and chronic hepatitis. Clin Chim Acta. 1995;243(1):1–9. doi: 10.1016/0009-8981(95)06146-0. (Available from: http://dx.doi.org/10.1016/0009-8981(95)06146-0) [DOI] [PubMed] [Google Scholar]
- 32.Li CX, Dong YD, Liu MD, et al. Alternative splicing of ace1 gene in Culex pipiens pallens and its effect to enzyme activity. Acta Parasitol Med Entomol Sin. 2007;14(3):153–157. (in Chinese) [Google Scholar]
- 33.Li F, Han ZJ. Cloning and sequencing of two acetylcholinesterase cDNA fragments from cotton aphid, Aphis gossypii Glover. Zool Res. 2002;23(5):444–448. (in Chinese) [Google Scholar]
- 34.Li SN, Tan YJ. Hormetic response of cholinesterase from Daphnia magna in chronic exposure to triazophos and chlorpyrifos. J Environ Sci. 2011;23(5):852–859. doi: 10.1016/s1001-0742(10)60516-5. (Available from: http://dx.doi.org/10.1016/S1001-0742(10)60516-5) [DOI] [PubMed] [Google Scholar]
- 35.Li SN, Xie XC, Tan YJ, et al. Induction of triazophos to brain acetylcholinesterase from topmouth gudgeon, Pseudorasbora parva . Chin J Pest Sci. 2005;7(1):59–62. (in Chinese) [Google Scholar]
- 36.Lin T, Li LN, Chang RL, et al. Cloning and sequence analysis of acetylcholinease gene of Pseudophacopteron canarium . J Jilin Agric Univ. 2007;29(4):368–370. (in Chinese) [Google Scholar]
- 37.Liu HC, Yuan BQ, Li SN. Altered quantities and in vivo activities of cholinesterase from Daphnia magna in sub-lethal exposure to organophosphorus insecticides. Ecotoxicol Environ Saf. 2012;80:118–125. doi: 10.1016/j.ecoenv.2012.02.014. (Available from: http://dx.doi.org/10.1016/j.ecoenv.2012.02.014) [DOI] [PubMed] [Google Scholar]
- 38.Liu HC, Yang YX, Li SN. Quantitative analysis of cholinesterase from Daphnia magna by indirect and non-competitive enzyme-linked immunosorbent assay. J Zhejiang Univ (Agric Life Sci) 2012;38(3):347–354. (in Chinese) [Google Scholar]
- 39.Monserrat JM, Bianchini A. Some kinetic and toxicological characteristics of thoracic ganglia cholinesterase of Chasmagnathus granulate (Decapoda, Grapsidae) Comp Biochem Physiol C: Toxicol Pharmacol. 1998;120(2):193–199. doi: 10.1016/s0742-8413(98)00040-1. [DOI] [PubMed] [Google Scholar]
- 40.Ni XY, Tomita T, Kasai S, et al. cDNA and deduced protein sequence of acetylcholinesterase from the diamondback moth, Plutella xylostella (L.) (Lepidoptera: Plutellidae) Appl Entomol Zool. 2003;38(1):49–56. (Available from: http://dx.doi.org/10.1303/aez.2003.49) [Google Scholar]
- 41.Phillips TA, Summerfelt RC, Atchison GJ. Environmental, biological, and methodological factors affecting cholinesterase activity in walleye (Stizostedion vitreum) Arch Environ Contam Toxicol. 2002;43(1):75–80. doi: 10.1007/s00244-002-1134-2. (Available from: http://dx.doi.org/10.1007/s00244-002-1134-2) [DOI] [PubMed] [Google Scholar]
- 42.Printes LB, Fellowes MDE, Callaghan A. Clonal variation in acetylcholinesterase biomarkers and life history traits following OP exposure in Daphnia magna . Ecotoxicol Environ Saf. 2008;71(2):519–526. doi: 10.1016/j.ecoenv.2007.12.001. (Available from: http://dx.doi.org/10.1016/j.ecoenv.2007.12.001) [DOI] [PubMed] [Google Scholar]
- 43.Printes LB, Fernandes MN, Espíndola ELG. Laboratory measurements of biomarkers and individual performances in Chironomus xanthus to evaluate pesticide contamination of sediments in a river of southeastern Brazil. Ecotoxicol Environ Saf. 2011;74(3):424–430. doi: 10.1016/j.ecoenv.2010.10.033. (Available from: http://dx.doi.org/10.1016/j.ecoenv.2010.10.033) [DOI] [PubMed] [Google Scholar]
- 44.Rattner BA. Diagnosis of anticholinesterase poinsoning in birds: effects of environmental temperature and underfeeding on cholinesterase activity. Environ Toxicol Chem. 1982;1(4):329–335. (Available from: http://dx.doi.org/10.1002/etc.5620010408) [Google Scholar]
- 45.Sáenz LA, Seibert EL, Zanette J, et al. Biochemical biomarkers and metals in Perna perna mussels from mariculture zones of Santa Catarina, Brazil. Ecotoxicol Environ Saf. 2010;73(5):796–804. doi: 10.1016/j.ecoenv.2010.02.015. (Available from: http://dx.doi.org/10.1016/j.ecoenv.2010.02.015) [DOI] [PubMed] [Google Scholar]
- 46.Sanchez-Hernandez JC, Fossi MC, Leonzio C, et al. Use of biochemical biomarkers as a screening tool to focus the chemical monitoring of organic pollutants in the Biobio river basin (Chile) Chemosphere. 1998;37(4):699–710. (Available from: http://dx.doi.org/10.1016/S0045-6535(98)00085-X) [Google Scholar]
- 47.Scaps P, Borot O. Acetylcholinesterase activity of the polychaete Nereis diversicolor: effects of temperature and salinity. Comp Biochem Physiol C: Pharmacol Toxicol Endocrinol. 2000;125(3):377–383. doi: 10.1016/s0742-8413(00)00087-6. (Available from: http://dx.doi.org/10.1016/S0742-8413(00)00087-6) [DOI] [PubMed] [Google Scholar]
- 48.Stien X, Percic P, Gnassia-Barelli M, et al. Evaluation of biomarkers in caged fishes and mussels to assess the quality of waters in a bay of the NW Mediterranean Sea. Environ Pollut. 1998;99(3):339–345. doi: 10.1016/s0269-7491(98)00013-x. (Available from: http://dx.doi.org/10.1016/S0269-7491(98)00013-X) [DOI] [PubMed] [Google Scholar]
- 49.Sturm A, Hansen PD. Altered cholinesterase and monooxygenase levels in Daphnia magna and Chironomus riparius exposed to environmental pollutants. Ecotoxicol Environ Saf. 1999;42(1):9–15. doi: 10.1006/eesa.1998.1721. (Available from: http://dx.doi.org/10.1006/eesa.1998.1721) [DOI] [PubMed] [Google Scholar]
- 50.Sturm A, Wogram J, Hansen PD, et al. Potential use of cholinesterase in monitoring low levels of organophosphates in small streams: natural variability in three-spined stickleback (Gasterosteus aculeatus) and relation to pollution. Environ Toxicol Chem. 1999;18(2):194–200. (Available from: http://dx.doi.org/10.1002/etc.5620180214) [Google Scholar]
- 51.van Oosterom J, King SC, Negri A, et al. Investigation of the mud crab (Scylla serrata) as a potential bio-monitoring species for tropical coastal marine environments of Australia. Mar Pollut Bull. 2010;60(2):283–290. doi: 10.1016/j.marpolbul.2009.09.007. (Available from: http://dx.doi.org/10.1016/j.marpolbul.2009.09.007) [DOI] [PubMed] [Google Scholar]
- 52.Vesela S, Kuca K, Jun D. Toxicity of the nerve agent tabun to Daphnia magna, a new experimental species in military toxicology. Chem Ecol. 2006;22(2):175–180. (Available from: http://dx.doi.org/10.1080/02757540600579383) [Google Scholar]
- 53.Villatte F, Bachmann TT. How many genes encode cholinesterase in arthropods. Pestic Biochem Physiol. 2002;73(2):122–129. [Google Scholar]
- 54.Xuereb B, Noury P, Felten V, et al. Cholinesterase activity in Gammarus pulex (Crustacea Amphipoda): characterization and effects of chlorpyrifos. Toxicology. 2007;236(3):178–189. doi: 10.1016/j.tox.2007.04.010. (Available from: http://dx.doi.org/10.1016/j.tox.2007.04.010) [DOI] [PubMed] [Google Scholar]
- 55.Xuereb B, Chaumot A, Mons R, et al. Acetylcholinesterase activity in Gammarus fossarum (Crustacea Amphipoda): intrinsic variability, reference levels, and a reliable tool for field surveys. Aquat Toxicol. 2009;93(4):225–233. doi: 10.1016/j.aquatox.2009.05.006. (Available from: http://dx.doi.org/10.1016/j.aquatox.2009.05.006) [DOI] [PubMed] [Google Scholar]
- 56.Yang LG, Hu SC, Wei PH, et al. Enzyme Immunoassay. Nanjing: Nanjing University Press; 1998. pp. 279–281. (in Chinese) [Google Scholar]
- 57.Yang YX. Immunoassays for Daphnia magna cholinesterases: a biomarker for organophosphates. Hangzhou: Zhejiang University; 2010. pp. 1–95. in Chinese. MS Thesis) [Google Scholar]
- 58.Yang YX, Niu LZ, Li SN. Purification and studies on characteristics of cholinesterases from Daphnia magna . J Zhejiang Univ-Sci B (Biomed & Biotechnol) 2013;14(4):325–335. doi: 10.1631/jzus.B1200113. (Available from: http://dx.doi.org/10.1631/jzus.B1200113) [DOI] [PMC free article] [PubMed] [Google Scholar]
- 59.Zhang T. Expression of Drosophila melanogaster acetylcholinesterase (AchE) gene in Pichia pastoris. Chongqing: Chongqing University; 2008. pp. 1–52. in Chinese. MS Thesis. [Google Scholar]
- 60.Zhou MJ, Zhang CL, Richard P, et al. Choline oxidase: a useful tool for high-throughput assays of acetylcholinesterase, phospholipase D, phosphatidylcholine-specific phospholipase C, and sphingomyelinase. Proc SPIE. 2000;3926:166–171. (Available from: http://dx.doi.org/10.1117/12.380507) [Google Scholar]