Abstract.
Pericardial fat volume (PFV) is emerging as an important parameter for cardiovascular risk stratification. We propose a hybrid approach for automated PFV quantification from water/fat-resolved whole-heart noncontrast coronary magnetic resonance angiography (MRA). Ten coronary MRA datasets were acquired. Image reconstruction and phase-based water-fat separation were conducted offline. Our proposed algorithm first roughly segments the heart region on the original image using a simplified atlas-based segmentation with four cases in the atlas. To get exact boundaries of pericardial fat, a three-dimensional graph-based segmentation is used to generate fat and nonfat components on the fat-only image. The algorithm then selects the components that represent pericardial fat. We validated the quantification results on the remaining six subjects and compared them with manual quantifications by an expert reader. The PFV quantified by our algorithm was , compared to by the expert reader, which were not significantly different () and showed excellent correlation (,). The mean absolute difference in PFV between the algorithm and the expert reader was . The mean value of the paired differences was (95% confidence interval: to 6.21). The mean Dice coefficient of pericardial fat voxels was . Our approach may potentially be applied in a clinical setting, allowing for accurate magnetic resonance imaging (MRI)-based PFV quantification without tedious manual tracing.
Keywords: pericardial fat, coronary magnetic resonance angiography, segmentation, atlas, graph model
1. Introduction
Recent studies have shown that pericardial fat is strongly associated with coronary artery disease (CAD), coronary calcium scores, severity of detected CAD, biochemical markers of systemic inflammation, risk of future adverse cardiovascular events, and myocardial ischemia.1–5 Pericardial fat includes both epicardial and paracardial adipose tissues. Our study is focused on the quantitative analysis of pericardial (sum of epicardial and paracardial) fat, which can be consistently measured by our magnetic resonance imaging (MRI) sequence with a voxel size of .
Most previous studies on pericardial and epicardial fat quantification relied on computed tomography (CT) for three-dimensional (3-D) imaging of the heart.1–9 Compared with CT, MRI is an attractive alternative, as it imposes no ionizing radiation on patients and can generate fat-water separated images from a single acquisition.10–12 To date, pericardial fat quantification in MRI was reported on manually outlined regions of interest (ROI),13,14 which is time-consuming and subject to interobserver variability. While distance measurements can also be performed, pericardial fat volume (PFV) is a whole-heart measure of fat surrounding the heart, and may therefore be more accurate for assessment of risk for an individual patient. In particular, for epicardial fat, volumetric measurements have been shown to identify significant coronary artery disease more accurately than distance measurements and also to be more reproducible.15
Thus, it is highly desirable to develop an automated algorithm for pericardial fat quantification that provides fast and consistent results with minimal human intervention.
In this paper, we propose an algorithm for automated pericardial fat quantification from water/fat-resolved whole-heart coronary magnetic resonance angiography (MRA). The algorithm combines the advantages of multiatlas-based segmentation6,16 and graph-based segmentation17 to achieve voxel-level segmentation accuracy. Our algorithm selects components generated by a 3-D graph-based segmentation with certain intensity features and overlap rate with the heart region masks.
2. Materials and Methods
2.1. Magnetic Resonance Acquisition
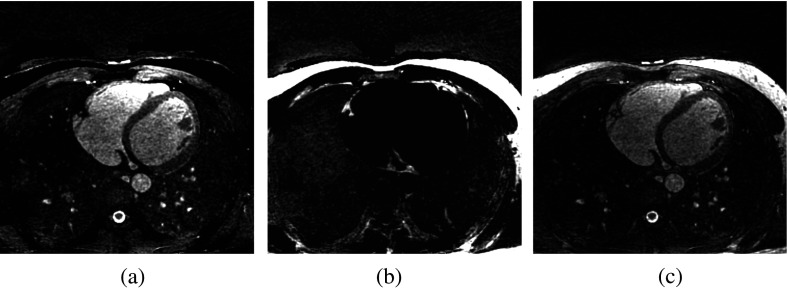
MR data were collected on a clinical 1.5 T scanner (MAGNETOM Avanto, Siemens AG Healthcare, Erlangen, Germany) using a free-breathing, electrocardiograph-gated, balanced steady-state free-precession (bSSFP) pulse sequence with 3-D radial k-space trajectory. To suppress respiratory motion, an additional superior-inferior projection is acquired in each heartbeat to track the translational motion of the heart due to respiration. During reconstruction, the raw data are segmented into several respiratory bins, from which a low-resolution respiratory phase-resolved image series is reconstructed to facilitate image-based affine motion correction.18 After motion correction, the complex imaging volume is reconstructed using a self-calibrating, non-Cartesian sensitivity encoding method.19 The pulse sequence parameters were as follows: repetition/echo time ; field of view ; matrix size ; voxel size ; flip angle 90 deg; readout bandwidth ; total number of lines 10,000, corresponding to an imaging time of , depending on the subject’s heart rate. No magnetization preparation pulses, such as fat-saturation and T2-preparation, were played out. Image reconstruction was completed offline using a standalone workstation. A major advantage of our approach is that it permits noninvasive assessment of pericardial fat as well as coronary artery stenosis from the same image data. Water-only and fat-only images were calculated based on the pixel-by-pixel complex phase of the raw image , exploiting the chemical shift between water and fat and the frequency response profile of bSSFP sequences.11 A sample dataset is shown in Fig. 1.
Fig. 1.
Example transverse slices of MRA data: (a) water-only image , (b) fat-only image , and (c) water-fat fused image .
With IRB approval and written consent obtained before the study, we scanned 10 healthy subjects, of which four were used to create the atlas [body mass index (BMI) 17, 22, 28, 35] and the remaining six for testing (BMI 18, 20, 20, 24, 25, 35, mean BMI 23.7). To compare the automatic quantification results with expert manual delineation, an expert radiologist manually segmented the pericardial fat for all the subjects. The time required to perform these manual tracings was to 30 min per case. The absolute and percent difference, correlation, and Dice coefficient between the two segmentation results were calculated.
2.2. Image Segmentation
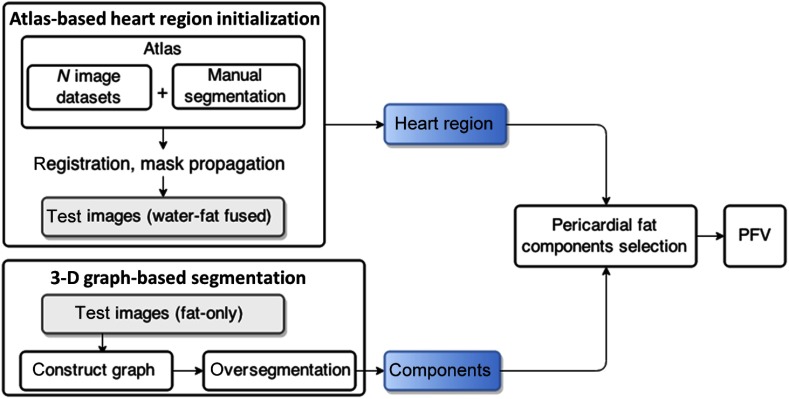
On the basis of multiatlas-based segmentation and efficient graph-based segmentation, we propose a quantification technique divided into two steps. First, heart region initialization is performed using a simplified multiatlas segmentation with local decision fusion16 on water-fat fused images [Fig. 2(a)]. The heart region includes the heart as well as the pericardial fat. Voxels are segmented into components on fat-only images using an efficient graph-based segmentation method17 [Figs. 2(b) and 2(c)], which we generalized from two-dimensional (2-D) space to 3-D space in this work. To increase the chances that boundaries of importance have been extracted, our method does so at the cost of creating many insignificant boundaries. The fat components with certain intensity features and overlap rate with the heart region masks are selected as pericardial fat [Fig. 2(d)]. A flowchart of our algorithm is presented in Fig. 3.
Fig. 2.
Main steps of our algorithm: (a) multiatlas-based segmentation of the heart region, (b) perform 3-D graph-based segmentation on fat-only image, (c) fat components and nonfat components, and (d) pericardial fat component selection (white components).
Fig. 3.
Flowchart of the algorithm. First, heart region initialization is performed on water-fat fused images. Voxels are segmented into components on fat-only images. The fat components with certain intensity features and overlap rate with the heart region masks are selected as pericardial fat.
2.2.1. Simplified multiatlas-based heart region segmentation
The multiatlas segmentation determines the initial location and shape of the heart. The atlas was created from multiple subject scans (water-fat fused images) with a wide BMI range (; two men and two women). For atlas creation, on all transverse slices, 2-D pericardial contours were manually traced by an expert reader (radiologist) within the superior and inferior limits of the heart. A 3-D binary volume mask was generated from the 2-D contours. The binary volume mask for the ’th subject in the atlas is defined as the label of this subject, which is denoted as . Target image segmentation was achieved by one-to-all image registration between the target image and atlas images.
The rigid and nonrigid registration problem is formulated as an optimization problem with respect to combined affine and B-spline transformations minimizing the difference between the target images and the reference image.
| (1) |
where is the transformation aligning the water-fat fused atlas to the target water-fat fused image , where denotes a voxel and is the negative mutual information.20
To obtain the rough binary segmentation of the heart region [Fig. 2(a)], the labels are propagated to the test image according to spatially varying decision fusion weights16 that define the contribution of each atlas by measuring the similarity between the transformed moving atlas after registration and the target image. The similarity is measured by the absolute difference between the transformed moving atlas and the target image.
| (2) |
To determine how much a propagated label in each atlas image should contribute to the segmentation, weights were calculated as follows:
| (3) |
where is a Gaussian kernel of scale sigma that smooths the local estimate of the registration, and is a small value to avoid division by zero. The resulting propagation label is determined by a weighted average of the transformed binary segmentation .
| (4) |
where is the total number of subjects in the atlas.
The results of multiatlas segmentation provide global localization of the heart region with limited accuracy at the boundaries of the pericardial fat due to the global registration scheme and the small atlas. The next graph-based segmentation step can generate the exact boundaries of the pericardial fat.
2.2.2. Three-dimensional graph-based fat component segmentation and selection
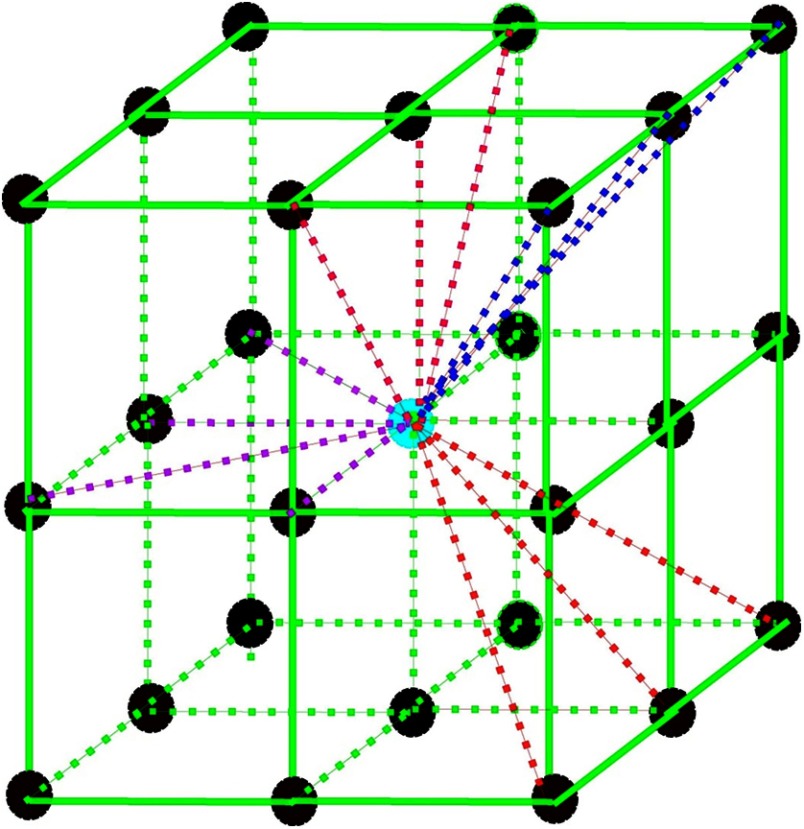
We construct a fully connected undirected 3-D graph on the 3-D fat-only image with vertices located on each voxel and edges corresponding to pairs of neighboring vertices. For each vertex, 13 out of the 26 edges were constructed to connect with neighbor vertices, as illustrated in Fig. 4, to avoid overlapped edges. Each edge has a corresponding weight , which is a non-negative measure of the dissimilarity between neighboring elements and . A segmentation is a partition of into components such that each component in corresponds to a connected component in a graph . The algorithm starts with initial segmentation , where each vertex is in its own component.
Fig. 4.
3-D graph edge construction. For every vertex, 13 out of the 26 edges were constructed to connect with neighboring vertices. Center vertex: current vertex; surrounding vertices: 26 neighboring vertices; dashed lines that connect with the center vertex: edges were constructed for the current vertex.
In this formulation, we want the voxels in a component to be similar and voxels in different components to be dissimilar, i.e., to have either fat voxels or nonfat voxels in one component. We define a predicate based on the work of Felzenszwalb and Huttenlocher17 for evaluating whether or not there is evidence for the boundary between two components in the segmentation. The predicate compares the intercomponent differences to the within-component differences and is thereby adaptive with respect to the local characteristics of the data, hence dealing with intensity variation and noise in the MRA image.
The internal difference of a component is defined as
| (5) |
the largest weight in the minimum spanning tree of the component. The difference between two components , is defined as the minimum weight edge connecting the two components.
| (6) |
If there is no edge connecting and , we let . The pairwise comparison predicate is
| (7) |
where the minimum internal difference MInt is defined as
| (8) |
where denotes the size of and is a constant parameter that sets a scale of observation. A larger causes a preference for larger components, but is not a minimum component size.
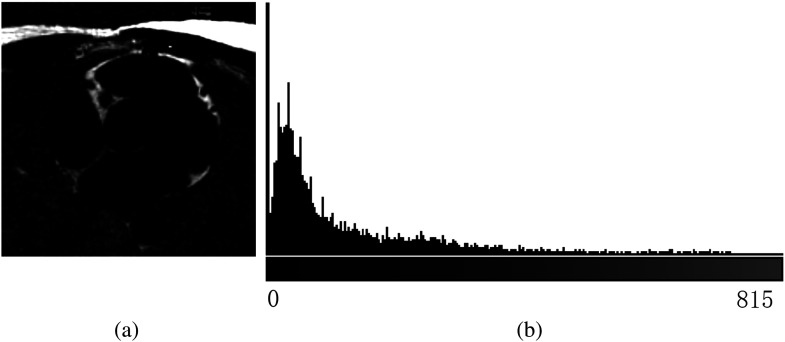
After we obtain all the 3-D segment components [Fig. 2(c)] using the iterative algorithm in Ref. 17, the mean intensity of each component and overlap rate with the heart region from the last step are calculated. Components with and are selected as pericardial fat components [Fig. 2(d)], where and are threshold values for component mean intensity and overlap rate, respectively, with the heart region masks. Based on the properties of the fat-only image, we set and . A quantitative color bar of the fat-only image is shown in Fig. 5 to illustrate the effectiveness of this value. The statistics of the color bar show that 78.2% of the voxels are zero value (nonfat voxels), and the minimum value for the rest of the nonzero voxels is 3.18. Hence, any value and can successfully distinguish fat and nonfat components. The PFV can be calculated by multiplying the total number of pericardial fat voxels by the voxel size. Paired -test, Pearson correlation, and Dice coefficient were used to measure the performance of the algorithm compared to the expert reader. A value of 0.05 was considered statistically significant.
Fig. 5.
(a) Fat-only image example and (b) its 256-bin intensity histogram.
3. Results
The PFV for the six test datasets was quantified as , compared to by the expert reader, which were not significantly different () and showed excellent correlation (, ). The mean absolute difference in PFV between the algorithm and the expert reader was . The mean value of the paired differences was (95% confidence interval: to 6.21).
The mean Dice coefficient of pericardial fat voxels was (median 0.85). Figure 6 shows three views (transverse, coronal, and sagittal) of the image data with pericardial fat segmentation result by our algorithm as red overlay, and the 3-D model of pericardial fat voxels. Table 1 lists the PFVs of all the six testing cases, measured by expert and algorithm, respectively.
Fig. 6.
Case example with algorithm segmentation overlay. Red overlay represents pericardial fat segmentation result by our algorithm: (a) transverse view, (b) coronal view, (c) sagittal view, and (d) 3-D model of pericardial fat voxels.
Table 1.
Pericardial fat volumes of the six testing cases.
| Patient # | PFV expert () | PFV algorithm () |
|---|---|---|
| 1 | 60.438 | 62.574 |
| 2 | 99.11 | 81.52 |
| 3 | 80.765 | 100.47 |
| 4 | 30.151 | 32.544 |
| 5 | 52.864 | 67.627 |
| 6 | 28.614 | 31.959 |
To evaluate the variability due to the atlas, we also evaluated our algorithm with different training datasets by grouping the subjects into atlas groups based on 40 to 60% training-testing samples with consecutive subject numbers in the atlas, while ensuring equal representation of male and female genders in the atlas groups. Each atlas group was then tested on the remaining six subjects. There are in total seven possible training and testing set combinations. The results of seven extended experiments are shown in Table 2. The algorithm achieved similar performance with different atlas cases. The PFVs calculated by the algorithm are close to the manual quantification results, with high correlation ( ranges from 0.82 to 0.94, ). The mean Dice coefficient of pericardial fat voxels ranges from 0.79 to 0.81 (median 0.80).
Table 2.
Results of 40 to 60% training-testing experiments with different combinations of atlas cases.
| # | PFV expert () | PFV algorithm () | value | Correlation () | Dice coefficient |
|---|---|---|---|---|---|
| 1 | 0.59 | 0.91, | |||
| 2 | 0.21 | 0.91, | |||
| 3 | 0.52 | 0.94, | |||
| 4 | 0.86 | 0.82, | |||
| 5 | 0.37 | 0.92, | |||
| 6 | 0.50 | 0.87, | |||
| 7 | 0.70 | 0.89, |
4. Discussion
Our imaging protocol is a needle-free noncontrast whole-heart MRA imaging technique, using a standard 1.5 T MR scanner,19 which allows direct visualization of the coronary artery stenosis. To our knowledge, our method is the first study showing feasibility of automated measurement of pericardial fat, a known cardiovascular risk factor, from these whole-heart images.
Dey et al.6 and Ding et al.9,21 also used multiatlas-based algorithms for automated segmentation of the heart region and epicardial fat in CT images. With a sufficient number of atlas images that capture major variations in different patients, multiatlas-based methods can accurately segment the boundaries of the heart region without postrefining processing on cardiac CT, mainly due to the high-resolution and high-contrast characteristics of those images. However, pure multiatlas-based algorithms could not achieve the same promising performance on finding the boundaries of the heart on our water/fat-resolved whole-heart noncontrast coronary MRA images due to lower image resolution and higher noise level. Further, the work at this time is based on a limited number of atlas cases. Our hybrid algorithm with graph-based segmentation and fat component selection after multiatlas registration is highly tolerant of error in the heart region masks from multiatlas-based segmentation. Pericardial fat voxels and boundaries can be correctly labeled with heart region initialization. This initialization provides only rough heart position and shape, without accurate boundaries of the pericardial fat. The above performance was achieved on multiatlas-based heart region masks, which have a mean surface distance of 4.16 mm and a Hausdorff distance of 7.5 mm compared to the heart region masks drawn by the expert reader.22 Without the 3-D graph-based pericardial fat component selection (Sec. 2.2.2), the fat voxel overlap given by the mean Dice coefficient decreased from 0.82 to 0.62 when only the multiatlas segmentation mask was used.
In the literature regarding pericardial fat quantification from MR images, Wong et al.13 quantified pericardial fat by tracing the ROI manually using commercially available software (Argus, Siemens Medical Solutions). The images used were sequential steady-state free-precession short-axis cine sequences that were acquired with 6-mm slice thickness and no interslice gaps through the atria and 6-mm slice thickness with 4 mm gaps through the ventricles. Our approach may be more accurate by acquiring true 3-D volume images with a slice thickness of 1 mm and no gap between slices. In addition, the fat signal is also separated by the pixel-by-pixel complex phase of the raw image,11 which is more reliable than human tracing. Though Wong et al.13 achieved low intraobserver and interobserver variation (3.5 and 4.9%, respectively), our operator-free algorithm can produce no such variations and can save time-consuming manual quantification by expert readers.
The mean fat measurement was similar to that observed in normal BMI individuals with CT (Ref. 1). (The mean BMI of our testing subjects was 23.7 and mean pericardial fat volume measured was on MRI.)
Having water-fat resolved images was critical for the proposed method to accurately segment the pericardial fat. In this work, we used the bSSFP-based phase detection method due to its simplicity and being readily available from a modified coronary MRA protocol. Future works are warranted to evaluate the ability of Dixon-type multiecho methods10,12 to provide such images, which may offer more robust performance, especially at higher field strengths.
A major limitation of this work is that we studied a small number of cases. Multiatlas segmentation performance may improve with larger numbers of atlas images, particularly with larger variation in BMI; this needs to be further evaluated in future studies. There was only one expert reader’s manual quantification results available; thus, interobserver variability could not be evaluated in this study.
5. Conclusion
The quantification of PFV from noncontrast whole-heart coronary MRA images is feasible via a hybrid approach using multiatlas-based heart region initialization and 3-D graph-based segmentation and selection of pericardial fat components. Our preliminary results demonstrate that the PFV can be calculated directly from water-fat separated MRA images, which also provide coronary MRA data. Our approach may potentially be applied in a clinical setting, allowing for accurate MRI-based PFV quantification without tedious manual tracing.
Acknowledgments
This study was supported by the American Heart Association Grant 12GRNT9450056 (to Dr. Dey).
Biography
Biographies for the authors are not available.
References
- 1.Dey D., et al. , “Computer-aided non-contrast CT-based quantification of pericardial and thoracic fat and their associations with coronary calcium and metabolic syndrome,” Atherosclerosis 209, 136–141 (2010). 10.1016/j.atherosclerosis.2009.08.032 [DOI] [PMC free article] [PubMed] [Google Scholar]
- 2.Taguchi R., et al. , “Pericardial fat accumulation in men as a risk factor for coronary artery disease,” Atherosclerosis 157, 203–209 (2001). 10.1016/S0021-9150(00)00709-7 [DOI] [PubMed] [Google Scholar]
- 3.Ding J., et al. , “The association of pericardial fat with calcified coronary plaque,” Obesity 16, 1914–1919 (2008). 10.1038/oby.2008.278 [DOI] [PMC free article] [PubMed] [Google Scholar]
- 4.Greif M., et al. , “Pericardial adipose tissue determined by dual source CT is a risk factor for coronary atherosclerosis,” Arterioscler. Thromb. Vasc. Biol. 29, 781–786 (2009). 10.1161/ATVBAHA.108.180653 [DOI] [PubMed] [Google Scholar]
- 5.Cheng V. Y., et al. , “Pericardial fat burden on ECG-gated noncontrast CT in asymptomatic patients who subsequently experience adverse cardiovascular events,” JACC: Cardiovas. Imaging 3, 352–360 (2010). 10.1016/j.jcmg.2009.12.013 [DOI] [PMC free article] [PubMed] [Google Scholar]
- 6.Dey D., et al. , “Automated algorithm for atlas-based segmentation of the heart and pericardium from non-contrast CT,” Proc. SPIE 7623, 762337 (2010). 10.1117/12.844810 [DOI] [PMC free article] [PubMed] [Google Scholar]
- 7.Mahabadi A. A., et al. , “Association of pericardial fat, intrathoracic fat, and visceral abdominal fat with cardiovascular disease burden: the Framingham Heart Study,” Eur. Heart J. 30, 850–856 (2009). 10.1093/eurheartj/ehn573 [DOI] [PMC free article] [PubMed] [Google Scholar]
- 8.Sarin S., et al. , “Clinical significance of epicardial fat measured using cardiac multislice computed tomography,” Am. J. Cardiol. 102, 767–771 (2008). 10.1016/j.amjcard.2008.04.058 [DOI] [PubMed] [Google Scholar]
- 9.Ding X., et al. , “Automated epicardial fat volume quantification from non-contrast CT,” Proc. SPIE 9034, 90340I (2014). 10.1117/12.2043326 [DOI] [Google Scholar]
- 10.Glover G., Schneider E., “Three-point Dixon technique for true water/fat decomposition with B0 inhomogeneity correction,” Magn. Reson. Med. 18, 371–383 (1991). 10.1002/mrm.1910180211 [DOI] [PubMed] [Google Scholar]
- 11.Hargreaves B. A., et al. , “Fat-suppressed steady-state free precession imaging using phase detection,” Magn. Reson. Med. 50, 210–213 (2003). 10.1002/mrm.10488 [DOI] [PubMed] [Google Scholar]
- 12.Reeder S. B., et al. , “Iterative decomposition of water and fat with echo asymmetry and least-squares estimation (IDEAL): application with fast spin-echo imaging” Magn. Reson. Med. 54, 636–644 (2005). 10.1002/mrm.20624 [DOI] [PubMed] [Google Scholar]
- 13.Wong C. X., et al. , “Pericardial fat is associated with atrial fibrillation severity and ablation outcome,” J. Am. Coll. Cardiol. 57, 1745–1751 (2011). 10.1016/j.jacc.2010.11.045 [DOI] [PubMed] [Google Scholar]
- 14.Nelson A. J., et al. , “Validation of cardiovascular magnetic resonance assessment of pericardial adipose tissue volume,” J. Cardiovasc. Magn. Reson. 10, A396 (2008). 10.1186/1532-429X-10-S1-A396 [DOI] [PMC free article] [PubMed] [Google Scholar]
- 15.Bastarrika G., et al. , “Relationship between coronary artery disease and epicardial adipose tissue quantification at cardiac CT: comparison between automatic volumetric measurement and manual bidimensional estimation,” Acad. Radiol. 17, 727–734 (2010). 10.1016/j.acra.2010.01.015 [DOI] [PubMed] [Google Scholar]
- 16.Isgum I., et al. , “Multi-atlas-based segmentation with local decision fusion: application to cardiac and aortic segmentation in CT scans,” IEEE Trans. Med. Imaging 28, 1000–1010 (2009). 10.1109/TMI.2008.2011480 [DOI] [PubMed] [Google Scholar]
- 17.Felzenszwalb P. F., Huttenlocher D. P., “Efficient graph-based image segmentation,” Int. J. Comput. Vis. 59, 167–181 (2004). 10.1023/B:VISI.0000022288.19776.77 [DOI] [Google Scholar]
- 18.Pang J., et al. , “Whole-heart coronary MRA with 100% respiratory gating efficiency: self-navigated three-dimensional retrospective image-based motion correction (TRIM),” Magn. Reson. Med. 71, 67–74 (2014). 10.1002/mrm.24628 [DOI] [PMC free article] [PubMed] [Google Scholar]
- 19.Pang J., et al. , “Accelerated whole-heart coronary MRA using motion-corrected sensitivity encoding with three-dimensional projection reconstruction,” Magn. Reson. Med. 73, 284–291 (2015). 10.1002/mrm.25097 [DOI] [PMC free article] [PubMed] [Google Scholar]
- 20.Thévenaz P., Unser M., “Optimization of mutual information for multiresolution image registration,” IEEE Trans. Image Process. 9, 2083–2099 (2000). 10.1109/83.887976 [DOI] [PubMed] [Google Scholar]
- 21.Ding X., et al. , “Automated pericardium delineation and epicardial fat volume quantification from noncontrast CT,” Med. Phys. 42, 5015–5026 (2015). 10.1118/1.4927375 [DOI] [PubMed] [Google Scholar]
- 22.Huttenlocher D. P., Klanderman G. A., Rucklidge W. J., “Comparing images using the Hausdorff distance,” IEEE Trans. Pattern Anal. Mach. Intell. 15, 850–863 (1993). 10.1109/34.232073 [DOI] [Google Scholar]


