

Abstract
Developmental dyslexia (DD) is highly heritable and previous studies observed reduced cortical volume, white matter integrity, and functional alterations in left posterior brain regions in individuals with DD. The primary sulcal pattern has been hypothesized to relate to optimal organization and connections of cortical functional areas. It is determined during prenatal development and may reflect early, genetically influenced, brain development. We characterize the sulcal pattern using graph-based pattern analysis and investigate whether sulcal patterns in parieto-temporal and occipito-temporal regions are atypical in elementary school-age children with DD and pre-readers/beginning readers (preschoolers/kindergarteners) with a familial risk (elementary school-age children: n [males/females], age range = 17/11, 84–155 months; preschoolers/kindergarteners: 16/15, 59–84 months). The pattern of sulcal basin area in left parieto-temporal and occipito-temporal regions was significantly atypical (more sulcal basins of smaller size) in children with DD and further correlated with reduced reading performance on single- and nonword reading measures. A significantly atypical sulcal area pattern was also confirmed in younger preschoolers/kindergarteners with a familial risk of DD. Our results provide further support for atypical early brain development in DD and suggest that DD may originate from altered organization or connections of cortical areas in the left posterior regions.
Keywords: cortical folding, developmental dyslexia, familial risk, MRI, sulcal pattern
Introduction
Developmental dyslexia (DD) is a specific learning disability and individuals with DD have difficulties with accurate and/or fluent word recognition and spelling/decoding performance (Peterson and Pennington 2012). Studies using magnetic resonance imaging (MRI) have reported alterations in language and reading-related brain areas in subjects with DD. For example, decreased gray matter volume and altered white matter structure in bilateral parieto-temporal and left occipito-temporal regions have been described for DD compared with controls (Rimrodt et al. 2010; Linkersdorfer et al. 2012; Vandermosten et al. 2012; Richlan et al. 2013; Wandell and Yeatman 2013). Similarly, functional alterations in DD have predominantly been observed in the left parieto-temporal and occipito-temporal regions during reading-related tasks using functional MRI (Richlan et al. 2009, 2011).
DD is highly heritable and several candidate susceptibility genes for DD have been reported, the majority of which are involved in brain development (Galaburda et al. 2006; Grigorenko 2009). Single-nucleotide polymorphisms in some of these genes have been significantly associated with the left parieto-temporal white matter structure (Darki et al. 2012), linking previous neuroimaging and genetic results. Furthermore, decreased cortical volume, reduced white matter organization, and functional alterations within parieto-temporal and occipito-temporal regions have already been detected in preliterate children at a familial risk for DD and further correlate with pre-reading skills (Raschle et al. 2011; Raschle, Zuk, Gaab 2012). These results suggest atypical early development and a genetic basis for DD.
Here, we analyzed another important feature of brain structure, sulcal pattern, in elementary school-age children with a clinical DD diagnosis and pre-readers/beginning readers with a familial risk for DD (but no diagnosis yet due to their age) to reflect atypical early brain development of DD. Sulcal pattern, meaning the global pattern of arrangement, number, and size of primary sulcal folds, has been hypothesized to relate to optimal organization of cortical functional areas and their white matter connections (Van Essen 1997; Klyachko and Stevens 2003; O'Leary et al. 2007; Fischl et al. 2008). Moreover, the primary cortical folding pattern is determined during prenatal development and may therefore better reflect genetically influenced, early brain development (Chi et al. 1977; Garel et al. 2001; Rakic 2004; Kostovic and Vasung 2009), which cannot be examined with conventional volumetric techniques, such as voxel-based morphometry (VBM; Ashburner and Friston 2000) or cortical thickness measurement (Lerch and Evans 2005). Recently, we proposed a novel method of performing a quantitative analysis and comparison of primary sulcal pattern using graph structure (Im, Pienaar, et al. 2011). This technique has been shown to support a genetic impact on the sulcal pattern using twin data (Im, Pienaar, et al. 2011) and also provided a quantitative means for detecting the severity and extent of involvement of cortical malformations (Im, Pienaar, et al. 2013).
For the first time, the current study provides a comprehensive description of atypical sulcal pattern and its relationship with behavior in children with DD, which might originate from altered organization of white matter and cortical function. We further characterize atypical sulcal pattern formation in preschoolers/kindergarteners with a familial risk for DD before a diagnosis of DD can be made. Since functional and structural brain alterations in individuals with DD have been primarily observed in left hemispheric posterior brain regions (Richlan et al. 2011; Linkersdorfer et al. 2012), we restricted our analysis of sulcal pattern to left hemispheric parieto-temporal and occipito-temporal regions and further examined the same control regions in the right hemisphere.
Materials and Methods
Subjects
Fifty-nine healthy, English speaking children have been included in the present analyses, 28 child readers (age range: 84–155 months, mean age: 122.6 months, 17 males and 11 females) with (n = 15; DD) and without (n = 13; TYP) a diagnosis of DD and 31 pre-readers/early beginning readers (“preschool/kindergarten” group; age range: 59–84 months, mean age: 69.9 months, 16 males and 15 females) with (FHD+, n = 15) and without (FHD−, n = 16) a familial risk for DD. Here, familial risk and family history of DD is abbreviated to FHD. MRI data of all children were reviewed on a case-by-case basis to ensure the imaging quality. All children had nonverbal IQs within the average range (Tables 1 and 2). Two pre-reading children (1 FHD+ and 1 FHD−) showed nonverbal IQs below 1 standard deviation (SD) from the mean, but were included since their verbal IQ indicated an average verbal IQ.
Table 1.
Behavioral measures in child readers with and without a diagnosis of DD
| TYP | DD | P-value | |
|---|---|---|---|
| Age in months | 130.61 (16.29) [13] | 120.27 (19.58) [15] | 0.144 |
| Behavioral measures | |||
| CTOPP | |||
| Elision | 12.43 (1.90) [7] | 8.15 (3.10) [13] | 0.004* |
| Nonword | 10.33 (1.51) [6] | 8.00 (1.68) [13] | 0.010* |
| KBIT | |||
| Nonverbal ability | 112.85 (8.85) [13] | 105.54 (9.57) [14] | 0.060 |
| RAN | |||
| Letters | 109.85 (11.37) [13] | 81.67 (27.01) [12] | 0.002* |
| TOSWRF | 110.39 (13.89) [13] | 91.54 (13.50) [13] | 0.002* |
| TOWRE | |||
| Sight Word | 113.00 (9.13) [12] | 83.31 (13.45) [13] | <0.001* |
| Phonemic Decoding | 114.75 (12.6) [12] | 88.33 (10.26) [12] | <0.001* |
| WISC | |||
| Digit Span | 10.8 (2.2) [13] | 8.82 (3.55) [11] | 0.114 |
| Coding | 11.23 (1.83) [13] | 8.08 (1.68) [12] | <0.001* |
| WRMT | |||
| Passage | 111.33 (8.57) [6] | 93.46 (6.01) [13] | <0.001* |
Note: Values in square parentheses indicate the number of valid data sets.
Data: mean (SD) [number of subjects], *P < 0.05.
Measures (standard scores are reported).
Table 2.
Behavioral measures in child pre-readers/beginning readers with (FHD+) and without a familial risk for dyslexia (FHD−)
| FHD− | FHD+ | P-value | |
|---|---|---|---|
| Age in months | 69.5 (8.0) [16] | 70.4 (5.9) [15] | 0.714 |
| Behavioral measures | |||
| CELF | |||
| Core language | 110.69 (10.35) [16] | 109.60 (7.83) [15] | 0.745 |
| Receptive language | 109.06 (11.38) [16] | 107.84 (11.21) [13] | 0.775 |
| Expressive language | 110.81 (10.57) [16] | 108.20 (10.28) [15] | 0.491 |
| Language structure | 111.06 (9.98) [16] | 109.54 (10.13) [13] | 0.688 |
| Language content | 108.82 (12.76) [11] | 105.70 (11.87) [11] | 0.570 |
| CTOPP | |||
| Blending | 11.69 (2.21) [16] | 11.20 (2.00) [15] | 0.527 |
| Elision | 11.31 (2.33) [16] | 10.27 (2.74) [15] | 0.260 |
| Nonword | 9.75 (2.35) [16] | 10.27 (2.09) [15] | 0.524 |
| KBIT | |||
| Nonverbal ability | 102.67 (12.85) [15] | 97.13 (10.53) [15] | 0.208 |
| Verbal ability | 111.38 (14.41) [13] | 114.42 (10.61) [12] | 0.558 |
| RAN | |||
| Colors | 101.56 (13.02) [16] | 90.67 (18.53) [15] | 0.067 |
| Objects | 101.33 (12.01) [15] | 92.13 (16.66) [15] | 0.094 |
| WRMT | |||
| Letter | 107.36 (5.84) [14] | 98.07 (12.20) [15] | 0.016* |
| Word | 111.44 (23.96) [16] | 95.47 (18.07) [15] | 0.046* |
Note: Values in square parentheses indicate the number of valid data sets.
Data: mean (SD) [number of subjects], *P < 0.05.
Measures (standard scores are reported).
All participants were screened for hearing or vision difficulties, neurological disease or trauma, and for psychiatric disorders before participation (per parent report). All DD children had a clinical diagnosis of DD or a clinician-diagnosed reading disability. Among DD child readers, 6 subjects reported a first-degree relative with a diagnosis of DD. TYP children had no reported clinical diagnoses of any developmental disability, and none of the participants had a family history of psychiatric and neurological disorders. One TYP had a first-degree relative with a diagnosis of DD and one had a relative with a family history of attention deficit hyperactivity disorder. However, these children all exhibited reading standard scores within the average range and were thus included in the typical reading group. Among pre-reader/beginning reader participants, FHD+ children had at least one first-degree relative with a clinical diagnosis of DD. FHD− children had no first-degree relative with a clinical diagnosis of DD.
This study was approved by the ethics committee of Boston Children's Hospital. Verbal assent and informed consent were obtained from each child and guardian, respectively.
Behavioral Group Characteristics
All participants were characterized using a test battery of age-corrected, standardized assessments examining language and pre-reading skills, such as expressive and receptive vocabulary (Clinical Evaluation of Language Fundamentals [CELF Preschool 2nd edition]; pre-readers/beginning readers only; Semel et al. 1986), phonological processing (Comprehensive Test of Phonological Processing [CTOPP]; Wagner et al. 1999), working memory (Wechsler Intelligence Scale for Children [WISC]; child readers only; Wechsler 2003), and rapid automatized naming (Rapid Automatized Naming [RAN] Test) (Wolf and Denckla 2005). Furthermore, DD and TYP children's reading skills were examined using the revised Woodcock Reading Mastery Test (WRMT) passage comprehension subtest (Woodcock 1998), the Test of Silent Word Reading Fluency (TOSWRF; Mather et al. 2004), the Test of Word Reading Efficiency (TOWRE; Torgesen et al. 1999). WRMT word and letter identification subtests were performed for FHD+ and FHD− children (Woodcock 1998). All participants were assessed for nonverbal IQ (Kaufman Brief Intelligence Test [KBIT] nonverbal matrices; Kaufmann and Kaufmann 1997). FHD+ and FHD− children's verbal IQ was assessed using the KBIT verbal subtest (Kaufmann and Kaufmann 1997). Behavioral testing was administered on a different day than imaging. For a complete overview of the behavioral assessments and differences between the groups, see Tables 1 and 2. To avoid potential confounds such as socioeconomic status (SES), all participant families were given an SES background questionnaire (questions adapted from the MacArthur Research Network: http://www.macses.ucsf.edu), including questions concerning parent education and family income (see Supplementary Tables 1 and 2). Pre-reader participant families also answered questions regarding their home literacy environment (Supplementary Table 3; Denney et al. 2001; Katzir et al. 2009).
Image Acquisition and Processing
For all children, an age-appropriate neuroimaging protocol was used, including intensive familiarization with the MRI equipment prior to the actual neuroimaging session and behavioral protocols for minimizing motion in the scanner (Raschle et al. 2009; Raschle, Zuk, Ortiz-Mantilla, et al. 2012). All T1-weighted imaging was performed on a Siemens 3-T whole body scanner. The following sequence was acquired for each patient: Magnetization-prepared rapid gradient-echo (MPRAGE; 128 slices, time repetition = 2000 ms, time echo = 3.39 ms, time to inversion = 900 ms, flip angle = 9°, field of view = 256 mm, voxel size [mm]: 1.0 × 1.0 × 1.3). The images were processed to extract cortical surfaces using the FreeSurfer pipeline (Dale et al. 1999; Fischl et al. 1999). The cortical surface models were automatically parcellated into anatomical regions based on the gyral/sulcal structure (Fischl et al. 2004; Desikan et al. 2006; Fig. 1).
Figure 1.

Definition of the ROI (parieto-temporal and occipito-temporal regions) and similarity measure of the sulcal graphs between different brain pairs and MDS plots showing sulcal pattern similarity between subjects. The boundary vertices between inferior temporal and middle temporal banks of the superior temporal and supramarginal areas, and lateral occipital and inferior parietal areas, and between superior temporal area and supramarginal area, are selected. The region <35 mm from the boundary is defined as an ROI for sulcal pattern analysis. Sulcal pits correspond to nodes in the graph structure and sulcal pits are connected with an undirected edge. Two sulcal graphs are optimally matched and their similarity is measured by using the geometric features of nodes (3D position and area of sulcal basin) and their relationships between nodes, and the graph topological features (the number of edges and the paths between nodes). For the MDS plots, pairwise sulcal pattern similarity between subjects are shown and distances are derived from a similarity value (1—similarity) between subjects, such that shorter distance indicates higher similarity. MDS plots with the whole feature (a) and sulcal basin area (b) are shown (blue: TYP and red: DD).
We aimed to analyze sulcal pattern in the left and right hemispheric parieto-temporal and occipito-temporal regions, which covered areas larger than 1 or 2 specific sulci. Sulcal folds do not form independently, but must be geometrically and topologically related to other adjacent sulcal folds. To reflect intersulcal relationships and find atypical global pattern of primary sulci, a relatively large region of interest (ROI) was selected, covering several sulcal folds in both parieto-temporal and occipito-temporal regions. Selecting a smaller region is suboptimal for the here employed technique since the location of atypical folding pattern may be more heterogeneous across individuals and more diffuse than we hypothesize in DD. Our previous studies also analyzed sulcal patterns and reported significant findings in twin subjects and polymicrogyria patients at a lobar regional level, which is larger than the current ROI (Im, Pienaar, et al. 2011; Im, Pienaar, et al. 2013). The boundary vertices were determined between inferior temporal, middle temporal, banks of the superior temporal, and supramarginal areas and lateral occipital and inferior parietal areas, as well as between the superior temporal area and supramarginal area (Fig. 1). The geodesic distance was computed along the surface from the boundary vertices as seeds. The region <35 mm from the boundary was defined as an ROI for sulcal pattern analysis.
Quantitative Comparison and Similarity Measure of Sulcal Pattern
Sulcal pattern in the parieto-temporal and occipito-temporal regions was represented with a graph structure using sulcal pits as the nodes (Fig. 1). Sulcal pits were defined as the deepest local points of sulcal fundi and their spatial distribution was shown to be related to brain functions that might be under genetic control (Lohmann et al. 2008; Im et al. 2010; Im, Choi, et al. 2011) and their identification from MRI was highly reliable according to different scan sessions, scanners, and different surface extraction tools (Im, Lee, et al. 2013). Sulcal pits and their sulcal catchment basins can automatically be identified by using a smoothed sulcal depth map on the white matter surface (Im et al. 2010). A watershed segmentation algorithm based on a depth map was used to extract sulcal pits on triangular meshes, merging shallow and small folds (Im et al. 2010). Each sulcal pit became a node in the graph representation. If sulcal basins met, sulcal pits in those basins were connected with an undirected edge (Fig. 1). This sulcal graph was designed to characterize the pattern of primary sulcal folding, because shallow and small secondary and tertiary sulci appear to form later and may be more influenced by other chaotic events of the folding process (Regis et al. 2005), which is less important for our hypothesis tests.
To compare different sulcal graph sets, we used not only geometric features of nodes (3D position and area of sulcal basin), but also geometric relationships between nodes to reflect intersulcal relationships. Moreover, we exploited the features of graph topology (the number of edges and the paths between nodes) to characterize the interrelated sulcal arrangement and patterning. The optimal match was determined by having the minimum difference of the features between 2 sulcal graphs and then computing their similarity, which ranged from 0 to 1, by using a spectral matching technique (Leordeanu and Hebert 2005; Im, Pienaar, et al. 2011). Furthermore, this method also allowed variable weighting of geometric and topological features to assess their relative importance on sulcal pattern similarity. If any significant result in the similarity with all features was revealed, we evaluated the impact of each individual feature on similarity measures by setting all weights of the other features to 0. For a more detailed explanation of the methodological procedures, see Im, Pienaar, et al. (2011) and Im, Pienaar, et al. (2013).
Since 3D position of sulcal pit was needed for optimal matching of the sulcal graph and similarity measure, we used the cortical surface linearly transformed to the standard Talairach space. Scaling of brain size and incomplete spatial/anatomical correspondence between different children's brains through Talairach normalization could have an effect on the similarity measure. However, we characterized intrinsic sulcal patterns by using geometric and topological intersulcal relationships, which may be minimally affected by global effects such as brain size or Talairach normalization. In previous experiments, although there is spatial deformation of the brain, this method showed reliable sulcal pattern matching and similarity measures (Im, Pienaar, et al. 2011).
Statistical Sulcal Pattern Analysis in DD and TYP Children, and FHD+ and FHD− Children
Using the graph-based sulcal pattern comparison method, sulcal pattern similarities of all possible pairs in 2 groups were automatically computed for the left and right parieto-temporal and occipito-temporal regions. We tested whether the similarity within TYP was significantly different when compared with the similarity between TYP and DD groups. Each TYP subject had a mean similarity (S′) with the other TYP subjects. For each DD subject, the mean similarity with all TYP subjects was calculated.
where T and D are TYP and DD groups, respectively, n the number of subjects in the group, and S the sulcal pattern similarity between 2 subjects. The differences between TYP and DD groups in the mean similarity were examined with an independent samples t-test. After identifying the sulcal features showing significant group differences between DD and TYP, only those features were investigated for further correlation and preschoolers/kindergarteners group analyses.
Additionally, the sulcal pattern similarities within the DD group were compared with those within the TYP group to examine the sulcal pattern variability in DD.
The differences between and were examined with an independent sample t-test.
A Pearson correlation test was employed to investigate the relationship between similarity to the typical sulcal pattern and pre-reading/reading measures in DD children. The measures such as CTOPP Elision, TOWRE Sight Word, and TOWRE Phonemic Decoding were used for the correlation analysis to examine the relationship between sulcal pattern and key components of reading skills, including phonological processing, timed single-word reading, and timed pseudoword reading. These measures were chosen in particular since previous studies have reported correlations between brain alterations in parieto-temporal and occipito-temporal regions and the CTOPP Elision and TOWRE subtests (Breier et al. 2003; Kronbichler et al. 2006; 2008; Blau et al. 2010; Raschle, Zuk, Gaab 2012; Pugh et al. 2013; Richlan et al. 2013). Valid data were not available for some subjects, and consequently the correlation analysis was performed with 12 or 13 participants (Table 1). False discovery rate (FDR) control was used to correct for multiple comparisons at a q-value of 0.05 (Benjamini and Hochberg 1995; Genovese et al. 2002).
After analyzing elementary school-age children, sulcal pattern was examined in younger children (pre-readers/beginning readers) with FHD+ using the same analysis as described above. Sulcal pattern similarity within FHD− () was compared with that between the FHD− and FHD+ groups (). Within-group similarity of sulcal pattern was also compared between the FHD− and FHD+ groups . The correlation between sulcal pattern similarity to FHD− and pre-reading test was examined in FHD+ children. Only the CTOPP Elision score was included in the correlation analysis since some of these children were still pre-readers; therefore, reading and letter knowledge measures showed bottom effects in some children.
We finally performed a supplementary analysis to examine sulcal pattern similarity across age. Sulcal pattern similarities were measured between TYP and FHD− and between DD and FHD+ , and then compared with the mean similarities between the pair TYP and DD and the pair FHD− and FHD+ .
Results
Demographics and Behavioral Measures
All children with DD, compared with TYP, showed reduced performance on most psychometric measures at a 0.05 level of P, except for the KBIT nonverbal ability and the WISC Digit Span (Table 1). Because of missing data in the TYP children for the subtests CTOPP Elision and Nonword, and WRMT Passage scores, statistical results of group difference in these behavioral measures should be interpreted with caution. In pre-readers/early beginning readers, we observed significantly lower scores on the WRMT Letter (P = 0.016) and Word (P = 0.046) subtests in FHD+ compared with FHD− (Table 2).
Atypical Sulcal Pattern in Children with DD
The DD group showed significantly low similarity to the TYP group in the left hemispheric sulcal pattern measured with the whole set of various features at a 0.05 level of P (P = 0.038). We confirmed that sulcal pattern similarities were not significantly related to age difference (correlation coefficient r = −0.009, P = 0.874), brain size difference (r = −0.059, P = 0.293), or gender difference (t-statistic = −0.525, P = 0.600) from all pairs in the DD and TYP children groups (Supplementary Fig. 1). Additional statistical tests were performed for each individual feature to evaluate their impact on similarity measures. Significantly lower mean similarity between the DD and TYP groups were observed for sulcal basin area (P = 0.001), but not for other features, 3D position (P = 0.268), and graph topology (P = 0.486). Multidimensional scaling (MDS) plots derived from a similarity value (1−similarity) show a global view of the sulcal pattern similarity between subjects with the whole feature and sulcal basin area in the left hemisphere, indicating dissimilarity between 2 groups (Fig. 1a,b). An example of the characteristic of different patterns in sulcal basin area is illustrated in Figure 2a. Although the ROI is kept identical between subjects, sulcal basins of 2 brains with a different relative size or 2 brains with a different number of sulcal basins will show a lower similarity value in the pattern of sulcal basin area. An example of optimal sulcal pattern matching and similarity measure in left parieto-temporal and occipito-temporal regions is shown in Figure 2b. There was no significant group difference of sulcal pattern in the right hemisphere. Table 3 summarizes all statistical results for the group comparisons. Further analysis of sulcal basin area in the left hemisphere revealed significant differences between TYP and DD in the number (TYP, mean [SD]: 18.46 [1.95], DD: 19.93 [1.43], P = 0.036) and the area (TYP: 11.93 [1.40] (cm2), DD: 10.73 [0.78], P = 0.011) of sulcal basins. Only the similarity values based on the total feature and sulcal basin area were investigated for further correlation and younger children group analyses. The DD group also showed significantly lower within-group similarity than the TYP group for the total sulcal pattern (P = 0.031), the position (P = 0.002), and area (P = 0.034) of sulcal basin in the left hemisphere, which suggests larger sulcal pattern variability in DD (Table 4).
Figure 2.
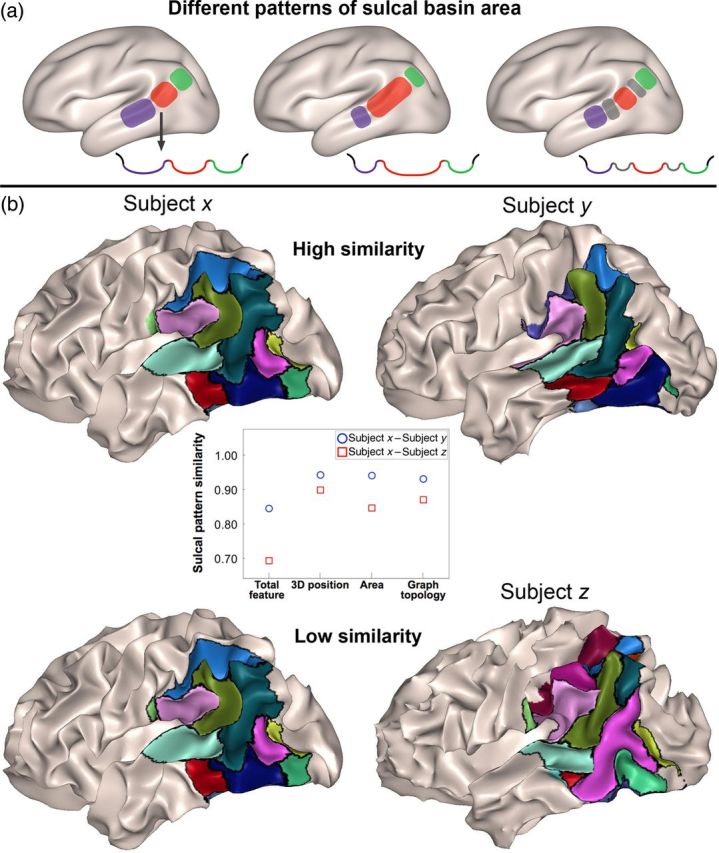
Corresponding sulcal basins across subjects and the cross-section of sulcal fundus area are illustrated to characterize different patterns in sulcal basin area (a). Corresponding sulcal basins are marked in the same color. The real examples of optimal sulcal pattern matching and similarity measure in left parieto-temporal and occipito-temporal regions are shown (b). Although the ROI is kept identical between subjects, sulcal basins of 2 brains with a different relative size, or 2 brains with a different number of sulcal basins, will show a lower similarity value in the pattern of sulcal basin area. In the example pair here, the matched sulcal basins of the paired brains are marked with the same color and black boundaries. The pairing of subject x and y shows higher sulcal pattern similarity values (similarity, total feature: 0.845, position: 0.943, sulcal basin area: 0.941, and graph topology: 0.931) than the pairing of subjects x and z (total feature: 0.693, position: 0.898, sulcal basin area: 0.846, and graph topology: 0.870). A particularly decreased similarity in the pattern of the sulcal basins area is revealed when paring subjects x and z, and the different relative size of the sulcal basins can be visually observed between the 2 brains.
Table 3.
Statistical results for the comparisons of the sulcal pattern similarity within the TYP group and the similarity between TYP and DD groups with different feature sets, and within the FHD− group and between FHD− and FHD+ groups with the total feature and sulcal basin area
| TYP | TYP vs. DD | P-value | |
|---|---|---|---|
| Left | |||
| Total feature | 0.7643 (0.0123) | 0.7521 (0.0166) | 0.038* |
| 3D position | 0.9026 (0.0037) | 0.9007 (0.0047) | 0.268 |
| Sulcal basin area | 0.8972 (0.0101) | 0.8843 (0.0089) | 0.001* |
| Graph topology | 0.9067 (0.0082) | 0.9091 (0.0099) | 0.486 |
| Right | |||
| Total feature | 0.7519 (0.0201) | 0.7435 (0.0128) | 0.192 |
| 3D position | 0.9019 (0.0049) | 0.9022 (0.0044) | 0.878 |
| Sulcal basin area | 0.8854 (0.0092) | 0.8798 (0.0070) | 0.077 |
| Graph topology | 0.9043 (0.0174) | 0.9041 (0.0130) | 0.982 |
| FHD− | FHD− vs. FHD+ | P-value | |
| Left | |||
| Total feature | 0.7698 (0.0114) | 0.7515 (0.0165) | 0.001* |
| Sulcal basin area | 0.8923 (0.0061) | 0.8842 (0.0114) | 0.018* |
Note: Data: mean (SD), *P < 0.05.
Table 4.
Statistical results for the comparisons of the sulcal pattern similarity within the TYP group and the similarity within the DD group, and within the FHD− group and within the FHD+ group
| TYP | DD | P-value | |
|---|---|---|---|
| Left | |||
| Total feature | 0.7643 (0.0123) | 0.7530 (0.0137) | 0.031* |
| 3D position | 0.9026 (0.0037) | 0.8973 (0.0044) | 0.002* |
| Sulcal basin area | 0.8972 (0.0101) | 0.8897 (0.0076) | 0.034* |
| Graph topology | 0.9067 (0.0082) | 0.9051 (0.0093) | 0.633 |
| Right | |||
| Total feature | 0.7519 (0.0201) | 0.7512 (0.0123) | 0.918 |
| 3D position | 0.9019 (0.0049) | 0.9052 (0.0058) | 0.132 |
| Sulcal basin area | 0.8854 (0.0092) | 0.8887 (0.0068) | 0.296 |
| Graph topology | 0.9043 (0.0174) | 0.8996 (0.0105) | 0.393 |
| FHD− | FHD+ | P-value | |
| Left | |||
| Total feature | 0.7698 (0.0114) | 0.7503 (0.0130) | <0.001* |
| 3D position | 0.8970 (0.0074) | 0.8999 (0.0049) | 0.217 |
| Sulcal basin area | 0.8923 (0.0061) | 0.8911 (0.0092) | 0.686 |
| Graph topology | 0.9208 (0.0062) | 0.8988 (0.0127) | <0.001* |
| Right | |||
| Total feature | 0.7619 (0.0139) | 0.7328 (0.0240) | <0.001* |
| 3D position | 0.9004 (0.0055) | 0.8986 (0.0083) | 0.473 |
| Sulcal basin area | 0.8881 (0.0088) | 0.8774 (0.0116) | 0.007* |
| Graph topology | 0.9152 (0.0085) | 0.8946 (0.0138) | <0.001* |
Note: Data: mean (SD), *P < 0.05.
Correlation analyses showed that the sulcal pattern similarity to TYP based on the whole feature was significantly associated with the TOWRE Sight Word (P = 0.008) and TOWRE Phonemic Decoding (P = 0.014) in DD after FDR correction (Fig. 3a,b). The correlations between the similarity of sulcal basin area and the behavioral measures did not reach statistical significance. Statistical results for all correlations are presented in Table 5.
Figure 3.

Scatter plots of the similarity of total sulcal pattern to the TYP group and TOWRE Sight Word (a) and TOWRE Phonemic Decoding (b) scores in the left parieto-temporal and occipito-temporal regions in children with DD.
Table 5.
Statistical results for the correlation between the sulcal pattern similarity with the TYP group and language scores in the DD group in the left posterior brain regions
| CTOPP Elision | TOWRE Sight Word | TOWRE Phonemic Decoding | |
|---|---|---|---|
| Total feature | 0.412 (0.162) | 0.699 (0.008)* | 0.685 (0.014)* |
| Sulcal basin area | 0.394 (0.183) | 0.532 (0.061) | 0.417 (0.177) |
Note: Data: correlation coefficient r (P-value), *corrected P < 0.05.
Atypical Sulcal Pattern in FHD+ Children (Pre-Readers/Beginning Readers)
The FHD+ group showed significantly lower mean similarity with FHD− in the total sulcal pattern (P = 0.001) in the left hemisphere. In addition, significantly lower mean similarity between the FHD+ and FHD− groups was also shown in the sulcal basin area (P = 0.018; Table 3). Sulcal pattern similarity within FHD+ was significantly lower than that within FHD− for the total sulcal feature (P < 0.001) and sulcal graph topology (P < 0.001) in both hemispheres, and for the sulcal basin area in the left (P = 0.007; Table 4). The correlations between the CTOPP Elision score and the similarities of total sulcal feature (P = 0.200) and sulcal basin area (P = 0.831) were not statistically significant.
When comparing across age groups, the similarities between TYP and FHD− were significantly higher than the mean similarities between the pairs TYP and DD, and the pairs FHD− and FHD+ for the whole feature (left: P = 0.010, right: P = 0.011) and sulcal basin area (left: P = 0.012, right: P < 0.001) in both hemispheres (see Supplementary Table 4). The DD and FHD+ groups also showed significantly higher between-group similarities than the mean similarities of the pair TYP and DD, and the pair FHD− and FHD+ for the whole feature (P = 0.012) and sulcal basin area (P < 0.001) in the left hemisphere (see Supplementary Table 4).
Discussion
Our graph-based sulcal pattern comparison method detected atypical sulcal pattern in left parieto-temporal and occipito-temporal regions in children with a clinical diagnosis of DD. We further observed the atypical pattern to correlate with timed single-word and nonword reading measures. Additionally, we confirmed the atypicality of sulcal pattern in the same left hemispheric region in FHD+ pre-readers/early beginning readers.
Atypical findings in both neuroanatomy and function have been demonstrated within the left parieto-temporal and occipito-temporal areas in individuals with DD or children with a familial risk of DD, and these cortical areas are known to be involved in language processing and reading (Galaburda et al. 1985; Brambati et al. 2004; Eckert et al. 2005; Hoeft et al. 2006; 2007; Raschle et al. 2011; Richlan et al. 2011; Linkersdorfer et al. 2012; Raschle, Zuk, Gaab 2012; Vandermosten et al. 2012; Richlan et al. 2013). Primary sulcal pattern measurements in a broad cortical area differ in biological meaning from other volumetric measurements and might better reflect genetic influences on cortical development with less influence from environmental factors. Volumetric measurements such as cortical thickness are largely affected by postnatal developmental changes (Shaw et al. 2008). However, the global pattern of primary gyri and sulci is prenatally determined and regulated in space and time (Chi et al. 1977; Garel et al. 2001; Kostovic and Vasung 2009; White et al. 2010) and shows little change with age during postnatal cortex development (Meng et al. 2014). As expected, we demonstrated that global sulcal pattern was not associated with age difference in the older children group whose ages range from 7 to 12 years.
Sulcal folding pattern may be related to the patterning of cortical functional areas and a visible indicator of their anatomical neuronal connections (Welker 1990; Van Essen 1997). Cortical areas do not develop independently, but rather in relation to other functional areas with optimized white matter connections, and accordingly show specific positions and sizes of the areas (Klyachko and Stevens 2003; Leingartner et al. 2007; O'Leary et al. 2007). These aspects of early cortical organization might give rise to specific sulcal patterns, which show geometric and topological relationships of sulcal folds. Therefore, we characterized interrelated sulcal arrangement and patterning in a relatively large area including several sulcal folds and effectively detected an atypical global pattern of primary sulci in DD. Our results support the hypothesis that structural alterations in DD are not (only) due to experience-dependent brain changes after reading onset, but may be present in early childhood or develop in utero (Galaburda et al. 2006; Raschle et al. 2011; Raschle, Zuk, Gaab 2012). This is in line with reports of candidate genes for DD (ROBO1, DYX1C1, DCDC2, and KIAA0319), which have been shown to be crucial for brain development and especially neuronal migration (Meng et al. 2005; Galaburda et al. 2006; Paracchini et al. 2006; Wang et al. 2006; Grigorenko 2009; Peterson and Pennington 2012). Furthermore, single-nucleotide polymorphisms in some of these genes have been significantly associated with structural and functional brain alterations, linking neuroimaging and genetic results (Cope et al. 2012; Darki et al. 2012; Marino et al. 2014). Neuronal migration abnormalities induced by disruption of the DD susceptibility genes have been shown to result in neocortical malformation in dyslexic brains (Galaburda et al. 1985; Rosen et al. 2007), but also might be associated with atypical sulcal pattern. Based on the radial unit and protomap hypothesis, cortical neurons originated in the proliferative ventricular and subventricular zones carry intrinsic programs for cortical functional regionalization and migrate to their proper laminar and areal positions (Rakic 1988, 2009). Defective neuronal migration might affect the organization of cortical areas and their underlying connections, possibly causing altered sulcal pattern in DD.
Among 3D position and area of sulcal basin, and graph topology, the area pattern of sulcal basin was significantly atypical in DD. Our post hoc analysis showed more sulcal basins of smaller size in DD, which may be one of the factors leading to significantly different sulcal area patterns (Fig. 2a). This might be an indicator for altered size of language-related cortical areas and white matter pathways connecting these areas, resulting in inefficient language processing in DD. Interestingly, we further observed an atypical sulcal pattern in the same feature (sulcal basin area) in younger children with a familial risk of DD, which strengthened our result. Using the qualitative method of Steinmetz et al. (1990), previous studies visually categorized the 4 sulcal types of left posterior perisylvian region and observed more cortical folding with extra sulci in this region in DD (Steinmetz et al. 1990; Leonard et al. 1993). When compared with our study, their approaches were focused on the different smaller region, and might be less powerful for detecting atypical sulcal pattern that is visually ambiguous and below the threshold of visual detection. This may be due to a discrepancy in the findings reported by another recent study, using the same approach but revealing no significant group difference between normal and DD subjects (Hiemenz and Hynd 2000). Nevertheless, one could still hypothesize that, in general, atypical sulcal area pattern with extra sulcal folds in the left posterior regions may be utilized as a marker for DD.
For most features, DD and FHD+ children revealed greater within-group variability of the sulcal pattern than TYP or FHD− children. This suggests that the atypical sulcal pattern in DD appears to be more heterogeneous than in typically developing children. Cortical development in DD may be affected by atypical control of a variety of DD susceptibility genes and their interactions, which could result higher variability of atypical sulcal patterns. However, the influence of these genes on cortical development is not yet fully understood. Moreover, not all of the FHD+ children will develop DD and thus, the FHD+ group may show higher heterogeneity (similar to a comparison between TYP and DD). When analyzing sulcal pattern similarity across age, TYP and FHD− children show a higher similarity to each other than to the atypical groups (DD and FHD+) despite the age difference. Atypical sulcal patterns in DD and FHD+ were heterogeneous as demonstrated above, but the similarity between DD and FHD+ was still higher than the similarities to their control groups, TYP and FHD−, suggesting that sulcal pattern alterations related to DD are similar across age. However, only about 50% of the FHD+ children will develop DD and therefore, the actual similarity across age may be much higher than estimated here. Our longitudinal design will enable us to determine which FHD+ children will develop DD, and this will further help to disentangle genotypes and phenotypes and give us important insights about specificity of the presented results in the future.
Almost half of the FHD+ children in this study (7 children among 15) are the same children as those reported in the previous VBM study, which revealed significantly reduced gray matter volume for FHD+ compared with FHD− pre-readers in left parieto-temporal and occipito-temporal regions (Raschle et al. 2011). Reduced gray matter volume and atypical sulcal patterns might be related in some respects, but they are not simply comparable because the 2 measurements have distinct biological meanings as explained above. Further studies with a more sophisticated analysis approach are needed to determine the relationships between alterations in cortical volume and sulcal pattern in the same large group of children.
In older children with a diagnosis of DD only, atypical sulcal pattern in the left ROI was also associated with the ability to efficiently read single words and nonwords (TOWRE Sight Word and Phonemic Decoding; Torgesen et al. 1999). Previous findings from diffusion tensor imaging indicated significant positive correlations between white matter organization and TOWRE composite score in various language regions including the left parietal and temporal regions (Rimrodt et al. 2010), which supports our results. Interestingly, we did not observe a correlation between atypical sulcal pattern and phonological awareness (CTOPP Elision) in children with DD or younger preschoolers/kindergarteners with FHD+. Phonological awareness has been especially linked to temporo-parietal brain regions (Schlaggar and McCandliss 2007; Richlan et al. 2011), and our ROI is much larger and covers both parieto-temporal as well as occipito-temporal regions which both have been linked to single-word and paragraph reading since it requires phonological analyses as well as orthographical processing. Our previous VBM study, which indicated less gray matter volume indices in FHD+ compared with FHD− pre-reading children, did observe a significant correlation with the CTOPP blending subtest (Raschle et al. 2011), but there are important differences between these 2 studies. We previously showed a correlation between phonological awareness and gray matter volume indices in occipito-temporal regions across both groups, FHD+ and FHD− children, and here due to the nature of the analyses we can only look at FHD+ children. Furthermore, the children in our previous VBM study were all pre-readers and the current study has a mix of readers and pre-readers. Learning to read and especially structured reading instruction has an influence on phonological awareness, and may have diminished the effects. Furthermore, we previously observed correlations within occipito-temporal regions only, and no effect was seen for parieto-temporal regions. In order to reflect intersulcal relationships and to find atypical global pattern of primary sulci, we had to combine the 2 regions in the current study which may have canceled out these effects.
It is important to note that only approximately 50% of children with a first-degree relative with reading difficulties will eventually develop difficulties (Snowling et al. 2007). The correlations between atypical sulcal patterns and pre-reading language scores observed in FHD+ children are presumably weakened by the children who develop to be typical readers, which may result in no statistical significance. Furthermore, it is important to note that our results do not enable us to answer the important questions of specificity and sensitivity of atypical sulcal patterns in individuals with DD. Further studies, especially longitudinal studies, are needed to determine whether specific atypical sulcal patterns are found in DD, whether these are unique to DD and how they relate to genotypes and developmental trajectories. However, since primary sulcal patterns are determined in utero, this analysis may have the potential to identify children at risk as neonates or even in the third trimester of fetal life.
Supplementary Material
Supplementary material can be found at http://www.cercor.oxfordjournals.org/ online.
Funding
This work was supported by the Eunice Kennedy Shriver National Institute of Child Health & Human Development (1R01HD065762-01/04 to N.G.); Charles H. Hood Foundation (to N.G.); Boston Children's Hospital Pilot Grant (to N.G.); Boston Children's Hospital Faculty Career Development Award (to K.I.); the Swiss National Foundation (to N.M.R), and the Janggen-Pöhn Stiftung (to N.M.R.).
Supplementary Material
Notes
We thank all participating families and Jennifer Zuk and Jennifer Minas for their help with image preprocessing. Conflict of Interest: None declared.
References
- Ashburner J, Friston KJ. 2000. Voxel-based morphometry—the methods. Neuroimage. 11:805–821. [DOI] [PubMed] [Google Scholar]
- Benjamini Y, Hochberg Y. 1995. Controlling the false discovery rate: a practical and powerful approach to multiple testing. J Roy Stat Soc Ser B. 57:289–300. [Google Scholar]
- Blau V, Reithler J, van Atteveldt N, Seitz J, Gerretsen P, Goebel R, Blomert L. 2010. Deviant processing of letters and speech sounds as proximate cause of reading failure: a functional magnetic resonance imaging study of dyslexic children. Brain. 133:868–879. [DOI] [PubMed] [Google Scholar]
- Brambati SM, Termine C, Ruffino M, Stella G, Fazio F, Cappa SF, Perani D. 2004. Regional reductions of gray matter volume in familial dyslexia. Neurology. 63:742–745. [DOI] [PubMed] [Google Scholar]
- Breier JI, Simos PG, Fletcher JM, Castillo EM, Zhang W, Papanicolaou AC. 2003. Abnormal activation of temporoparietal language areas during phonetic analysis in children with dyslexia. Neuropsychology. 17:610–621. [DOI] [PubMed] [Google Scholar]
- Chi JG, Dooling EC, Gilles FH. 1977. Gyral development of the human brain. Ann Neurol. 1:86–93. [DOI] [PubMed] [Google Scholar]
- Cope N, Eicher JD, Meng H, Gibson CJ, Hager K, Lacadie C, Fulbright RK, Constable RT, Page GP, Gruen JR. 2012. Variants in the DYX2 locus are associated with altered brain activation in reading-related brain regions in subjects with reading disability. Neuroimage. 63:148–156. [DOI] [PMC free article] [PubMed] [Google Scholar]
- Dale AM, Fischl B, Sereno MI. 1999. Cortical surface-based analysis. I. Segmentation and surface reconstruction. Neuroimage. 9:179–194. [DOI] [PubMed] [Google Scholar]
- Darki F, Peyrard-Janvid M, Matsson H, Kere J, Klingberg T. 2012. Three dyslexia susceptibility genes, DYX1C1, DCDC2, and KIAA0319, affect temporo-parietal white matter structure. Biol Psychiatry. 72:671–676. [DOI] [PubMed] [Google Scholar]
- Denney MK, English JP, Gerber M, Leafstedt J, Rutz M. 2001. Family and home literacy practices: mediating factors for preliterate English learners at risk. Paper Presented at the Annual Meeting of the American Educational Research Associations, Seattle, WA. [Google Scholar]
- Desikan RS, Segonne F, Fischl B, Quinn BT, Dickerson BC, Blacker D, Buckner RL, Dale AM, Maguire RP, Hyman BT, et al. 2006. An automated labeling system for subdividing the human cerebral cortex on MRI scans into gyral based regions of interest. Neuroimage. 31:968–980. [DOI] [PubMed] [Google Scholar]
- Eckert MA, Leonard CM, Wilke M, Eckert M, Richards T, Richards A, Berninger V. 2005. Anatomical signatures of dyslexia in children: unique information from manual and voxel based morphometry brain measures. Cortex. 41:304–315. [DOI] [PubMed] [Google Scholar]
- Fischl B, Rajendran N, Busa E, Augustinack J, Hinds O, Yeo BT, Mohlberg H, Amunts K, Zilles K. 2008. Cortical folding patterns and predicting cytoarchitecture. Cereb Cortex. 18:1973–1980. [DOI] [PMC free article] [PubMed] [Google Scholar]
- Fischl B, Sereno MI, Dale AM. 1999. Cortical surface-based analysis. II: inflation, flattening, and a surface-based coordinate system. Neuroimage. 9:195–207. [DOI] [PubMed] [Google Scholar]
- Fischl B, van der Kouwe A, Destrieux C, Halgren E, Segonne F, Salat DH, Busa E, Seidman LJ, Goldstein J, Kennedy D, et al. 2004. Automatically parcellating the human cerebral cortex. Cereb Cortex. 14:11–22. [DOI] [PubMed] [Google Scholar]
- Galaburda AM, LoTurco J, Ramus F, Fitch RH, Rosen GD. 2006. From genes to behavior in developmental dyslexia. Nat Neurosci. 9:1213–1217. [DOI] [PubMed] [Google Scholar]
- Galaburda AM, Sherman GF, Rosen GD, Aboitiz F, Geschwind N. 1985. Developmental dyslexia: four consecutive patients with cortical anomalies. Ann Neurol. 18:222–233. [DOI] [PubMed] [Google Scholar]
- Garel C, Chantrel E, Brisse H, Elmaleh M, Luton D, Oury JF, Sebag G, Hassan M. 2001. Fetal cerebral cortex: normal gestational landmarks identified using prenatal MR imaging. AJNR Am J Neuroradiol. 22:184–189. [PMC free article] [PubMed] [Google Scholar]
- Genovese CR, Lazar NA, Nichols T. 2002. Thresholding of statistical maps in functional neuroimaging using the false discovery rate. Neuroimage. 15:870–878. [DOI] [PubMed] [Google Scholar]
- Grigorenko EL. 2009. At the height of fashion: what genetics can teach us about neurodevelopmental disabilities. Curr Opin Neurol. 22:126–130. [DOI] [PMC free article] [PubMed] [Google Scholar]
- Hiemenz JR, Hynd GW. 2000. Sulcal/gyral pattern morphology of the perisylvian language region in developmental dyslexia. Brain Lang. 74:113–133. [DOI] [PubMed] [Google Scholar]
- Hoeft F, Hernandez A, McMillon G, Taylor-Hill H, Martindale JL, Meyler A, Keller TA, Siok WT, Deutsch GK, Just MA, et al. 2006. Neural basis of dyslexia: a comparison between dyslexic and nondyslexic children equated for reading ability. J Neurosci. 26:10700–10708. [DOI] [PMC free article] [PubMed] [Google Scholar]
- Hoeft F, Meyler A, Hernandez A, Juel C, Taylor-Hill H, Martindale JL, McMillon G, Kolchugina G, Black JM, Faizi A, et al. 2007. Functional and morphometric brain dissociation between dyslexia and reading ability. Proc Natl Acad Sci USA. 104:4234–4239. [DOI] [PMC free article] [PubMed] [Google Scholar]
- Im K, Choi YY, Yang JJ, Lee KH, Kim SI, Grant PE, Lee JM. 2011. The relationship between the presence of sulcal pits and intelligence in human brains. Neuroimage. 55:1490–1496. [DOI] [PubMed] [Google Scholar]
- Im K, Jo HJ, Mangin JF, Evans AC, Kim SI, Lee JM. 2010. Spatial distribution of deep sulcal landmarks and hemispherical asymmetry on the cortical surface. Cereb Cortex. 20:602–611. [DOI] [PubMed] [Google Scholar]
- Im K, Lee JM, Jeon S, Kim JH, Seo SW, Na DL, Grant PE. 2013. Reliable identification of deep sulcal pits: the effects of scan session, scanner, and surface extraction tool. PLoS ONE. 8:e53678. [DOI] [PMC free article] [PubMed] [Google Scholar]
- Im K, Pienaar R, Lee JM, Seong JK, Choi YY, Lee KH, Grant PE. 2011. Quantitative comparison and analysis of sulcal patterns using sulcal graph matching: A twin study. Neuroimage. 57:1077–1086. [DOI] [PubMed] [Google Scholar]
- Im K, Pienaar R, Paldino MJ, Gaab N, Galaburda AM, Grant PE. 2013. Quantification and discrimination of abnormal sulcal patterns in polymicrogyria. Cereb Cortex. 23:3007–3015. [DOI] [PMC free article] [PubMed] [Google Scholar]
- Katzir T, Lesaux NK, Kim YS. 2009. The role of reading self-concept and home literacy practices in fourth grade reading comprehension. Read Writ. 22:261–276. [Google Scholar]
- Kaufmann AS, Kaufmann NL. 1997. KBIT-2: Kaufman Brief Intelligence Test. 2nd ed Minneapolis, MN: NCS Pearson, Inc. [Google Scholar]
- Klyachko VA, Stevens CF. 2003. Connectivity optimization and the positioning of cortical areas. Proc Natl Acad Sci USA. 100:7937–7941. [DOI] [PMC free article] [PubMed] [Google Scholar]
- Kostovic I, Vasung L. 2009. Insights from in vitro fetal magnetic resonance imaging of cerebral development. Semin Perinatol. 33:220–233. [DOI] [PubMed] [Google Scholar]
- Kronbichler M, Hutzler F, Staffen W, Mair A, Ladurner G, Wimmer H. 2006. Evidence for a dysfunction of left posterior reading areas in German dyslexic readers. Neuropsychologia. 44:1822–1832. [DOI] [PubMed] [Google Scholar]
- Kronbichler M, Wimmer H, Staffen W, Hutzler F, Mair A, Ladurner G. 2008. Developmental dyslexia: gray matter abnormalities in the occipitotemporal cortex. Hum Brain Mapp. 29:613–625. [DOI] [PMC free article] [PubMed] [Google Scholar]
- Leingartner A, Thuret S, Kroll TT, Chou SJ, Leasure JL, Gage FH, O'Leary DD. 2007. Cortical area size dictates performance at modality-specific behaviors. Proc Natl Acad Sci USA. 104:4153–4158. [DOI] [PMC free article] [PubMed] [Google Scholar]
- Leonard CM, Voeller KK, Lombardino LJ, Morris MK, Hynd GW, Alexander AW, Andersen HG, Garofalakis M, Honeyman JC, Mao J, et al. 1993. Anomalous cerebral structure in dyslexia revealed with magnetic resonance imaging. Arch Neurol. 50:461–469. [DOI] [PubMed] [Google Scholar]
- Leordeanu M, Hebert M. 2005. A spectral technique for correspondence problems using pairwise constraints. ICCV ‘05: Proceedings of the Tenth IEEE International Conference on Computer Vision IEEE Computer Society, Washington, DC, USA: p. 1482–1489. [Google Scholar]
- Lerch JP, Evans AC. 2005. Cortical thickness analysis examined through power analysis and a population simulation. Neuroimage. 24:163–173. [DOI] [PubMed] [Google Scholar]
- Linkersdorfer J, Lonnemann J, Lindberg S, Hasselhorn M, Fiebach CJ. 2012. Grey matter alterations co-localize with functional abnormalities in developmental dyslexia: an ALE meta-analysis. PLoS ONE. 7:e43122. [DOI] [PMC free article] [PubMed] [Google Scholar]
- Lohmann G, von Cramon DY, Colchester AC. 2008. Deep sulcal landmarks provide an organizing framework for human cortical folding. Cereb Cortex. 18:1415–1420. [DOI] [PubMed] [Google Scholar]
- Marino C, Scifo P, Della Rosa PA, Mascheretti S, Facoetti A, Lorusso ML, Giorda R, Consonni M, Falini A, Molteni M, et al. 2014. The DCDC2/intron 2 deletion and white matter disorganization: focus on developmental dyslexia. Cortex. 57:227–243. [DOI] [PMC free article] [PubMed] [Google Scholar]
- Mather N, Hammill DD, Allen EA. 2004. TOSWRF: Test of silent word reading fluency: Examiner's manual. Austin, TX: PRO-ED, Inc. [Google Scholar]
- Meng H, Smith SD, Hager K, Held M, Liu J, Olson RK, Pennington BF, DeFries JC, Gelernter J, O'Reilly-Pol T, et al. 2005. DCDC2 is associated with reading disability and modulates neuronal development in the brain. Proc Natl Acad Sci USA. 102:17053–17058. [DOI] [PMC free article] [PubMed] [Google Scholar]
- Meng Y, Li G, Lin W, Gilmore JH, Shen D. 2014. Spatial distribution and longitudinal development of deep cortical sulcal landmarks in infants. Neuroimage. 100:206–218. [DOI] [PMC free article] [PubMed] [Google Scholar]
- O'Leary DD, Chou SJ, Sahara S. 2007. Area patterning of the mammalian cortex. Neuron. 56:252–269. [DOI] [PubMed] [Google Scholar]
- Paracchini S, Thomas A, Castro S, Lai C, Paramasivam M, Wang Y, Keating BJ, Taylor JM, Hacking DF, Scerri T, et al. 2006. The chromosome 6p22 haplotype associated with dyslexia reduces the expression of KIAA0319, a novel gene involved in neuronal migration. Hum Mol Genet. 15:1659–1666. [DOI] [PubMed] [Google Scholar]
- Peterson RL, Pennington BF. 2012. Developmental dyslexia. Lancet. 379:1997–2007. [DOI] [PMC free article] [PubMed] [Google Scholar]
- Pugh KR, Landi N, Preston JL, Mencl WE, Austin AC, Sibley D, Fulbright RK, Seidenberg MS, Grigorenko EL, Constable RT, et al. 2013. The relationship between phonological and auditory processing and brain organization in beginning readers. Brain Lang. 125:173–183. [DOI] [PMC free article] [PubMed] [Google Scholar]
- Rakic P. 2009. Evolution of the neocortex: a perspective from developmental biology. Nat Rev Neurosci. 10:724–735. [DOI] [PMC free article] [PubMed] [Google Scholar]
- Rakic P. 2004. Neuroscience. Genetic control of cortical convolutions. Science. 303:1983–1984. [DOI] [PubMed] [Google Scholar]
- Rakic P. 1988. Specification of cerebral cortical areas. Science. 241:170–176. [DOI] [PubMed] [Google Scholar]
- Raschle N, Zuk J, Ortiz-Mantilla S, Sliva DD, Franceschi A, Grant PE, Benasich AA, Gaab N. 2012. Pediatric neuroimaging in early childhood and infancy: challenges and practical guidelines. Ann N Y Acad Sci. 1252:43–50. [DOI] [PMC free article] [PubMed] [Google Scholar]
- Raschle NM, Chang M, Gaab N. 2011. Structural brain alterations associated with dyslexia predate reading onset. Neuroimage. 57:742–749. [DOI] [PMC free article] [PubMed] [Google Scholar]
- Raschle NM, Lee M, Buechler R, Christodoulou JA, Chang M, Vakil M, Stering PL, Gaab N. 2009. Making MR imaging child's play—Pediatric neuroimaging protocol, guidelines and procedure. J Vis Exp. 29:e1309. [DOI] [PMC free article] [PubMed] [Google Scholar]
- Raschle NM, Zuk J, Gaab N. 2012. Functional characteristics of developmental dyslexia in left-hemispheric posterior brain regions predate reading onset. Proc Natl Acad Sci USA. 109:2156–2161. [DOI] [PMC free article] [PubMed] [Google Scholar]
- Regis J, Mangin JF, Ochiai T, Frouin V, Riviere D, Cachia A, Tamura M, Samson Y. 2005. “Sulcal root” generic model: A hypothesis to overcome the variability of the human cortex folding patterns. Neurol Med Chir. 45:1–17. [DOI] [PubMed] [Google Scholar]
- Richlan F, Kronbichler M, Wimmer H. 2009. Functional abnormalities in the dyslexic brain: a quantitative meta-analysis of neuroimaging studies. Hum Brain Mapp. 30:3299–3308. [DOI] [PMC free article] [PubMed] [Google Scholar]
- Richlan F, Kronbichler M, Wimmer H. 2011. Meta-analyzing brain dysfunctions in dyslexic children and adults. Neuroimage. 56:1735–1742. [DOI] [PubMed] [Google Scholar]
- Richlan F, Kronbichler M, Wimmer H. 2013. Structural abnormalities in the dyslexic brain: a meta-analysis of voxel-based morphometry studies. Hum Brain Mapp. 34:3055–3065. [DOI] [PMC free article] [PubMed] [Google Scholar]
- Rimrodt SL, Peterson DJ, Denckla MB, Kaufmann WE, Cutting LE. 2010. White matter microstructural differences linked to left perisylvian language network in children with dyslexia. Cortex. 46:739–749. [DOI] [PMC free article] [PubMed] [Google Scholar]
- Rosen GD, Bai J, Wang Y, Fiondella CG, Threlkeld SW, LoTurco JJ, Galaburda AM. 2007. Disruption of neuronal migration by RNAi of Dyx1c1 results in neocortical and hippocampal malformations. Cereb Cortex. 17:2562–2572. [DOI] [PMC free article] [PubMed] [Google Scholar]
- Schlaggar BL, McCandliss BD. 2007. Development of neural systems for reading. Ann Rev Neurosci. 30:475–503. [DOI] [PubMed] [Google Scholar]
- Semel E, Wiig EH, Secord W. 1986. The Clinical Evaluation of Language Fundamentals—Revised. New York: The Psychological Corporation. [Google Scholar]
- Shaw P, Kabani NJ, Lerch JP, Eckstrand K, Lenroot R, Gogtay N, Greenstein D, Clasen L, Evans A, Rapoport JL, et al. 2008. Neurodevelopmental trajectories of the human cerebral cortex. J Neurosci. 28:3586–3594. [DOI] [PMC free article] [PubMed] [Google Scholar]
- Snowling MJ, Muter V, Carroll J. 2007. Children at family risk of dyslexia: a follow-up in early adolescence. J Child Psychol Psychiatry. 48:609–618. [DOI] [PubMed] [Google Scholar]
- Steinmetz H, Ebeling U, Huang YX, Kahn T. 1990. Sulcus topography of the parietal opercular region: an anatomic and MR study. Brain Lang. 38:515–533. [DOI] [PubMed] [Google Scholar]
- Torgesen JK, Wagner RK, Rashotte CA. 1999. TOWRE, Test of Word Reading Efficiency: Examiner's Manual. Austin, TX: PRO-ED, Inc. [Google Scholar]
- Vandermosten M, Boets B, Poelmans H, Sunaert S, Wouters J, Ghesquiere P. 2012. A tractography study in dyslexia: neuroanatomic correlates of orthographic, phonological and speech processing. Brain. 135:935–948. [DOI] [PubMed] [Google Scholar]
- Van Essen DC. 1997. A tension-based theory of morphogenesis and compact wiring in the central nervous system. Nature. 385:313–318. [DOI] [PubMed] [Google Scholar]
- Wagner RK, Torgesen JK, Rashotte CA. 1999. The Comprehensive Test of Phonological Processing. Austin, TX: PRO-ED, Inc. [Google Scholar]
- Wandell BA, Yeatman JD. 2013. Biological development of reading circuits. Curr Opin Neurobiol. 23:261–268. [DOI] [PMC free article] [PubMed] [Google Scholar]
- Wang Y, Paramasivam M, Thomas A, Bai J, Kaminen-Ahola N, Kere J, Voskuil J, Rosen GD, Galaburda AM, Loturco JJ. 2006. DYX1C1 functions in neuronal migration in developing neocortex. Neuroscience. 143:515–522. [DOI] [PubMed] [Google Scholar]
- Wechsler D. 2003. Wechsler Intelligence Scale for Children-WISC-IV. San Antonio, TX: Psychological Corporation. [Google Scholar]
- Welker W. 1990. Why does cerebral cortex fissure and fold? A review of determinants of gyri and sulci. In: Jones EG, Pertes A, editors. Cerebral cortex. Vol. 8B New York: Plenum; p. 3–136. [Google Scholar]
- White T, Su S, Schmidt M, Kao CY, Sapiro G. 2010. The development of gyrification in childhood and adolescence. Brain Cogn. 72:36–45. [DOI] [PMC free article] [PubMed] [Google Scholar]
- Wolf M, Denckla MB. 2005. RAN/RAS: Rapid Automatized Naming and Rapid Alternating. Austin, TX: PRO-ED, Inc. [Google Scholar]
- Woodcock RW. 1998. Woodcock Reading Mastery Tests—Revised. Minneapolis, MN: NCS Pearson, Inc. [Google Scholar]
Associated Data
This section collects any data citations, data availability statements, or supplementary materials included in this article.