

Abstract
Substance use disorder is characterized by a transition from volitional to compulsive responding for drug reward. A possible explanation for this transition may be that alcohol-dependent patients (ADP) show a general propensity for a history of rewarded instrumental responses, and these rewarded responses may boost the activation of motivational neurocircuitry for additional reward. Brain imaging studies of decision-making have demonstrated that ADP relative to controls (CON) often show altered neural activation in response to anticipating and receiving rewards, but the majority of studies have not investigated how past performance affects activation. A potential exists for ADP to show increased sensitivity to reward as a function of reward delivery history. In the current study, we used functional magnetic resonance imaging to investigate the neural correlates of risky decision-making in ADP (n = 18) and CON (n = 18) while they played a two-choice monetary risk-taking game. In addition to investigating general neural recruitment by risky decision-making, we also modeled each participant’s running total of monetary earnings in order to determine areas of activation that correlated with cumulative reward. We found that ADP and CON showed few differences in behavior or in mesolimbic activation by choice for, and receipt of, risky gains. However, when including a cumulative-earnings covariate, ADP exhibited heightened striatal activation that correlated with total earnings during the choice event in the task. The heightened contextual sensitivity of striatal responses to cumulative earnings in ADP may represent a general neurobiological affective substrate for development of automatized instrumental behavior.
Keywords: Alcoholism, reward, ventral striatum
INTRODUCTION
Motivational theories of addiction [reviewed in (Hommer, Bjork & Gilman 2011)] posit that increased impulsivity is a critical dispositional risk factor for experimentation with alcohol and other drug use, and for progression to abuse. With onset of chronic drug use, the brain undergoes a progressive degradation of recruitment of mesolimbic circuitry by non-drug incentives, resulting in a bias toward drug-related stimuli (Robinson & Berridge 1993, 2000). In addition, chronic alcohol intoxication may compound maladaptive decision-making because of neurotoxic effects on the frontal cortex (Bechara & Damasio 2002; Bechara, Dolan & Hindes 2002). Therefore, understanding how non-drug reinforcements influence behavior in alcohol-dependent patients (ADP) has critical implications for understanding the etiology of alcoholism, as well as for incentive-based interventions such as contingency management (Silverman et al. 2001).
Several behavioral studies have demonstrated increased impulsivity among individuals at risk for addiction, as well as in subjects already dependent on alcohol and other substances. For example, children with disruptive behavior disorders such as conduct disorder are at especially high risk for substance use and addiction, and when they play decision-making games, they have shown tendencies to perseverate on reward-linked behavioral responses after the reward contingency has been removed and/or replaced with punishment (Newman & Wallace 1993). When playing the Iowa Gambling Task (IGT), adolescents with conduct disorder chose a greater proportion of disadvantageous choices in pursuit of gains (Hobson, Scott & Rubia 2011). ADP also choose rewards at risk of disproportionately severe penalties (Bechara et al. 2001) similar to subjects with frontal lobe lesions (Bechara et al. 1994).
Neuroimaging studies have revealed potential brain substrates of aberrant general decision-making in at-risk or addicted populations. A variety of brain regions, including the frontal and prefrontal cortices, cingulate, ventral and dorsal striatum and insula are recruited during risk taking in healthy controls (CON) (Mohr, Biele & Heekeren 2010). Functional magnetic resonance (fMRI) studies have compared the sensitivity of these brain circuits between ADP and CON during reward anticipation and receipt (e.g. Wrase et al. 2007; Bjork, Smith & Hommer 2008; Beck et al. 2009; Bjork et al. 2012). In these cross-sectional studies, group-wise differences in task success or behavior have usually been intentionally minimized by the task design in order to avoid a confounding group difference in frustration effects or in aversive stimulus exposure. Brain activation differences in the absence of overt behavioral differences might be interpreted as covert signatures of aberrant affective responses to task stimuli, or in different degrees of efficiency in cognitive processing in service of normal performance.
However, brain activation results across studies have not always been consistent. For example, comparing ADP and CON using variants of the monetary incentive delay (MID) task to examine mesolimbic response to incentives in a non-decision context, some studies reported reduced activation of the ventral striatal reward neurocircuitry by monetary reward anticipation (Wrase et al. 2007; Beck et al. 2009). On the other hand, Bjork et al. (2008) found similar reward anticipation activation between ADP and CON, but increased striatal responses to reward notifications as well as faster responses to task targets in ADP compared with CON. One critical difference between the two findings is that in the task used by Bjork et al., gains are not only framed against potential losses across the task experience, but are also framed against dashed expectations of outcome notifications, whereas in the other tasks (Wrase et al. 2007; Beck et al. 2009), there was no possibility of losing money. Notably, ADP did not show appreciably increased striatal activation by reward notifications in a MID task variant that did not include loss trials (Bjork et al. 2012). ADP also show greater activation of striatum during accumulation of guaranteed reward in a risk-taking task that also included trials with the potential of loss (Bjork et al. 2008). In essence, ADP may show heightened striatal activation only when there is a possibility of loss of gains or endowment (De Martino et al. 2009), resulting in increased motivational salience of gains.
During risk-taking paradigms, ADP not only demonstrate differences in striatal sensitivity, but also in the activity of the frontal cortex (Jentsch & Taylor 1999), a region critical in assessment of risk (Mohr et al. 2010). Current (Kaufman et al. 2003) and abstinent (Li et al. 2006) cocaine users, marijuana users (Gruber & Yurgelun-Todd 2005) and opiate-dependent individuals (Forman et al. 2004) have shown mesofrontal activation deficits during decision-making tasks. They also show blunted frontocortical glucose utilization (Samson et al. 1986; Gilman et al. 1990) and blood flow (Bolla et al. 2003) that correlate with risky choices (Bolla et al. 2003; Fishbein et al. 2005) in decision-making tasks, as well as reduced prefrontal recruitment by a reward/risk conflict (Bjork et al. 2008). These findings show that the frontal regions, as well at striatal regions, that are important in decision-making are impaired in ADP. As these frontal regions are important in valuation (Rolls & Grabenhorst 2008), it is possible that these regions would also be sensitive to whether losses occur in the context of gains.
The majority of neuroimaging studies of risky decision-making, however, typically report the task-wide average of each response type of a task in isolation; in other words, they do not take into account how neural activation in individual trials is affected by performance on past trials. Several studies have demonstrated that striatal recruitment by non-drug rewards is sensitive to how that reward compares with other trial types/amounts in the task (Nieuwenhuis et al. 2005) or accumulated assets (De Martino et al. 2009), and it is possible that activation of other brain regions, such as the prefrontal cortex, is also affected by past performance. A potential exists for ADP not only to possess different absolute reactivity or sensitivity to reward magnitudes considered in isolation, but also to show increased sensitivity to the accumulation of gains and losses. These can occur simultaneously, if both the small isolated rewards and the larger summation reward are obtained at the same time (i.e. the larger reward is not delayed, as with traditional delay discounting paradigms). In particular, in accord with the impulsivity hypothesis of addiction vulnerability, and the observed positive correlation between impulsive personality and striatal response to gains (Bjork et al. 2008, 2012), previous exposure to gains resulting from risky choices may psychologically ‘prime’ mesolimbic circuitry of ADP toward an exaggerated response to subsequent risky reward opportunities.
In the current study, we used fMRI to investigate the neural correlates of risky decision-making in ADP and CON while they played a two-choice monetary risk-taking task (Gilman et al. 2012) modeled after the Lane Risk-Taking Task (Lane & Cherek 2000). Use of a risky-choice task in lieu of a simple MID task afforded (1) the potential for greater responsiveness of insula and other limbic regions (Fiorillo, Tobler & Schultz 2003; Paulus et al. 2003); and (2) an embedded behavioral metric of risk-seeking personality. We have defined risky decision-making using the criterion developed by Lane et al. (2004), in which risk-taking behaviors have the following parameters: (1) a choice is made between two or more options; (2) one of those options has some probability > 0 of producing either a reinforcing or an aversive consequence; and (3) the probability of that aversive consequence is unknown at the time the risky option is chosen. In addition to investigating general neural recruitment by risky decision-making, we also modeled each participant’s running total of monetary earnings in order to determine areas of activation that correlated with cumulative reward. Based on both behavioral data of at-risk individuals (Lane & Cherek 2000, 2001), and on research showing greater striatal activation during ‘framing’ trials (Bjork et al. 2008), we had two main hypotheses: (1) ADP would show greater mesolimbic activation relative to CON by choice for, and receipt of, risky gains generally; and (2) cumulative reward experiences would enhance activation by risky reward events more in ADP compared with CON, such that inclusion of a cumulative-earnings covariate would result in significantly greater residual activation by rewards in ADP. This experiment was designed to minimize group-wise differences in behavior and in overall task success, so that any neural differences would be unconfounded by behavioral differences.
METHODS
Participants
The study included a sample of recently detoxified ADP (n = 18; age 22–40, mean 31.2 ± 7.1; six females) that were undergoing in-patient treatment for alcohol dependence in the National Institute on Alcohol Abuse and Alcoholism treatment research program in Bethesda, MD, USA and a sample of age-matched CON (n = 18; age 25–40, mean 30.5 ± 5.1; six females) recruited from the community. Procedures were approved by the Combined Neuroscience Institutional Review Board of the National Institutes of Health. All participants were right-handed. Participants underwent physical examination and a structured clinical interview for DSM-IV (First et al. 2002) to assess their mental health. Exclusion criteria for all participants were: current use of psychotropic medication, psychosis, craniofacial or soft-sign neurological evidence of fetal alcohol spectrum disorder, chronic medical conditions (e.g. diabetes), history of significant head injury or of neurological disorder. All ADP met the DSM-IV criteria for alcohol dependence and were admitted to the treatment unit based on telephone pre-screen and clinical assessment at intake that alcohol was the subject’s primary drug of abuse. Following admission, any in-patient who exhibited a ‘cocaine crash’ or other evidence that a non-alcohol drug was his or her primary problem was excluded. ADP were scanned after at least 6 days of drug abstinence, but not more than 4 weeks of abstinence, as verified by analyses of urine and breath samples. During this time, patients received cognitive behavioral therapy, but no patients were enrolled in any other pharmacological study. All had completed physiological withdrawal (per the Clinical Institute Withdrawal Assessment) by the time of scanning.
In CON, presence of any Axis I disorder was an exclusion criterion, as was a lifetime history of substance dependence in any first-degree relative. All ADP and CON had an estimated intelligence quotient ≥ 80, determined by block design and vocabulary tests. The term ADP is used to designate patients in this report, but all patients reported some history of use of illicit drugs, and all patients were regular smokers. One CON was a regular smoker. All CON participants also had a negative urine drug screen prior to participation in the study.
Risk-taking task
The task used in this study (Fig. 1), a modified version of the Lane risk-taking task (Lane & Cherek 2000), has been described previously (Gilman et al. 2012). The task was designed to measure brain activation associated with each aspect of the risk-taking process, from selecting between safe and risky options to anticipating and receiving feedback. Briefly, at the beginning of each trial, participants were shown two white squares. One of the squares displayed a question mark beneath it. If the participant chose the square without the question mark (the ‘safe’ square), they were guaranteed to win $0.25. If the participant chose the square with the question mark (the ‘risky’ square), they could win $1.00 or $5.00, but they also risked losing $1.00 or $5.00. Fifty percent of risky squares resulted in wins and 50 percent resulted in losses, but the participants had no knowledge of these probabilities. Wins and losses were pseudorandomized. Prior to scanning, participants were read an instruction script describing the task and performed approximately 10 practice trials.
Figure 1.
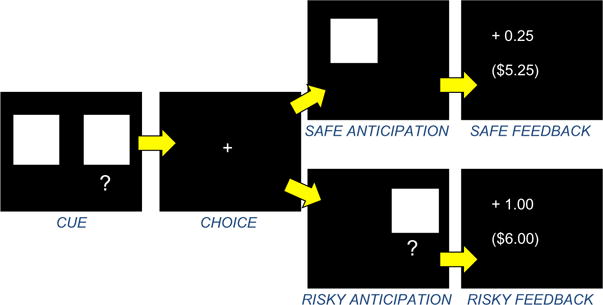
Risk-taking task. Each trial consisted of four events (cue, choice, anticipation and feedback). See Methods section for details
Participants began each run with a $5.00 endowment in order to prevent them from accruing negative earnings early in the run. The first screen presented consisted of two white squares; when looking at this screen, participants were told to think about which square they wanted to choose. After a jittered interval, a cross-hair appeared, and participants registered their choice using a Lumina LSC-400 (Cedrus Corporation, San Pedro, CA, USA) two-button fiber optic button box. After the participant made a choice, the selected square reappeared on the screen. The participants were then given feedback for that trial, which included how much money was won or lost on that trial, as well as cumulative earnings for the run. Each stimulus was presented for 2 seconds. All trial stimuli, as well as the trials themselves, were jittered between 2 and 6 seconds (see Fig. 1). Participants played two 12-minute runs of the game while in the scanner, and the money from both runs was added together for total game earnings. Each run was independent (so that regardless of the earnings of the first run, the second run was reset to a starting point of $5.00). Participants were informed that they would receive all of the money they won.
Psychometric measures
During the screening visit, participants completed the Barratt Impulsiveness Scale (BIS) (Patton, Stanford & Barratt 1995) and the NEO-Five Factor Inventory (Costa & McCrae 1992).
Immediately after the scan, participants completed a 4-point rating scale (‘not at all’, ‘a little’, ‘somewhat’ or ‘very’) of how excited, nervous, or calm they felt when they chose the risky or safe option.
fMRI acquisition
Imaging was performed using a 3T General Electric MRI scanner (General Electric, Milwaukee, WI, USA) and a 16-channel head coil. Functional scans were acquired using a T2*-sensitive echoplanar sequence that measures changes in blood-oxygen-level dependent (BOLD) contrast (371 volumes, repetition time = 2000 milliseconds, echo time = 30 ms, flip angle = 90, matrix = 64 × 64, field of view = 24 cm). We collected 30, 5.0-mm thick interleaved axial slices with no gap drawn from the base of orbitofrontal cortex upward to the top of the brain (in plane resolution 3.75 × 3.75 mm), providing whole-brain coverage. Structural scans were acquired using a T1-weighted magnetization-prepared rapid acquisition gradient echo sequence (repetition time = 100 ms; echo time = 7 ms; flip angle = 90, matrix = 256 × 256, field of view = 22 cm), which facilitated localization and co-registration of functional data.
fMRI analysis
Analyses were conducted using Analysis of Functional Neural Images (AFNI) software (Cox 1996). Echoplanar image volumes were preprocessed in AFNI as follows: (1) Voxel time series were interpolated to correct for non-simultaneous slice acquisition within each volume (using sinc interpolation and the most inferior slice as a reference). (2) Volumes were concatenated across the two runs.(3) Volumes were corrected for head motion in three-dimensional (3D) space. A middle volume collected during the risk-taking task was used as the reference volume. Motion-correction estimates indicated that no participant’s head moved >1.0 mm in any dimension from one volume acquisition to another. Across the entire task, no participant’s head moved >3.0 mm in any dimension. We applied a 6-mm full-width, half-maximum (FWHM) smoothing kernel in the spatial domain. (4) A mask was created so that all the background values outside the brain were set to zero. This allowed for the calculation of percent signal change in each voxel.
The regression model featured seven regressors of interest and six regressors of no interest modeling residual motion (e.g. three translations, three rotations) after volume registration. Regressors of interest included: (1) cue presentation when the participant went on to choose the safe square; (2) cue presentation when the participant went on to choose the risky square; (3) motor response (a proxy for the decision) when the participant chose the safe square (hereafter ‘safe choice’); (4) motor response when the participant chose the risky square (‘risky choice’); (5) safe (+$0.25) feedback; (6) win $1.00 or $5.00 risky feedback; and (7) lose $1.00 or $5.00 risky feedback. For all analyses, $1.00 and $5.00 values were collapsed, as the design lacked power to examine each reward magnitude separately. These were convolved using a gamma-variate function that modeled hemodynamic response time for each individual based on his or her choices. Individual signal-time courses were time-locked to image onset. Statistical maps were generated for each individual separately that consisted of event-related β–coefficient and a t-statistic representing each of the regressors of interest across runs. Linear contrasts of ‘risky versus safe’ were performed for the cue and choice phases. Linear contrasts of feedback were also performed, investigating ‘risky win versus safe’, ‘risky loss versus safe’ and ‘risky win versus risky loss.’
Group-wise and group-difference maps of β–coefficients and t-statistics were spatially normalized by warping to Talairach space and consolidated using AFNI 3dANOVA and 3dttest. When reporting neuroimaging results, a family-wise error rate correction (using a Monte Carlo simulation) was applied to rule out false positives in AFNI AlphaSim. Clusters larger than 80 voxels at a threshold of P < 0.001 (yielding a whole-brain corrected value of P < 0.05 at the cluster level) were considered significant. This minimum cluster size was obtained by (1) creating a common brain mask among all subjects; (2) obtaining spatial correlation (smoothness, or FWHM), and averaging these values across subjects; (3) calculating our connectivity radius as 3.8 mm (slightly larger than the diagonal of a voxel of 3.75 mm); (4) setting an individual voxel threshold P value of P < 0.001; and (5) running Monte Carlo simulations to obtain the cluster-corrected P value of 0.05, which gave us a minimum cluster size of 80 voxels.
To assess the effect of running monetary total on voxel activation, individual signal-time courses that were locked to stimulus onset were modeled with a waveform of the running total of money won for each individual, using amplitude-modulated response model in AFNI’s 3dDeconvolve. Amplitude modulation is used to find active voxels whose activation level also depends on other task information (i.e. running total of cumulative earnings). Two separate regressors were made modeling each event: one to find the mean trial-type-wise fMRI response (to reflect a standard type of analysis) and one to find the variations in the fMRI response as the running total data varied. Response (β) for first regressor produced a standard activation map; statistics and β for second regressor produced an activation map of locations whose BOLD response changed with changes in running total. Using two regressors allows separation of voxels that are active but were not detectably modulated by the running total from voxels that were sensitive to running total (please see http://afni.nimh.nih.gov/pub/dist/doc/misc/Decon/AMregression.pdf for details).
Statistical maps were generated for each individual separately that consisted of event-related β–coefficient and a t-statistic representing how voxel activation varies proportionately to the running total winnings at each time point. Using this technique, we could assess how total winnings during each trial of the risk-taking task influenced BOLD response to each event in the trial. Clusters larger than 80 voxels at a threshold of P < 0.001 (yielding a whole-brain corrected value of P < 0.05) were considered significant. All results are reported in Montreal Neurological Institute coordinates.
Analysis of behavioral data
A two-way repeated-measure ANOVA was run using Graphpad Prism Version 5. The independent variable was group (CON and ADP), and the dependent variable was choice (risky and safe); we also tested for an interaction between group and choice. In order to test whether a subsequent choice was affected by the previous outcome of a risky trial, we calculated the percentage of risky and safe choices after a ‘win’ and after a ‘loss’ for each participant. Values from these four categories (loss, then safe; loss, then risky; win, then safe; win, then risky) were entered into a one-way ANOVA to test for differences across categories.
RESULTS
Participant demographics
CON and ADP were not significantly different in age or gender, but differed significantly in impulsivity and personality measures (see Table 1 for values).
Table 1.
Participant characteristics.
| CON | ADP | |
|---|---|---|
| Gender | 12 M/6 F | 12 M/6 F |
| Age | 30.50 (5.06) | 30.67 (7.10) |
| Neuroticism | 48.18 (8.97)* | 57.14 (8.65) |
| Extroversion | 54.29 (11.57) | 53.43 (10.35) |
| Openness | 57.53 (7.74)* | 49.36 (8.02) |
| Agreeableness | 46.53 (12.39) | 41.64 (13.30) |
| Conscientiousness | 50.41 (10.68)** | 32.93 (14.57) |
| BIS-attention | 15.53 (3.54)* | 20.00 (4.00) |
| BIS-motor | 22.94 (2.82)* | 27.28 (4.36) |
| BIS-non-planning | 22.65 (3.59)** | 31.44 (4.88) |
| BIS-total | 57.72 (15.69)** | 78.72 (10.62) |
| Mood disorders (%) | 0 | 39% |
| Anxiety disorders (%) | 0 | 44% |
| Average drinks per drinking day | 2.48 (2.18)** | 13.89 (10.15) |
Values are means, standard deviations are in parenthesis. ADP = alcohol-dependent patients; BIS = Barratt impulsiveness scale; CON = controls; F = female; M = male. Neuroticism, Extroversion, Openness, Agreeableness and Conscientiousness were measured from the NEO-Five Factor Inventory (Costa & McCrae 1992). (Patton et al. 1995).
P < 0.05 and
P < 0.001.
Behavioral results
There were no significant differences between groups in the number of safe or risky choices (Fig. 2). In cases where participants made a risky choice, we also examined how the outcome of that trial (whether they won or lost money) influenced the behavior on the subsequent trial. We found that, after a loss, both groups were significantly more likely to make a risky than a safe choice (F = 46.97, P < 0.0001 across all participants). After a win, both groups were equally likely to make a risky or a safe choice (Supporting Information Fig. S1). CON won an average of $26.06, and ADP won an average of $24.73 (P = ns). On a 4-point scale asking participants how they felt (excited, nervous, calm) after making either a safe or a risky choice, there were no significant differences between groups in ratings. Neither group reported any specific strategy that they used during the task.
Figure 2.
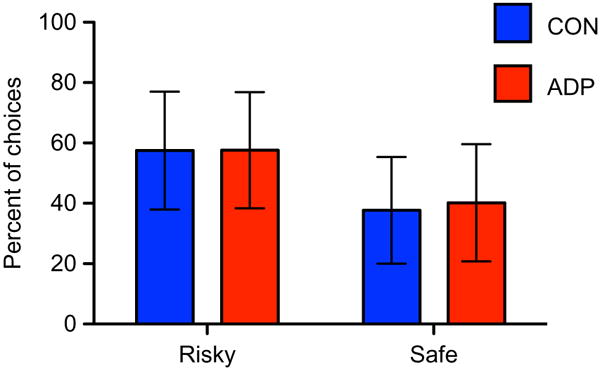
Percentage of risky and safe choices. There were no significant differences in the percentage of safe versus risky choices within either group and no differences between groups in the number of safe or risky choices.
Neuroimaging results
CON and ADP scans were analyzed separately in order to reveal brain activation in each group; they were then contrasted using t-tests of the β-coefficients of the regressors of interest. For each event (cue, choice, anticipation and feedback), we also examined modulation by cumulative total earnings (see Methods section).
The cue phase
As we instructed participants to think about which option they would choose when they saw the cue, we analyzed the cue phase separately when the participants went on to choose risky (cue-risky) and when they went on to choose safe (cue-safe). There was a significant between-group interaction to cue-risky versus cue-safe trials in the left superior frontal gyrus, with CON showing greater activation than ADP (Table 2; Fig. 3). Within-group contrasts for cue-risky versus cue-safe trials revealed greater activation in CON to cue-risky versus cue-safe trials in the middle frontal gyrus, the bilateral cuneus and several occipital regions; however, in ADP, no regions exhibited differential activation between subsequent risky and safe choices (Supporting Information Table S1).
Table 2.
Task-elicited differences in activation between groups.
| Region | x | y | z | t stat | VOL |
|---|---|---|---|---|---|
| Cue: risky > safe | |||||
| CON > ADP | |||||
| Left superior frontal gyrus | −33 | 56 | 27 | 6.45 | 504 |
| Choice: risky > safe | |||||
| No significant between-group differences detected | |||||
| Feedback: win > safe | |||||
| No significant between-group differences detected | |||||
| Feedback: lose > safe | |||||
| CON > ADP | |||||
| Right superior frontal gyrus | 21 | 10 | 70 | 4.72 | 328 |
| Right middle frontal gyrus | 41 | 41 | 39 | 4.39 | 248 |
Activations reported are maxima of clusters with volumes sufficient to survive a family-wise type I error correction of P < 0.05 using Monte Carlo simulation. VOL = size of the cluster in mm3.
Figure 3.
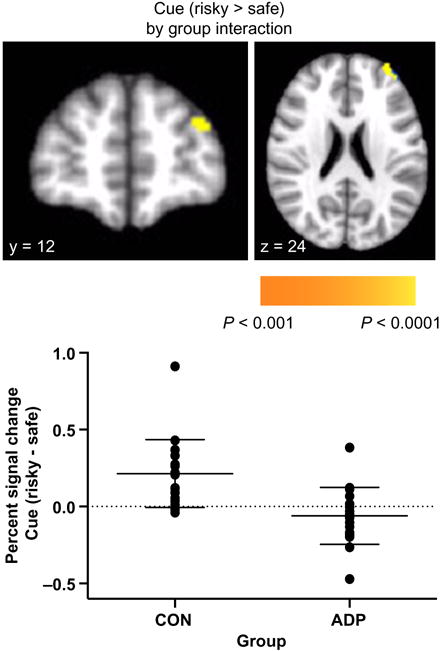
Interaction between group and activation to cue phase when followed by risky compared with safe choices in the left superior frontal gyrus. Top: statistical map of interaction is overlaid on a standard Montreal Neurological Institute-151 image. Bottom: percent signal changes in CON and ADP participants indicate that while CON demonstrated increased activation to cues followed by risky compared with safe options, ADP did not show significant differences
Addition of the cumulative-earnings regressor did not appreciably change responses to cue-elicited activation.
The decision/response (choice) phase
During the choice phase (when the participants pressed the button to indicate a safe or risky option), both groups demonstrated widespread activation throughout frontal, parietal, temporal and occipital regions (Fig. 4a). There was no significant group difference in either the chose-safe partial correlation or in the chose-risky partial correlation (Table 2). The linear contrast of risky versus safe choice also did not elicit any significant activation in either group (Supporting Information Table S2).
Figure 4.
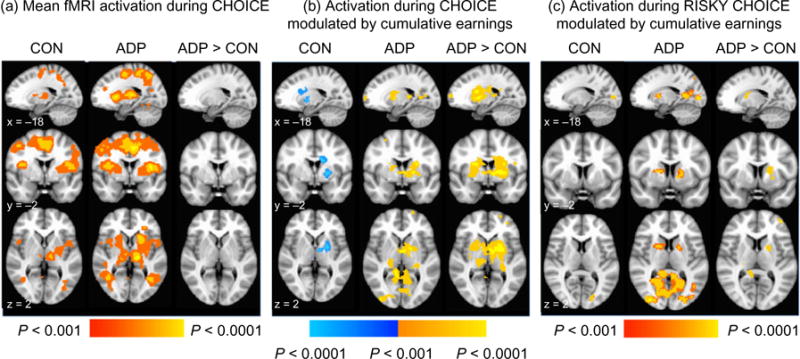
fMRI activation during the choice phase (i.e. motor response); (a) mean activation when making a selection averaged throughout all choices, (b) activation to making a choice which was modulated by cumulative earnings, and (c) activation modulated by cumulative earnings only during the risky choices. Red-yellow indicates positive activation, while blue-light blue indicates negative activation. Statistical maps are overlaid on a standard Montreal Neurological Institute-151 image. All images are thresholded at P < 0.001, only showing clusters > 80 voxels
When we examined modulation of activation by cumulative earnings across all trials, we found a differential effect of the running total between CON and ADP groups. A direct comparison of the groups indicated that the ADP group had significantly greater modulated activation than that of CON in the bilateral caudate, putamen, thalamus and right superior temporal gyrus (Table 3, Fig. 4b). In CON, activation to choice was negatively correlated with earnings (i.e. as monetary earnings went down, activation went up) in the left caudate, putamen and insula (Supporting Information Table S2, Fig. 4b). In ADP, activation to choice was positively correlated with earnings (i.e. as monetary earnings went up, activation went up) in the same region of the left caudate and putamen, as well as in the posterior cingulate and occipital gyrus.
Table 3.
Differences in activation between groups in modulation by earnings.
| Region | x | y | z | t stat | VOL |
|---|---|---|---|---|---|
| Cue phase: no clusters detected | |||||
| Choice phase: | |||||
| All choice modulated by earnings: ADP > CON | |||||
| Right superior temporal gyrus | 35 | −55 | 28 | 6.37 | 1360 |
| Left caudate/putamen/thalamus | −9 | −3 | 0 | 6.30 | 11 240 |
| Right caudate/putamen/thalamus | 21 | −13 | 20 | 6.33 | 5320 |
| Safe choice modulated by earnings: ADP > CON | |||||
| No differences detected | |||||
| Risky choice modulated by earnings: ADP > CON | |||||
| Left middle frontal gyrus | −41 | 29 | 42 | 4.26 | 312 |
| Right precuneus | 29 | −67 | 42 | 5.37 | 1112 |
| Right posterior cingulate | 7 | −45 | 10 | 4.24 | 288 |
| Right thalamus | 23 | −19 | 18 | 4.38 | 552 |
| Left putamen | −23 | 1 | 18 | 3.92 | 424 |
| Left putamen | −23 | 11 | 0 | 4.13 | 272 |
| Feedback phase: | |||||
| All feedback modulated by earnings: CON > ADP | |||||
| Left cingulate | −21 | −9 | 34 | 5.60 | 480 |
Activations reported are maxima of clusters with volumes sufficient to survive a family-wise type I error correction of P < 0.05 using Monte Carlo simulation. VOL = size of the cluster in mm3.
Differences between groups in running total modulation of choice-elicited activation were driven by earnings-context effects during risky trials. This modulation to risky choice was significantly greater in ADP than CON in the putamen, thalamus, middle frontal gyrus, precuneus and posterior cingulate (Table 3). When we modeled safe and risky trials separately, we found that activation to safe choice did not show any modulation by total earnings in ADP. Activation to risky choice, in contrast, was modulated by earnings throughout the left globus pallidus, putamen, parietal lobule and middle occipital gyrus (Supporting Information Table S2, Fig. 4c).
The feedback phase
We analyzed feedback activation by risky wins and by risky losses separately. First, activation in response to notification of wins ($1.00 or $5.00) was contrasted with safe feedback (when the participant received a guaranteed $0.25). Second, notification of losses (−$1.00 or −$5.00) was also contrasted with safe feedback (again of receiving a guaranteed $0.25). There were no group differences in activation to ‘win versus safe.’ Both groups showed widespread and robust activation bilaterally throughout the entire caudate, putamen, nucleus accumbens and thalamus, as well as in frontal brain regions in both groups (Supporting Information Table S3, Fig. 4). There was significantly greater activation to the ‘loss versus safe’ contrast in the CON than the ADP in the right superior and middle frontal gyrus (Table 2). Both groups showed activation in the bilateral insula, right cingulate and left thalamus during loss notification in both groups (Supporting Information Table S4). Finally, when we directly contrasted risky wins versus risky losses, we observed activation bilaterally in the nucleus accumbens in both groups (Supporting Information Table S3, Fig. 5); there were no differences between groups.
Figure 5.
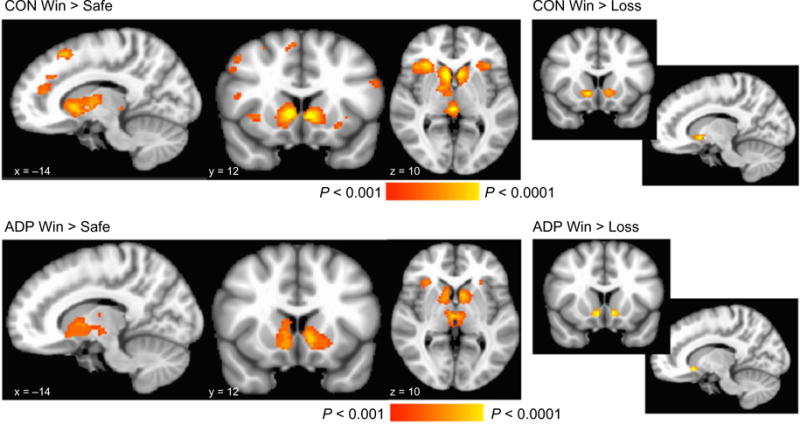
Main effects of feedback notification irrespective of cumulative earnings; left, linear contrast between ‘win’ and ‘safe’ feedback in each group; right, linear contrast between ‘win’ and ‘loss’ feedback in each group. Statistical maps are overlaid on a standard Montreal Neurological Institute-151 image. All images are thresholded at P < 0.001, only showing clusters > 80 voxels
CON showed greater modulation by earnings to feedback than ADP in the left cingulate (Table 3), but activation to receiving all feedback (regardless of their nature) positively correlated with cumulative earnings in both groups (Supporting Information Table S4). This modulation was predominantly driven by activation to risky, not safe, outcomes. In both groups, safe feedback correlated with earnings only in occipital areas, whereas all risky feedback (gains and losses) correlated with earnings in several frontal, temporal and parietal regions. In ADP only, earnings correlated with activation to risky feedback throughout the left putamen and caudate (Supporting Information Table S4).
Based on the robust modulation of all risky feedback by cumulative earnings, we modeled risky wins and risky losses separately in order to investigate which event was predominantly driving modulation of these regions during the feedback phase. In CON, we did not see any significant modulation to risky wins or risky losses separately. ADP demonstrated modulated activation in the bilateral anterior cingulate and caudate to risky wins; no significant activation to the risky losses was observed (Supporting Information Table S4).
Post hoc analysis of modulated activation and psychometric measures
In a post hoc analysis, we extracted activation from the regions of the caudate, as well as the region in the right superior frontal gyrus, that showed greater earnings-context modulated activation in ADP relative to CON during the choice phase (Fig. 6). Across both groups, there was a significant association between the total BIS score and the value of the correlation between running total during choice in the left caudate (r2 = 0.23, P = 0.004), the right caudate (r2 = 0.18, P = 0.012) and the right superior frontal gyrus (r2 = 0.23, P = 0.004). This activation did not correlate with clinical measures of drinking behavior.
Figure 6.
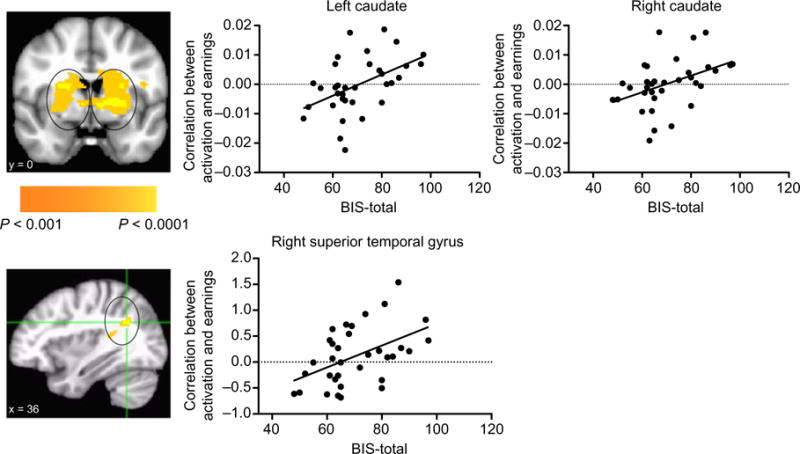
Activation to choice modulated by cumulative earnings is associated with impulsivity. In a post hoc analysis, we extracted activation from regions that showed greater modulated activation in ADP relative CON during the choice phase (see mask images on left). There was a significant association between the total score on the BIS and the value of the correlation between running total during choice in the left caudate (r2 = 0.23, P = 0.004), right caudate (r2 = 0.18, P = 0.012) and the right superior temporal gyrus (r2 = 0.23, P = 0.004)
DISCUSSION
Examination of the dynamic influence of trial-to-trial changes in net gain/loss is a generally neglected variable in the study of neural processing during decision-making. In the current study, we examined how the cumulative monetary gain or loss at the beginning of each trial influenced brain activation. In summary, we report few differences in behavior or in mesolimbic activation by choice for, and receipt of, risky gains. However, when including a cumulative-earnings covariate, cumulative earnings had a robust impact on neural activation during the choice and feedback phases of the risk-taking task, especially in ADP. Compared with age- and gender-matched CON, ADP exhibited heightened striatal activation that correlated with total earnings during the choice events, particularly during risky choices, suggesting a heightened response to cumulative reward in ADP.
Behavioral findings
The task used in this study, a simple two-choice decision-making task in which participants could choose either a safe or a risky option, did not yield behavioral differences between ADP and CON in either percentage of risky choices or in how risky losses affected subsequent trial behavior. Although self-reported impulsivity measures were higher in ADP (Table 1), ADP also reported significantly higher neuroticism, which may have made them more sensitive to bad outcomes. This effect has been observed in other studies; using a monetary risk game in which participants could accumulate money until a secret time limit was reached, Bjork et al. (2008) found that ADP and CON behaved similarly in high-penalty trials, and that ADP were even more cautious than CON in low-penalty trials. The authors suggest that ADP were less willing to take risks in the by virtue of their greater sensitivity to aversive stimuli (Bjork et al. 2008). Although other studies have reported that ADP make riskier choices (Fein, Klein & Finn 2004; Dom et al. 2006), these studies often use more complex tasks, such as the IGT, where learning may be a factor, and where probabilities of bad outcomes are even more vague. A more crucial difference in task parameters is likely to be whether (as with our task) the participant can choose to avoid all risk [such as the Bjork et al. (2008) task or Balloon Analog Risk Task (Lejuez et al. 2002)] versus tasks where there is no option to avoid all possibility of an aversive trial outcome (IGT).
Neuroimaging findings using standard trial-type-averaged analysis
ADP and CON demonstrated few differences in general mesolimbic and cortical recruitment during the task. During the cue phase, CON exhibited a heightened response when they followed the cue with a risky compared with a safe choice in the middle frontal gyrus, a region that has been shown to activate during processing of ambiguity when people consider risky investments in the context of financial risk taking (Kuhnen & Knutson 2005; Preuschoff, Bossaerts & Quartz 2006). ADP, in contrast, did not show any significant differences between activation by cues as a function of whether they later made risky or safe choices. This suggests reduced engagement of neurocircuitry involved in expected value calculation in ADP.
When data were averaged across all outcome phases irrespective of cumulative earnings, CON and ADP did not show significant differences in activation, contrary to our first hypothesis. In both groups, notification of gains activated a broad network of regions shown to be involved in reward (Haber & Knutson 2010), including the caudate, striatum, thalamus and insula, while notification of losses predominantly activated the anterior insula and middle frontal gyrus, areas shown to be associated with processing losses (Mohr et al. 2010). The comparison between wins and losses yielded significant activation in the bilateral nucleus accumbens, demonstrating that both groups showed the expected neural response to notification of wins. Data from these contrasts demonstrate that activation from this task is consistent with other literature examining risk taking (see Krain et al. 2006 for review). It is possible that this simple choice task did not recruit affective components akin to the more complex and gambling-like imagery of the IGT, allowing for a more ‘cold-cognitive’ task performance strategy or heuristic to compress group differences.
Neuroimaging findings using cumulative-earnings regressor
Although we did not find differences between CON and ADP in the choice or the feedback phases in averaged activation irrespective of cumulative earnings, robust differences emerged when we examined how the cumulative monetary total at the beginning of each trial influenced brain activation during the choice phase. During this phase, CON and ADP demonstrated striatal modulation in opposite directions. In CON, activity in the caudate, putamen and insula increased as earnings decreased, perhaps as a function of increased vigilance after experiencing losses. In ADP, however, activity in these regions increased as earnings increased, particularly during risky choices. This suggests that either the computed value or the hedonic elements of making a risky choice increased as monetary earnings increased in ADP. This is consistent with behavioral evidence that persons at risk for addiction show increased sensitivity of gain experiences to bias toward subsequent risky reward pursuit (Lane & Cherek 2000, 2001). Furthermore, modulation specifically during the risky, but not safe, choices is consistent with previous literature indicating that the striatum processes salient events; an fMRI study found that striatal activation to the receipt of money was more salient when its receipt depended on a active response than when its receipt was independent of the task (passive) (Zink et al. 2004). This modulation during risky choice is also consistent with studies showing that dopamine neurons exhibit a sustained mode of activity during reward uncertainty (maximal when reward probability = 0.5) (Fiorillo et al. 2003). Although this modulation was shown in both CON and ADP, it was significantly greater in ADP, suggesting that their reward circuitry was more sensitive to risky choices when they had accumulated more money. The extent to which the activation in this region increased with increased earnings and correlated with impulsivity measures indicates that this effect may be even more pronounced in impulsive individuals.
The activation-enhancing effect of cumulative earnings on striatal activation in ADP may also provide evidence that ADP, compared with CON, experience less loss aversion. This indifference to loss has been shown previously in ADP, both behaviorally in the IGT (Le Berre et al. 2014), and in blunted limbic responses to potential or experienced losses (e.g. Claus et al. 2013). The anterior insula, which shows appreciable structural connectivity with the ventral striatum (Chikama et al. 1997), has been implicated in processing of pain, loss and other negatively valenced stimuli. Previous studies show that acute alcohol (Anderson et al. 2011) blunts insula responses to errors, and that ADP show reduced insula recruitment in signal detection (e.g. Claus et al. 2013) and risk-taking tasks (Li et al. 2009; Claus & Hutchison 2012; Power, Goodyear & Crockford 2012), where reduced activation correlated with alcoholism severity.
The group difference in the contextual effect of cumulative earnings on risky trial activations also underscored the importance of using a task that did not elicit group-wise differences in actual risky behavior. Such a difference would have differentially powered the context effect between groups. Of course, our findings beg the question of the relevance of activation differences in the absence of behavioral differences; however, we contend that group-wise differences in limbic activation may serve as meaningful covert indicators of affective reactions to trial-wise and cumulative task conditions. Studies examining a variety of cognitive tasks in ADP have shown differences in neural responses despite intact behavior in laboratory tasks [e.g. working memory (Pfefferbaum et al. 2001; Desmond et al. 2003), emotional processing (Gilman, Davis & Hommer 2010) and language processing (Chanraud-Guillermo et al. 2009)]. This striatal reactivity may be a signature of an effective response to cumulative instrumental gains that could bias behavior in more obscure or real-world contexts. Model-fitting of trial-wise response patterns in the IGT indicate that in substance-dependent groups, persistent disadvantageous choices from the severe penalty-laden decks are driven more by motivational sensitivity to recently experienced gains in tandem with motivational indifference to indifference to losses (Yechiam et al. 2005). In real-world settings, rewards from instrumental behavior are generally predictable, such as the high from alcohol or another drug. The observation that in ADP the caudate activation increases with increasing rewards may contribute to their persistence in acquiring reward (e.g. alcohol reward) despite potential punishment. Critically, individual differences framings of the incentive-sensitization hypothesis (Robinson & Berridge 1993) find that more impulsive subjects are more likely to acquire compulsive behavior indifferent to potential punishment, based on differences in dopamine functioning (Dalley et al. 2007; Belin et al. 2008).
Both groups also demonstrated significant modulation to feedback by cumulative earnings. ‘Safe’ feedback (i.e. guaranteed small gains) was modulated in occipital regions in both groups, whereas ‘risky’ feedback was modulated by cumulative earnings throughout frontal, temporal, parietal and occipital regions. In ADP only, activation during receipt of risky feedback was modulated by earnings in a large region of the left putamen and caudate, particularly during receipt of ‘wins’. This suggests that ongoing reward may prime mesolimbic incentive circuitry for additional rewarding events. In sum, earnings-modulated reward outcome activation suggested that both groups were relieved to escape cumulative loss, but the ADP may uniquely maintain an enhanced anticipatory response to gains.
This study demonstrates the importance of taking past performance into account, which is not yet a common practice in neuroimaging studies. Contextual effects on incentive processing may be critical in alcohol-use disorders for two reasons. First, studies of individual differences in drinking motivation show that whereas non-problem drinkers drink for interoceptive and social benefit, problem drinkers more often report drinking to avoid context-elicited negative mood (Woody, Urshel & Alterman 1992; Cooper et al. 1995). It is possible that individual differences in the neural response to rewards in the context of loss are also more prominent in ADP. Second, the addiction process may involve reframing of a ‘rewarding’ behavioral response (alcohol ingestion) into an avoidance response—to avoid the aversive sensations of withdrawal (Koob & Le Moal 2001).
Sensitivity of mesolimbic brain circuits to cumulative earnings may explain some discrepancies in the fMRI literature (i.e. Wrase et al. 2007; Bjork et al. 2008; Beck et al. 2009). Results from this study show that (1) in a risk-taking paradigm that affords complete avoidance of risk, ADP do not take more risks; (2) ADP do not possess differential absolute reactivity or sensitivity to reward magnitudes considered in isolation; and (3) ADP show increased sensitivity in the mesolimbic processing of cumulative gains and losses, especially during the ‘choice’ (decision-making) phase of the task. This increased sensitivity to cumulative gains and losses was detected throughout the caudate, putamen and thalamus regions that receive glutamatergic inputs from the cortex and thalamus, as well as dopaminergic inputs from the ventral midbrain (Haber 1986). This dopaminergic neurotransmission has been implicated in the acquisition and maintenance of alcohol dependence (Robinson & Berridge 1993; Schultz 1997). Our previous work has also demonstrated that this circuitry is also activated by alcohol itself (Gilman et al. 2008). It would therefore be of interest to examine if this circuitry, and its sensitivity to ongoing gains, may be involved in real-life risk-taking behaviors, including excessive alcohol use in individuals at risk for alcohol problems, particularly following acute exposure to alcohol.
Limitations
This preliminary study has several limitations, which should be noted. First, this study had a modest sample size of 18 participants in each group; larger samples are needed in order to replicate this finding. The differences observed between ADP and CON may not have been entirely explained by alcohol dependence; all ADP, but only one CON, was also a regular cigarette smoker, which also may have contributed to differences in neural function. There was considerable variation in length of abstinence from alcohol in ADP, although all patients were detoxified and typically stable, suggesting that observed differences between ADP and CON were likely addictive-risk conferring personality trait effects. There was no counterbalancing on the side of the risky option; when piloting the task, we found that switching the sides of the risky/safe options was confusing to participants. Finally, the cross-sectional design of the study renders it unable to disentangle if the enhanced striatal activation to cumulative gains was a pre-existing risk factor for, or a consequence of, alcohol dependence. Longitudinal studies are needed in order to determine causality. However, this study sets up hypothesis for future studies to test whether the transition from volitional to compulsive responding for drug reward is related to heightened striatal activation to cumulative reward.
Supplementary Material
Figure S1 After a loss, all participants were significantly more likely to make a risky than a safe choice (F = 46.97, P < 0.0001). After a win, both groups were equally likely to make a risky or a safe choice.
Table S1 Within-group activation during ‘cue’ followed by risky or safe choice.
Table S2 Within-group activation during risky or safe ‘choice’.
Table S3 Within-group task-elicited activation to feedback.
Table S4 Within-group activation during ‘feedback’ modulated by earnings.
Footnotes
Authors Contribution
JG, AS, JB, VR, RM, and DW were responsible for the study concept and design. RM, JG, and AS contributed to the development and programming of the task. JG, AS, and JB drafted the manuscript. JB, VR, and RM provided critical revision of the manuscript for intellectual content. JG, AS, JB, VR, and RM critically reviewed content and approved final version for publication.
SUPPORTING INFORMATION
Additional Supporting Information may be found in the online version of this article at the publisher’s web-site.
References
- Anderson BM, Stevens MC, Meda SA, Jordan K, Calhoun VD, Pearlson GD. Functional imaging of cognitive control during acute alcohol intoxication. Alcohol Clin Exp Res. 2011;35:156–165. doi: 10.1111/j.1530-0277.2010.01332.x. [DOI] [PMC free article] [PubMed] [Google Scholar]
- Bechara A, Damasio H. Decision-making and addiction (part I): impaired activation of somatic states in substance dependent individuals when pondering decisions with negative future consequences. Neuropsychologia. 2002;40:1675–1689. doi: 10.1016/s0028-3932(02)00015-5. [DOI] [PubMed] [Google Scholar]
- Bechara A, Damasio AR, Damasio H, Anderson SW. Insensitivity to future consequences following damage to human prefrontal cortex. Cognition. 1994;50:7–15. doi: 10.1016/0010-0277(94)90018-3. [DOI] [PubMed] [Google Scholar]
- Bechara A, Dolan S, Denburg N, Hindes A, Anderson SW, Nathan PE. Decision-making deficits, linked to a dysfunctional ventromedial prefrontal cortex, revealed in alcohol and stimulant abusers. Neuropsychologia. 2001;39:376–389. doi: 10.1016/s0028-3932(00)00136-6. [DOI] [PubMed] [Google Scholar]
- Bechara A, Dolan S, Hindes A. Decision-making and addiction (part II): myopia for the future or hypersensitivity to reward? Neuropsychologia. 2002;40:1690–1705. doi: 10.1016/s0028-3932(02)00016-7. [DOI] [PubMed] [Google Scholar]
- Beck A, Schlagenhauf F, Wustenberg T, Hein J, Kienast T, Kahnt T, Schmack K, Hagele C, Knutson B, Heinz A, Wrase J. Ventral striatal activation during reward anticipation correlates with impulsivity in alcoholics. Biol Psychiatry. 2009;66:734–742. doi: 10.1016/j.biopsych.2009.04.035. [DOI] [PubMed] [Google Scholar]
- Belin D, Mar AC, Dalley JW, Robbins TW, Everitt BJ. High impulsivity predicts the switch to compulsive cocaine-taking. Science. 2008;320:1352–1355. doi: 10.1126/science.1158136. [DOI] [PMC free article] [PubMed] [Google Scholar]
- Bjork JM, Smith AR, Hommer DW. Striatal sensitivity to reward deliveries and omissions in substance dependent patients. Neuroimage. 2008;42:1609–1621. doi: 10.1016/j.neuroimage.2008.06.035. [DOI] [PMC free article] [PubMed] [Google Scholar]
- Bjork JM, Smith AR, Chen G, Hommer DW. Mesolimbic recruitment by nondrug rewards in detoxified alcoholics: effort anticipation, reward anticipation, and reward delivery. Hum Brain Mapp. 2012;33:2174–2188. doi: 10.1002/hbm.21351. [DOI] [PMC free article] [PubMed] [Google Scholar]
- Bolla KI, Eldreth DA, London ED, Kiehl KA, Mouratidis M, Contoreggi C, Matochik JA, Kurian V, Cadet JL, Kimes AS, Funderburk FR, Ernst M. Orbitofrontal cortex dysfunction in abstinent cocaine abusers performing a decision-making task. Neuroimage. 2003;19:1085–1094. doi: 10.1016/s1053-8119(03)00113-7. [DOI] [PMC free article] [PubMed] [Google Scholar]
- Chanraud-Guillermo S, Andoh J, Martelli C, Artiges E, Pallier C, Aubin HJ, Martinot JL, Reynaud M. Imaging of language-related brain regions in detoxified alcoholics. Alcohol Clin Exp Res. 2009;33:977–984. doi: 10.1111/j.1530-0277.2009.00918.x. [DOI] [PubMed] [Google Scholar]
- Chikama M, McFarland NR, Amaral DG, Haber SN. Insular cortical projections to functional regions of the striatum correlate with cortical cytoarchitectonic organization in the primate. J Neurosci. 1997;17:9686–9705. doi: 10.1523/JNEUROSCI.17-24-09686.1997. [DOI] [PMC free article] [PubMed] [Google Scholar]
- Claus ED, Hutchison KE. Neural mechanisms of risk taking and relationships with hazardous drinking. Alcohol Clin Exp Res. 2012;36:932–940. doi: 10.1111/j.1530-0277.2011.01694.x. [DOI] [PubMed] [Google Scholar]
- Claus ED, Feldstein Ewing SW, Filbey FM, Hutchison KE. Behavioral control in alcohol use disorders: relationships with severity. J Stud Alcohol Drugs. 2013;74:141–151. doi: 10.15288/jsad.2013.74.141. [DOI] [PMC free article] [PubMed] [Google Scholar]
- Cooper ML, Frone MR, Russell M, Mudar P. Drinking to regulate positive and negative emotions: a motivational model of alcohol use. J Pers Soc Psychol. 1995;69:990–1005. doi: 10.1037//0022-3514.69.5.990. [DOI] [PubMed] [Google Scholar]
- Costa P, McCrae RR. Professional Manual of the Revised NEO Personality Inventory (NEO PI-R) and NEO Five-Factor Inventory (NEO FFI) Odessa, FL: Psychological Assessment Resources, Inc; 1992. [Google Scholar]
- Cox RW. AFNI: software for analysis and visualization of functional magnetic resonance neuroimages. Comput Biomed Res. 1996;29:162–173. doi: 10.1006/cbmr.1996.0014. [DOI] [PubMed] [Google Scholar]
- Dalley JW, Fryer TD, Brichard L, Robinson ES, Theobald DE, Laane K, Pena Y, Murphy ER, Shah Y, Probst K, Abakumova I, Aigbirhio FI, Richards HK, Hong Y, Baron JC, Everitt BJ, Robbins TW. Nucleus accumbens D2/3 receptors predict trait impulsivity and cocaine reinforcement. Science. 2007;315:1267–1270. doi: 10.1126/science.1137073. [DOI] [PMC free article] [PubMed] [Google Scholar]
- De Martino B, Kumaran D, Holt B, Dolan RJ. The neurobiology of reference-dependent value computation. J Neurosci. 2009;29:3833–3842. doi: 10.1523/JNEUROSCI.4832-08.2009. [DOI] [PMC free article] [PubMed] [Google Scholar]
- Desmond JE, Chen SH, DeRosa E, Pryor MR, Pfefferbaum A, Sullivan EV. Increased frontocerebellar activation in alcoholics during verbal working memory: an fMRI study. Neuroimage. 2003;19:1510–1520. doi: 10.1016/s1053-8119(03)00102-2. [DOI] [PubMed] [Google Scholar]
- Dom G, De Wilde B, Hulstijn W, van den Brink W, Sabbe B. Decision-making deficits in alcohol-dependent patients with and without comorbid personality disorder. Alcohol Clin Exp Res. 2006;30:1670–1677. doi: 10.1111/j.1530-0277.2006.00202.x. [DOI] [PubMed] [Google Scholar]
- Fein G, Klein L, Finn P. Impairment on a simulated gambling task in long-term abstinent alcoholics. Alcohol Clin Exp Res. 2004;28:1487–1491. doi: 10.1097/01.alc.0000141642.39065.9b. [DOI] [PMC free article] [PubMed] [Google Scholar]
- Fiorillo CD, Tobler PN, Schultz W. Discrete coding of reward probability and uncertainty by dopamine neurons. Science. 2003;299:1898–1902. doi: 10.1126/science.1077349. [DOI] [PubMed] [Google Scholar]
- First MB, Spitzer RL, Gibbon M, Williams JBW. Structured Clinical Interview for DSM-IV-TR Axis I Disorders, Research Version, Patient Edition (SCID-I/P) New York: Biometrics Research, New York State Psychiatric Institute; 2002. [Google Scholar]
- Fishbein DH, Eldreth DL, Hyde C, Matochik JA, London ED, Contoreggi C, Kurian V, Kimes AS, Breeden A, Grant S. Risky decision making and the anterior cingulate cortex in abstinent drug abusers and nonusers. Brain Res Cogn Brain Res. 2005;23:119–136. doi: 10.1016/j.cogbrainres.2004.12.010. [DOI] [PubMed] [Google Scholar]
- Forman SD, Dougherty GG, Casey BJ, Siegle GJ, Braver TS, Barch DM, Stenger VA, Wick-Hull C, Pisarov LA, Lorensen E. Opiate addicts lack error-dependent activation of rostral anterior cingulate. Biol Psychiatry. 2004;55:531–537. doi: 10.1016/j.biopsych.2003.09.011. [DOI] [PubMed] [Google Scholar]
- Gilman JM, Ramchandani VA, Davis MB, Bjork JM, Hommer DW. Why we like to drink: a functional magnetic resonance imaging study of the rewarding and anxiolytic effects of alcohol. J Neurosci. 2008;28:4583–4591. doi: 10.1523/JNEUROSCI.0086-08.2008. [DOI] [PMC free article] [PubMed] [Google Scholar]
- Gilman JM, Davis MB, Hommer DW. Greater activation in left hemisphere language-related regions during simple judgment tasks among substance-dependent patients in treatment for alcoholism. Alcohol Clin Exp Res. 2010;34:331–341. doi: 10.1111/j.1530-0277.2009.01095.x. [DOI] [PubMed] [Google Scholar]
- Gilman JM, Smith AR, Ramchandani VA, Momenan R, Hommer DW. The effect of intravenous alcohol on the neural correlates of risky decision making in healthy social drinkers. Addict Biol. 2012;17:465–478. doi: 10.1111/j.1369-1600.2011.00383.x. [DOI] [PMC free article] [PubMed] [Google Scholar]
- Gilman S, Adams K, Koeppe RA, Berent S, Kluin KJ, Modell JG, Kroll P, Brunberg JA. Cerebellar and frontal hypometabolism in alcoholic cerebellar degeneration studied with positron emission tomography. Ann Neurol. 1990;28:775–785. doi: 10.1002/ana.410280608. [DOI] [PubMed] [Google Scholar]
- Gruber SA, Yurgelun-Todd DA. Neuroimaging of marijuana smokers during inhibitory processing: a pilot investigation. Brain Res Cogn Brain Res. 2005;23:107–118. doi: 10.1016/j.cogbrainres.2005.02.016. [DOI] [PubMed] [Google Scholar]
- Haber SN. Neurotransmitters in the human and nonhuman primate basal ganglia. Hum Neurobiol. 1986;5:159–168. [PubMed] [Google Scholar]
- Haber SN, Knutson B. The reward circuit: linking primate anatomy and human imaging. Neuropsychopharmacology. 2010;35:4–26. doi: 10.1038/npp.2009.129. [DOI] [PMC free article] [PubMed] [Google Scholar]
- Hobson CW, Scott S, Rubia K. Investigation of cool and hot executive function in ODD/CD independently of ADHD. J Child Psychol Psychiatry. 2011;52:1035–1043. doi: 10.1111/j.1469-7610.2011.02454.x. [DOI] [PubMed] [Google Scholar]
- Hommer DW, Bjork JM, Gilman JM. Imaging brain response to reward in addictive disorders. Ann N Y Acad Sci. 2011;1216:50–61. doi: 10.1111/j.1749-6632.2010.05898.x. [DOI] [PubMed] [Google Scholar]
- Jentsch JD, Taylor JR. Impulsivity resulting from frontostriatal dysfunction in drug abuse: implications for the control of behavior by reward-related stimuli. Psychopharmacology (Berl) 1999;146:373–390. doi: 10.1007/pl00005483. [DOI] [PubMed] [Google Scholar]
- Kaufman JN, Ross TJ, Stein EA, Garavan H. Cingulate hypoactivity in cocaine users during a GO-NOGO task as revealed by event-related functional magnetic resonance imaging. J Neurosci. 2003;23:7839–7843. doi: 10.1523/JNEUROSCI.23-21-07839.2003. [DOI] [PMC free article] [PubMed] [Google Scholar]
- Koob GF, Le Moal M. Drug addiction, dysregulation of reward, and allostasis. Neuropsychopharmacology. 2001;24:97–129. doi: 10.1016/S0893-133X(00)00195-0. [DOI] [PubMed] [Google Scholar]
- Krain AL, Wilson AM, Arbuckle R, Castellanos FX, Milham MP. Distinct neural mechanisms of risk and ambiguity: a meta-analysis of decision-making. Neuroimage. 2006;32:477–484. doi: 10.1016/j.neuroimage.2006.02.047. [DOI] [PubMed] [Google Scholar]
- Kuhnen CM, Knutson B. The neural basis of financial risk taking. Neuron. 2005;47:763–770. doi: 10.1016/j.neuron.2005.08.008. [DOI] [PubMed] [Google Scholar]
- Lane SD, Cherek DR. Analysis of risk taking in adults with a history of high risk behavior. Drug Alcohol Depend. 2000;60:179–187. doi: 10.1016/s0376-8716(99)00155-6. [DOI] [PubMed] [Google Scholar]
- Lane SD, Cherek DR. Risk taking by adolescents with maladaptive behavior histories. Exp Clin Psychopharmacol. 2001;9:74–82. doi: 10.1037/1064-1297.9.1.74. [DOI] [PubMed] [Google Scholar]
- Lane SD, Cherek DR, Pietras CJ, Tcheremissine OV. Alcohol effects on human risk taking. Psychopharmacology. 2004;172:68–77. doi: 10.1007/s00213-003-1628-2. [DOI] [PubMed] [Google Scholar]
- Le Berre AP, Rauchs G, La Joie R, Mezenge F, Boudehent C, Vabret F, Segobin S, Viader F, Allain P, Eustache F, Pitel AL, Beaunieux H. Impaired decision-making and brain shrinkage in alcoholism. Eur Psychiatry. 2014;29:125–133. doi: 10.1016/j.eurpsy.2012.10.002. [DOI] [PubMed] [Google Scholar]
- Lejuez CW, Read JP, Kahler CW, Richards JB, Ramsey SE, Stuart GL, Strong DR, Brown RA. Evaluation of a behavioral measure of risk taking: the Balloon Analogue Risk Task (BART) J Exp Psychol Appl. 2002;8:75–84. doi: 10.1037//1076-898x.8.2.75. [DOI] [PubMed] [Google Scholar]
- Li CS, Milivojevic V, Kemp K, Hong K, Sinha R. Performance monitoring and stop signal inhibition in abstinent patients with cocaine dependence. Drug Alcohol Depend. 2006;85:205–212. doi: 10.1016/j.drugalcdep.2006.04.008. [DOI] [PubMed] [Google Scholar]
- Li CS, Luo X, Yan P, Bergquist K, Sinha R. Altered impulse control in alcohol dependence: neural measures of stop signal performance. Alcohol Clin Exp Res. 2009;33:740–750. doi: 10.1111/j.1530-0277.2008.00891.x. [DOI] [PMC free article] [PubMed] [Google Scholar]
- Mohr PN, Biele G, Heekeren HR. Neural processing of risk. J Neurosci. 2010;30:6613–6619. doi: 10.1523/JNEUROSCI.0003-10.2010. [DOI] [PMC free article] [PubMed] [Google Scholar]
- Newman J, Wallace J. Diverse pathways to deficient self-regulation: implications for disinhibitory psychopathology in children. Clin Psychol Rev. 1993;13:699–720. [Google Scholar]
- Nieuwenhuis S, Heslenfeld DJ, von Geusau NJ, Mars RB, Holroyd CB, Yeung N. Activity in human reward-sensitive brain areas is strongly context dependent. Neuroimage. 2005;25:1302–1309. doi: 10.1016/j.neuroimage.2004.12.043. [DOI] [PubMed] [Google Scholar]
- Patton JH, Stanford MS, Barratt ES. Factor structure of the Barratt impulsiveness scale. J Clin Psychol. 1995;51:768–774. doi: 10.1002/1097-4679(199511)51:6<768::aid-jclp2270510607>3.0.co;2-1. [DOI] [PubMed] [Google Scholar]
- Paulus MP, Rogalsky C, Simmons A, Feinstein JS, Stein MB. Increased activation in the right insula during risk-taking decision making is related to harm avoidance and neuroticism. Neuroimage. 2003;19:1439–1448. doi: 10.1016/s1053-8119(03)00251-9. [DOI] [PubMed] [Google Scholar]
- Pfefferbaum A, Desmond JE, Galloway C, Menon V, Glover GH, Sullivan EV. Reorganization of frontal systems used by alcoholics for spatial working memory: an fMRI study. Neuroimage. 2001;14:7–20. doi: 10.1006/nimg.2001.0785. [DOI] [PubMed] [Google Scholar]
- Power Y, Goodyear B, Crockford D. Neural correlates of pathological gamblers preference for immediate rewards during the Iowa gambling task: an fMRI study. J Gambl Stud. 2012;28:623–636. doi: 10.1007/s10899-011-9278-5. [DOI] [PubMed] [Google Scholar]
- Preuschoff K, Bossaerts P, Quartz SR. Neural differentiation of expected reward and risk in human subcortical structures. Neuron. 2006;51:381–390. doi: 10.1016/j.neuron.2006.06.024. [DOI] [PubMed] [Google Scholar]
- Robinson TE, Berridge KC. The neural basis of drug craving: an incentive-sensitization theory of addiction. Brain Res Brain Res Rev. 1993;18:247–291. doi: 10.1016/0165-0173(93)90013-p. [DOI] [PubMed] [Google Scholar]
- Robinson TE, Berridge KC. The psychology and neurobiology of addiction: an incentive-sensitization view. Addiction. 2000;95(Suppl. 2):S91–S117. doi: 10.1080/09652140050111681. [DOI] [PubMed] [Google Scholar]
- Rolls ET, Grabenhorst F. The orbitofrontal cortex and beyond: from affect to decision-making. Prog Neurobiol. 2008;86:216–244. doi: 10.1016/j.pneurobio.2008.09.001. [DOI] [PubMed] [Google Scholar]
- Samson Y, Baron JC, Feline A, Bories J, Crouzel C. Local cerebral glucose utilisation in chronic alcoholics: a positron tomographic study. J Neurol Neurosurg Psychiatry. 1986;49:1165–1170. doi: 10.1136/jnnp.49.10.1165. [DOI] [PMC free article] [PubMed] [Google Scholar]
- Schultz W. Dopamine neurons and their role in reward mechanisms. Curr Opin Neurobiol. 1997;7:191–197. doi: 10.1016/s0959-4388(97)80007-4. [DOI] [PubMed] [Google Scholar]
- Silverman K, Svikis D, Robles E, Stitzer ML, Bigelow GE. A reinforcement-based therapeutic workplace for the treatment of drug abuse: six-month abstinence outcomes. Exp Clin Psychopharmacol. 2001;9:14–23. doi: 10.1037/1064-1297.9.1.14. [DOI] [PubMed] [Google Scholar]
- Woody G, Urshel HC, Alterman A. The Many Paths to Drug Dependence. Washington DC: American Psychological Association; 1992. [Google Scholar]
- Wrase J, Schlagenhauf F, Kienast T, Wustenberg T, Bermpohl F, Kahnt T, Beck A, Strohle A, Juckel G, Knutson B, Heinz A. Dysfunction of reward processing correlates with alcohol craving in detoxified alcoholics. Neuroimage. 2007;35:787–794. doi: 10.1016/j.neuroimage.2006.11.043. [DOI] [PubMed] [Google Scholar]
- Yechiam E, Busemeyer JR, Stout JC, Bechara A. Using cognitive models to map relations between neuropsychological disorders and human decision-making deficits. Psychol Sci. 2005;16:973–978. doi: 10.1111/j.1467-9280.2005.01646.x. [DOI] [PubMed] [Google Scholar]
- Zink CF, Pagnoni G, Martin-Skurski ME, Chappelow JC, Berns GS. Human striatal responses to monetary reward depend on saliency. Neuron. 2004;42:509–517. doi: 10.1016/s0896-6273(04)00183-7. [DOI] [PubMed] [Google Scholar]
Associated Data
This section collects any data citations, data availability statements, or supplementary materials included in this article.
Supplementary Materials
Figure S1 After a loss, all participants were significantly more likely to make a risky than a safe choice (F = 46.97, P < 0.0001). After a win, both groups were equally likely to make a risky or a safe choice.
Table S1 Within-group activation during ‘cue’ followed by risky or safe choice.
Table S2 Within-group activation during risky or safe ‘choice’.
Table S3 Within-group task-elicited activation to feedback.
Table S4 Within-group activation during ‘feedback’ modulated by earnings.