Abstract
Purpose
To study the density and packing geometry of the extrafoveal cone photoreceptors in eyes with a history of retinopathy of prematurity (ROP). We used a multimodal combination of adaptive optics (AO) scanning light ophthalmoscopy (SLO) and optical coherence tomography (OCT).
Methods
Cones were identified in subjects (aged 14–26 years) with a history of ROP that was either severe and treated by laser ablation of avascular peripheral retina (TROP; n = 5) or mild and spontaneously resolved, untreated (UROP; n = 5), and in term-born controls (CT; n = 8). The AO-SLO images were obtained at temporal eccentricities 4.5°, 9°, 13.5°, and 18° using both confocal and offset apertures with simultaneous, colocal OCT images. Effects of group, eccentricity, and aperture were evaluated and the modalities compared.
Results
In the SLO images, cone density was lower and the packing pattern less regular in TROP, relative to CT and UROP retinae. Although SLO image quality appeared lower in TROP, root mean square (RMS) wavefront error did not differ among the groups. In TROP eyes, cone discrimination was easier in offset aperture images. There was no evidence of cone loss in the TROP OCT images.
Conclusions
Low cone density in TROP confocal SLO images may have resulted from lower image quality. Since AO correction in these eyes was equivalent to that of the control group, and OCT imaging showed no significant cone loss, the optical properties of the inner retina or properties of the cones themselves are likely altered in a way that affects photoreceptor imaging.
Keywords: retinopathy of prematurity, cones, physiological optics, image analysis, photoreceptor morphology
Long-term sequelae of retinopathy of prematurity (ROP) on cone-mediated visual function include low visual acuity, visual field loss, reduced contrast sensitivity, and altered color vision.1–13 The extent to which underlying retinal abnormality is associated with these vision deficits remains incompletely specified. Electroretinographic (ERG) studies, both full-field and multifocal, have demonstrated deficits in cone and cone-mediated retinal function in subjects with a history of ROP.14,15 Studies of retinal structure in ROP subjects have, on the other hand, shown little in the way of abnormalities of the photoreceptor laminae, although altered foveal architecture, such as shallow pit with no central avascular zone and thicker postreceptor retinal laminae, has been documented.1,2,16,17
We used a multimodal adaptive optics retinal imager (MAORI; Physical Sciences, Inc., Andover, MA, USA) to capture simultaneous scanning light ophthalmoscopic (SLO) and spectral-domain optical coherence tomographic (OCT) retinal images.16,18 The SLO was used to visualize individual cone photoreceptors en face and the OCT was used to obtain cross-sectional images of photoreceptor and postreceptor laminae.16,18 Confocal SLO poorly visualizes photoreceptors with abnormal outer segment morphology or alignment, whereas offset aperture SLO visualizes the cone mosaic, regardless, by collecting the light scattered by the cone inner segments.19,20 Because anatomic studies in a rat model of ROP indicate that the photoreceptors may be structurally disorganized,21 we used both confocal and offset aperture methods22–24 as well as OCT (an approach based upon low-coherence interferometry) to visualize the cones and measure their density. In the SLO images, we also ascertained cone packing geometry.
Methods
Subjects
Subjects (aged 14–26 years) with a history of ROP were studied. All had serial fundus examinations in the newborn intensive care nursery similar to those used in the multicenter ROP treatment trials.25 Based upon these examinations, every subject was grouped according to the maximum acute-phase ROP.26 For severe ROP (zone II, stage 3), the avascular peripheral retina was treated by laser ablation (TROP; n = 5). For mild ROP (zone II, stage 1), the untreated clinical disease resolved spontaneously (UROP; n = 5). No subject had zone I disease, a history of retinal detachment, or retinal surgery other than laser treatment. Healthy, term-born subjects were also studied as controls (CT; n = 8). Written, informed consent was obtained from all adult subjects (aged 18 years or older) and from the parents of minor subjects, with assent from the minors. The treatment of subjects conformed to the Declaration of Helsinki and was approved by the Boston Children's Hospital Committee on Clinical Investigation.
In preparation for imaging, an ophthalmic examination was conducted that included visual acuity assessment using an Early Treatment Diabetic Retinopathy Study (ETDRS) chart, noncycloplegic autorefraction (WR-5100K; Grand Seiko, Hiroshima, Japan), ocular biometry (IOLMaster 500; Carl Zeiss Meditec AG, Jena, Germany; Sonomed E-Z Scan AB5500+; Lake Success, NY, USA), and wide-field, volumetric OCT of the macula (Spectralis; Heidelberg Engineering, Carlsbad, CA, USA). The cornea was anesthetized (0.5% proparacaine) and then phenylephrine (2.5%) and tropicamide (1%) were instilled in one eye to induce mydriasis and cycloplegia.
Retinal Imaging
The MAORI system has been described in detail elsewhere.16,18,27 Briefly, the MAORI is equipped with a deformable mirror (DM) that continuously compensates for the optical aberrations of the eye, enabling simultaneous, ultrahigh-resolution SLO and OCT videos of the retina that are parfocal and colocal.16 For the subjects with more than 4 diopters (D) of myopia, a −5.00 D spherical lens was placed in the optical path at a pupil conjugate to remove low-order defocus and preserve the DM's stroke for higher-order ocular aberrations. Scanning light ophthalmoscopy and OCT imaging was performed, simultaneously, in temporal retina at four eccentricities (4.5°, 9°, 13.5°, and 18°) along the transverse meridian. To image each eccentricity, the subject was instructed to fixate a target (a plus symbol) offset from the imaging raster.
Because an approach to cone counting has not been established in eyes with diseased photoreceptors, SLO-confocal, SLO-offset pinhole, and OCT methods were used and compared. Images were first acquired using a 100-μm (∼2 Airy disk)-diameter confocal pinhole and then using a 500-μm pinhole offset by ∼6 Airy disk diameters,22–24,28 the direction of the offset was optimized by the operator to best visualize the cones. Two to four sets of SLO and OCT videos, each consisting of 64 frames at 1-megapixel (1024 × 1000) resolution, were recorded using both pinholes at each eccentricity. The SLOs captured 1° × 1° of retina, and OCTs were sagittal 1° B-scans consisting of 1024 A-scans.
SLO Image Analysis
From each SLO video, 10 to 40 frames were aligned, using a nonrigid registration algorithm,29–32 and averaged to obtain a single image for analysis in a custom program (MATLAB; The MathWorks, Natick, MA, USA). An experienced examiner selected, by eye, the 0.75° × 0.75° area that showed the highest-quality cone mosaic. The cropping was advantageous because imperfect fixation by the subjects led to uneven amounts of averaging over the field. Cone centroids were initially detected by the software (imextendedmax.m, MATLAB), and then the examiner added or removed centroids as needed. Cone density was initially scaled in cells·deg−2. To scale density in cells·mm−2, the “angular subtense” of 1° of retina was calculated for each individual subject by
 |
where N′F′ is the position of the secondary nodal point of the eye.33 To calculate N′F′ in each subject, Bennett's step-along formulae were used.34 Each subject's measured values of axial length, anterior corneal curvature, anterior chamber depth, and lens thickness were plugged into these formulae; other values were obtained from Gullstrand's Schematic Eye No. 2. Dividing initial cone density (cells·deg−2) by the square of angular subtense (mm2·deg−2) specified density in cells·mm−2.
At each eccentricity, every subject's cone diameter was estimated as the mean of the major and minor axes of ellipses manually fit to 20 representative cones in each image. Cone packing geometry was assessed by applying Voronoi tessellation (voronoin.m, MATLAB) with the cone centroids as the generators. Voronoi cells that did not close, or appeared to close outside the image, were excluded from analysis.
OCT Image Analysis
Up to 45 B-scans from each OCT were aligned by cross-correlation and averaged. The final images were manually marked in ImageJ35 to delineate the boundary of the vitreous and nerve fiber layer (NFL), the boundary between the outer plexiform layer (OPL) and outer nuclear layer (ONL), and the boundary between the retinal pigment epithelium (RPE) and choroid. Thickness of the postreceptor (NFL–OPL) and photoreceptor (ONL–RPE) laminae in each OCT was taken as the mean across all A-scans.
In the OCT images, the cone photoreceptors were identified and counted by a second examiner. To produce a provisional measure of correspondence between the imaging modalities (SLO versus OCT), the square root of SLO cone density (cells·deg−1) was calculated and plotted against the cones detected in the OCT (cells·deg−1).
Wavefront Analyses
The DM is controlled by a Shack-Hartmann wavefront sensor (WS) composed of a lenslet array and a charge-coupled device camera (Uniq Vision, Inc., Santa Clara, CA, USA). A lens relay placed in front of the sensor blocks reflections from out-of-plane objects (e.g., the cornea), providing for high-quality correction to reflections from the retina.36 In order to evaluate the relative quality of the corrections in the three groups, videos of the WS spots were evaluated to determine their displacement from the plane-wave reference pattern, and a root mean square (RMS) error term was calculated for every scan in every subject; these were then averaged to produce a mean RMS for each subject.
Statistical Analyses
Respective 1-factor ANOVAs were used to evaluate differences among the three groups (TROP, UROP, CT) in spherical equivalent refraction, axial length, anterior chamber depth, lens thickness, angular subtense, and WS RMS error. The primary independent variables were group and eccentricity, but SLO-confocal, SLO-offset pinhole, and OCT methods were also compared. Full-factorial repeated-measures (subjects) mixed linear models were applied to the cone density, packing geometry, and inner segment diameter data, measured in SLO images, to evaluate the effects of group, eccentricity (4.5°, 9°, 13.5°, 18°), and aperture (confocal, offset). These were followed by Bonferroni-adjusted pairwise multiple comparison tests. Cone density, measured in the OCT, was evaluated using an additional mixed linear model with the same factors. A final mixed linear model, with an additional factor, layer (postreceptor, photoreceptor), was used to evaluate retinal thickness. The aforementioned analyses were all conducted in IBM SPSS Statistics 22 (SPSS; IBM, Chicago, IL, USA). Scanning light ophthalmoscopy and OCT cone counts were compared, using orthogonal regression, in Prism 6 (GraphPad Software, Inc., La Jolla, CA, USA). For all tests, the level of significance, α, was set at 0.05.
Results
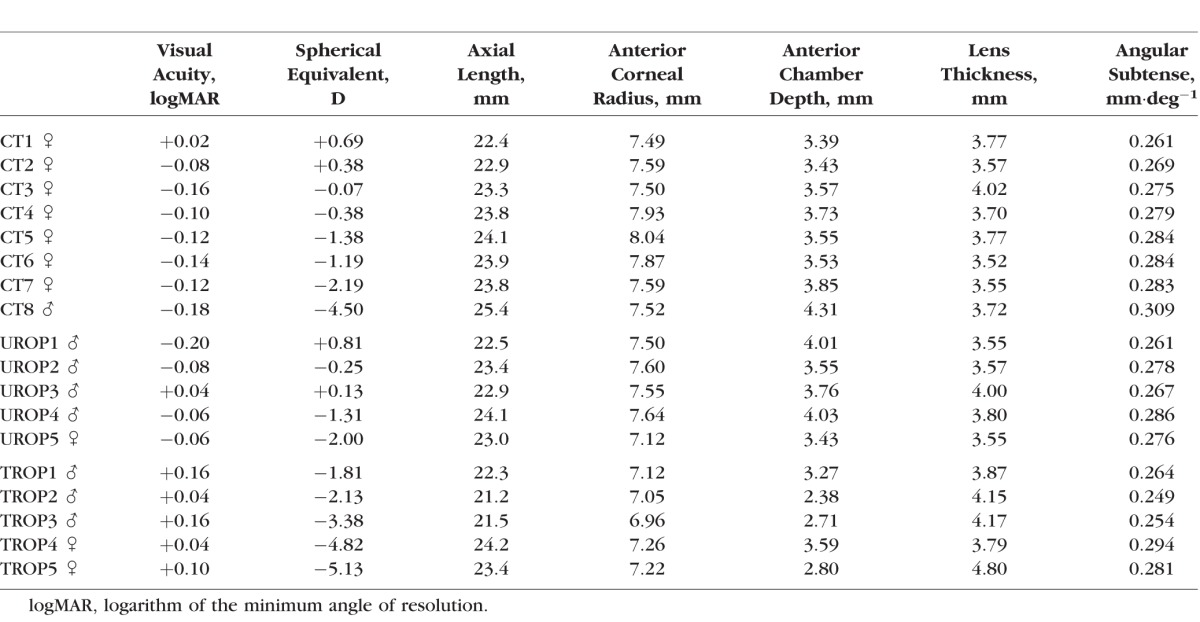
The Table lists visual acuity, spherical equivalent, ocular dimensions, and calculated angular subtense for each subject. Values in TROP differed significantly from those in UROP and CT in the following ways: Visual acuity was poorer (P = 2.45·10−4), spherical equivalent was more myopic (P = 0.0158), anterior corneal radius of curvature was steeper (P = 5.18·10−4), the depth of the anterior chamber was shallower (P = 0.00343), and lens thickness was greater (P = 0.0137). Axial length and angular subtense did not differ significantly among the groups. Post hoc testing indicated that UROP and CT did not differ in any of these parameters. The clinical OCT scans of TROP subjects showed the fovea centralis to be conspicuously shallow and the postreceptor laminae thickened; the photoreceptor laminae appeared normal. There was no significant difference in the WS RMS error among CT, UROP, and TROP.
Table.
Subject Characteristics
Scanning Light Ophthalmoscopy
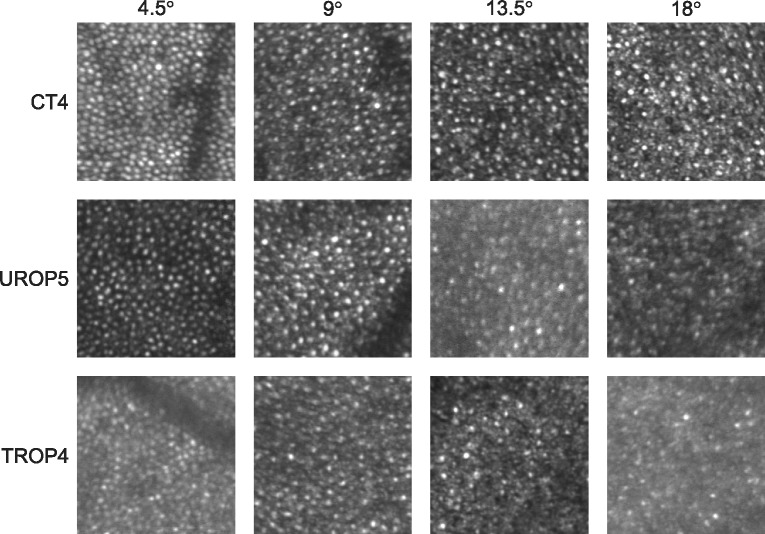
Figures 1 and 2 show representative registered and averaged images, obtained at the four eccentricities, using the confocal and offset apertures, respectively. At 18° and 13.5°, the cones appeared more readily discriminable when using the offset aperture versus the confocal aperture; there appeared to be more bright spots, with a range of sizes, in the confocal compared to offset aperture images. At 9° and 4.5°, the difference was less apparent.
Figure 1.
Sample confocal aperture SLO images (0.25° × 0.25°) obtained at four eccentricities (top) from the subjects indicated (left).
Figure 2.
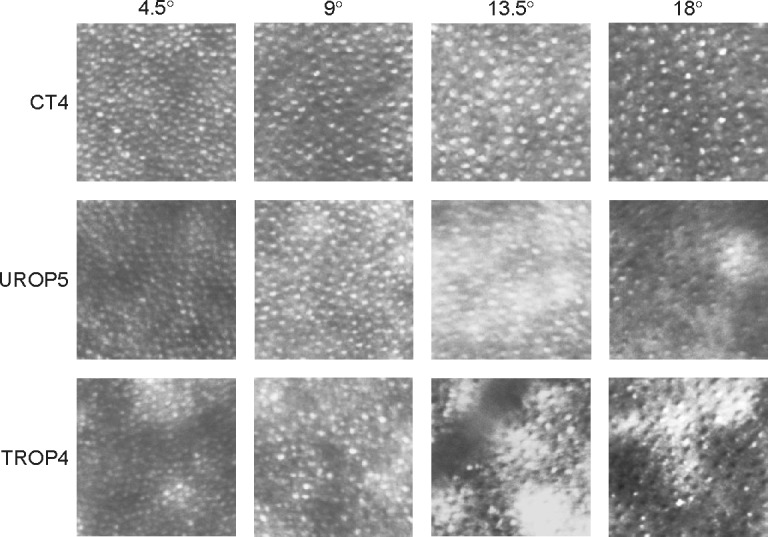
Sample offset aperture SLO images (0.25° × 0.25°) obtained at the same eccentricities (top) from the same subjects (left) as in Figure 1. Compared to the confocal images (Fig. 1), identification of the cones at 13.5° and 18° appeared less ambiguous when the offset aperture was used.
Cone Density.
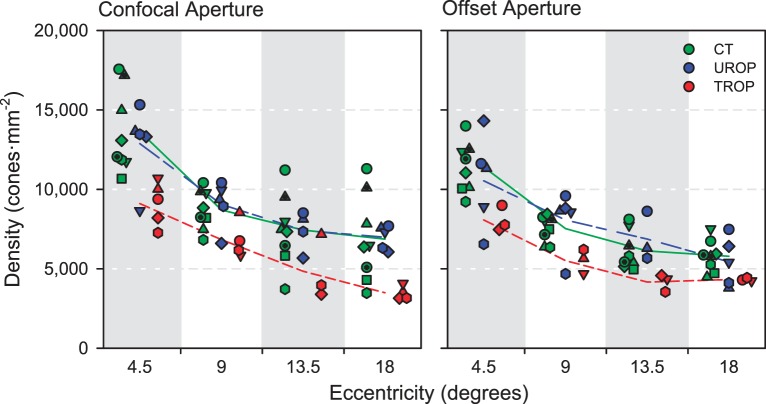
Figure 3 shows the density of the cone photoreceptors, identified in individual subjects, using both the confocal aperture (left) and the offset aperture (right) at all eccentricities. There were significant main effects of eccentricity (P = 4.90·10−13), aperture (P = 3.30·10−4), and group (P = 4.55·10−10). Density decreased with increasing eccentricity. Density was also lower in the offset aperture SLOs. The difference between confocal and offset aperture density values is in the direction expected if rods contributed to the estimates of density in the former. According to post hoc analyses, the group effect was driven by the TROP images, which contained significantly fewer cones than the CT or UROP images (which, in turn, did not differ from one another). There were no significant interaction effects.
Figure 3.
Cone density measured from SLO images using the confocal aperture (left) and the offset aperture (right). Each symbol represents data from an individual subject. The line segments connect the group means at each eccentricity.
Cone Diameter.
Fitted cone diameter did not vary significantly with either group or eccentricity. However, it was significantly higher (P = 0.0438) when using the offset aperture (range, 7.71–11.2 μm; median: 8.88 μm) compared to the confocal aperture (range, 7.05–12.0 μm; median: 8.57 μm). The offset aperture yielded images with well-circumscribed, “bubble wrap” appearance of cones, the diameters of which were quite similar to those obtained in anatomical studies.37
Cone Packing Geometry.
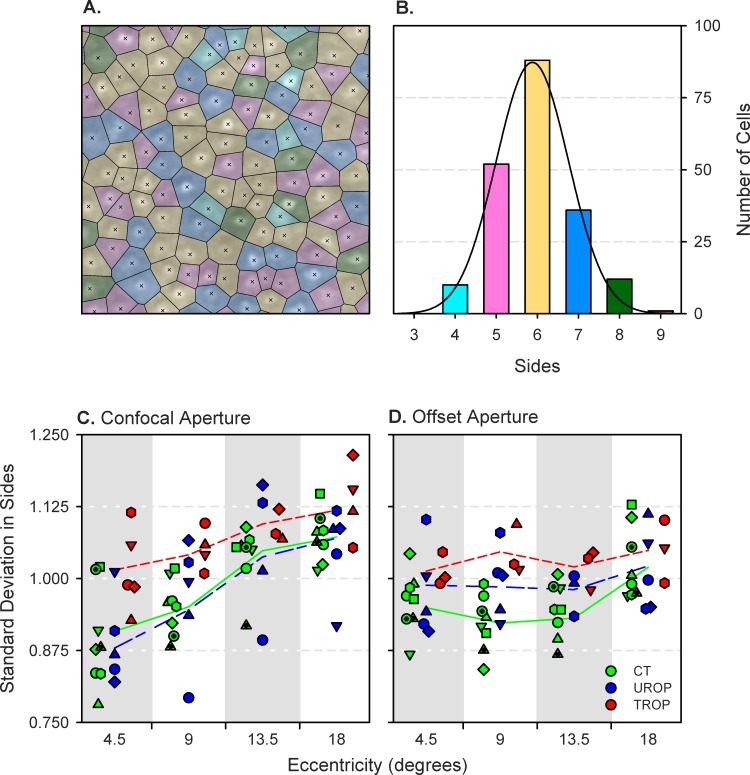
In Figure 4A, the Voronoi tessellation is superimposed on the 18° offset aperture image of subject CT4. A normal distribution summarizes the side counts in Figure 4B. For this and all other Voronoi tessellations, the mean number of sides was close to six. The standard deviation in the number of sides (Figs. 4C, 4D), however, varied with group (P = 9.84·10−7), eccentricity (P = 2.12·10−6), and aperture (P = 0.0463). Post hoc, between-group comparisons found that the standard deviation was significantly higher in TROP than in either UROP or CT images. This is consistent with irregular cone packing in TROP eyes. Moreover, a significant eccentricity × aperture interaction (P = 0.00118) indicated more variability in the cone packing patterns displayed in eccentric confocal scans.
Figure 4.
Voronoi tessellations. (A) Voronoi cells superimposed over the 18° offset aperture SLO image of subject CT4 that is shown in Figure 2. Crosses mark the cone centroids; lines demarcate points that are equidistant between the two nearest centroids. Each cell, which is the region closer to the enclosed centroid than to any other, is color-coded based upon its number of sides. (B) Histogram of the number of sides in the image shown in (A). The height of the bars is for the entire (0.75° × 0.75°) image, not only the 0.25° × 0.25° region shown. The color of the bars matches the coding in the tessellation. A Gaussian (black line) fit to the distribution provides mean and standard deviation parameters. (C) Standard deviation in the number of sides of the Voronoi cells in the confocal aperture SLO images. (D) Standard deviation in the number of sides of the Voronoi cells in the offset aperture SLO images. The symbols indicate the same subjects as in Figure 3. The line segments connect the group means at each eccentricity.
Optical Coherence Tomography
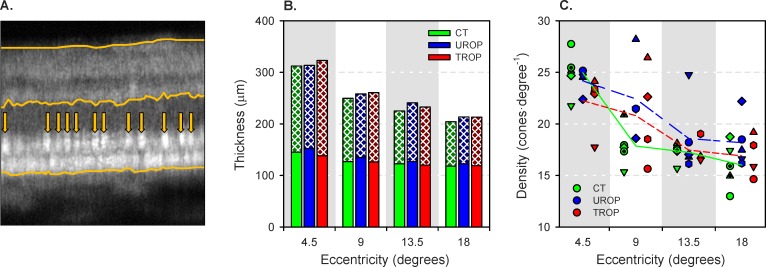
Counts of cones visible in the OCT images (Fig. 5A) were obtained in both the offset and confocal configurations.
Figure 5.
Optical coherence tomography image analyses. (A) Sample OCT from 18° eccentric in subject CT4. Lines mark the vitreoretinal boundary (top), OPL–ONL boundary (middle), and RPE–choroid boundary (bottom). At the ellipsoid zone, bright cone inner segments are identified (arrows). (B) Stacked mean thickness of the photoreceptor (solid) and postreceptor (crosshatched) retinal layers for each group at the four eccentricities. (C) Cones counted in the OCT images. The symbols indicate the individual subjects as in Figures 3 and 4. The line segments connect the group means at each eccentricity.
Retinal Thickness.
The photoreceptor and postreceptor laminae are demarked on a sample image in Figure 5A. Figure 5B shows the mean photoreceptor and postreceptor retinal thickness for each group and eccentricity. Unsurprisingly, total retinal thickness decreased significantly with increasing eccentricity (P = 1.93·10−33). Total retinal thickness differed significantly among groups (P = 0.00665); both UROP and TROP retinae were significantly thicker than CT retinae in post hoc comparisons. It was the thickness of the postreceptor retina that was responsible for the increased total thickness in TROP (P = 4.64·10−6), a result that keeps company with ERG38 and psychophysical39 data suggesting that beneficial remodeling of the inner retina40 occurs in eyes with a history of ROP.
Cone Counts.
Figure 5C shows the number of cones (cells·deg−1) at each eccentricity, identified using the OCT, in individual subjects. The only significant effect (main or interaction) was the main effect of eccentricity (P = 2.38·10−14): As eccentricity increased, cone density decreased. No group differences were detected.
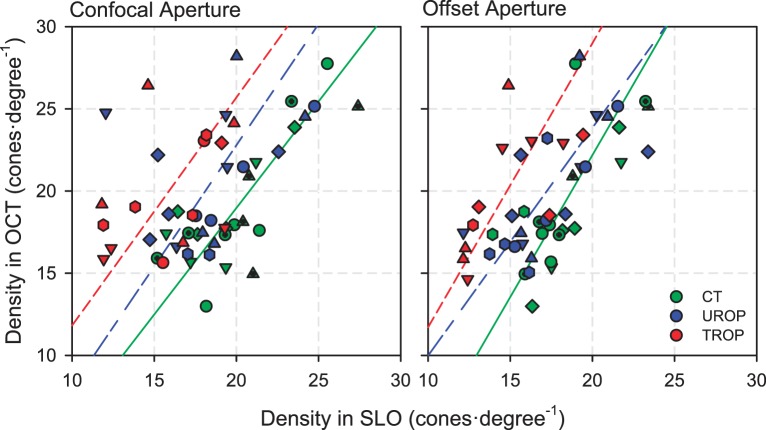
Cone counts obtained by OCT are compared, by orthogonal regression, to the square roots of those obtained by SLO, in Figure 6. In CT subjects, cone counts by OCT and SLO were about the same, whether the confocal or offset aperture was used, and the regressions were significant (confocal P = 4.76·10−5; offset P = 1.18·10−4). Only when using the offset aperture were the regressions significant for UROP (P = 7.89·10−4) and TROP (P = 0.0284). With the offset aperture, the slopes of the regressions were nearly the same but the elevations (intercepts) were significantly different (P = 0.00103). With the confocal aperture, due to increased scatter around the regression lines, the UROP and TROP regressions were not significant.
Figure 6.
Comparison of OCT and SLO cone counts obtained using the confocal aperture (left) and offset aperture (right). The symbols indicate the same subjects as in Figures 3, 4, and 5. The lines are orthogonal regressions through the data for each group. The scatter of points around the regression lines for TROP and UROP subjects is greater with the confocal than the offset aperture.
Discussion
The cones in extrafoveal TROP retina appeared to be reduced in density and irregularly packed, relative to those in CT and UROP. Although the present study does not include data from former preterms without a history of ROP, that the UROP subjects did not differ from the CT subjects makes it very unlikely that their inclusion would have changed our conclusions.
Cone density in CT subjects, whether obtained using the confocal or offset aperture, was in reasonable agreement with anatomic data. For example, at 4.5° temporal eccentricity, Curcio et al.37 show ∼15,000 cones·mm−2; in our sample, mean CT cone density at this location was 13,641 (range, 10,679–17,566) cones·mm−2 using the confocal aperture and 11,407 (range, 9221–13,981) cones·mm−2 using the offset aperture. We suspect that we were failing to identify many cones in the confocal images, compensated by the erroneous labeling of other, brightly reflecting objects (perhaps unresolved rod groupings) as cones. The CT cone counts made in the OCT were well correlated with those made in both the confocal and offset aperture SLOs. Thus, the procedures described herein may be reasonable for gathering information about the distribution of the cone photoreceptors in the ROP retina (for which there are no anatomic data to reference). However, the difference in cone density measured with confocal and offset apertures is significant. Nevertheless, regardless of the aperture used, and in spite of the fact that our sample size was somewhat small, TROP SLOs contained significantly fewer discernable cones. This keeps company with recognized cone-mediated vision deficits in TROP subjects.1 What explains the apparent loss of cone density in TROP? Actual loss of cones, or some consequence of image quality?
Subjectively, SLO image quality in the TROP eyes seemed poorer (Fig. 2), especially at the more eccentric locations (i.e., 13.5° and 18°). This may have arisen from altered optics in the TROP eyes (steeper cornea, thicker lens, and steeper retinal curvature41), for which the DM could not fully compensate. The lack of a significant difference in WS RMS, however, suggests that this was not the case. Instead, there may have been a loss of transparency in the thicker postreceptor retina or in the intraocular media. A further and perhaps more plausible explanation for poor image quality may be abnormal cone structure that led to defects in the wave-guiding properties of the cones.42–46 Disorganized inner and outer segments of rods have been demonstrated by electron microscopy in a rat model of ROP.21 These explanations are not necessarily mutually exclusive.
The offset and confocal apertures offer complementary detection schemes that emphasize different local optical properties of imaged structures: The confocal aperture favors visualization of strongly backscattering structures and retinal layer interfaces, such as the cone inner-segment/outer-segment junctions and the outer segment tips. The offset aperture enables better visualization of more subtle forward- and multiply-scattering structures, such as the complicated structures of the cone inner segments.19,23,28,47,48 This has important implications for imaging diseased retina because confocal imaging methods may obscure the source of the optical changes exhibited by abnormal photoreceptors.20 That said, TROP cone counts were lower regardless of aperture (confocal, offset).
Those cones identified in the TROP SLOs were more irregularly arranged, as indicated by Voronoi tessellation of their centroids. Regularly arranged cones have predominantly hexagonal packing, indicated by mean number of sides close to six and low standard deviation.49 High standard deviation in the number of sides in the TROP tessellations indicates disruption of normal cone organization. However, the same image quality caveats mentioned above apply to this measure of local order. We are unaware of any standard “noise-equivalent” order analysis by which to gauge the significance of this finding.
Indeed, the OCT showed that the thickness of the photoreceptor laminae in TROP subjects was normal. Further, the cone counts derived from the OCT did not differ among the groups or with respect to the aperture. Due to its primary sensitivity to directly back-scattered ballistic photons, OCT presumably does not depend so heavily on the other light-scattering properties of the cones as does SLO. Thus, the OCT result favors low image quality (rather than actual loss of cones) as the explanation for decreased cone density in TROP SLOs. However, caution in interpretation of the OCT cone counts is warranted: The random intersections of cones along individual B-scan planes as they shift on the retina (due to imperfect fixation) make this indirect, linear measure of cone density (cones·mm−1) intrinsically less precise than en face SLO area cone counts (cones·mm−2). Taken together, the imaging data reinforce the notion that severe ROP is associated with persistent changes in the photoreceptors,1 likely affecting their optical properties. Further, the thickening of the postreceptor laminae in TROP suggests that inner retinal cells remodel compensatory to loss of photoreceptor input.
More, and more robust, imaging modalities with cross-modal comparison can advance visualization and understanding of retinal structure. Such methods may be especially important for investigation of diseased eyes.
Acknowledgments
The authors thank Toco Y.P. Chui for helping us initiate the offset pinhole studies.
Supported by the Massachusetts Lions Eye Research Fund (RMH), Boston Children's Hospital Ophthalmology Foundation (JDA), and National Institutes of Health Grant EY10597 (ABF).
Disclosure: R. Ramamirtham, None; J.D. Akula, None; G. Soni, None; M.J. Swanson, None; J.N. Bush, None; A. Moskowitz, None; E.A. Swanson, None; T.L. Favazza, None; J.L. Tavormina, None; M. Mujat, Physical Sciences, Inc. (E), P; R.D. Ferguson, Physical Sciences, Inc. (E), P; R.M. Hansen, None; A.B. Fulton, None
References
- 1. Fulton AB,, Hansen RM,, Moskowitz A,, Akula JD. The neurovascular retina in retinopathy of prematurity. Prog Retin Eye Res. 2009; 28: 452–482. [DOI] [PMC free article] [PubMed] [Google Scholar]
- 2. Hellstrom A,, Smith LE,, Dammann O. Retinopathy of prematurity. Lancet. 2013; 382: 1445–1457. [DOI] [PMC free article] [PubMed] [Google Scholar]
- 3. Reisner DS,, Hansen RM,, Findl O,, Petersen RA,, Fulton AB. Dark-adapted thresholds in children with histories of mild retinopathy of prematurity. Invest Ophthalmol Vis Sci. 1997; 38: 1175–1183. [PubMed] [Google Scholar]
- 4. Spencer R. Long-term visual outcomes in extremely low-birth-weight children (an American Ophthalmological Society thesis). Trans Am Ophthalmol Soc. 2006; 104: 493–516. [PMC free article] [PubMed] [Google Scholar]
- 5. Palmer EA,, Hardy RJ,, Dobson V,, et al. 15-year outcomes following threshold retinopathy of prematurity: final results from the multicenter trial of cryotherapy for retinopathy of prematurity. Arch Ophthalmol. 2005; 123: 311–318. [DOI] [PubMed] [Google Scholar]
- 6. O'Connor AR,, Stephenson TJ,, Johnson A,, et al. Visual function in low birthweight children. Br J Ophthalmol. 2004; 88: 1149–1153. [DOI] [PMC free article] [PubMed] [Google Scholar]
- 7. Dobson V,, Quinn GE,, Summers CG,, et al. Effect of acute-phase retinopathy of prematurity on grating acuity development in the very low birth weight infant. The Cryotherapy for Retinopathy of Prematurity Cooperative Group. Invest Ophthalmol Vis Sci. 1994; 35: 4236–4244. [PubMed] [Google Scholar]
- 8. Robinson R,, O'Keefe M. Follow-up study on premature infants with and without retinopathy of prematurity. Br J Ophthalmol. 1993; 77: 91–94. [DOI] [PMC free article] [PubMed] [Google Scholar]
- 9. Birch EE,, Spencer R. Visual outcome in infants with cicatricial retinopathy of prematurity. Invest Ophthalmol Vis Sci. 1991; 32: 410–415. [PubMed] [Google Scholar]
- 10. Cryotherapy for Retinopathy of Prematurity Cooperative Group. Multicenter Trial of Cryotherapy for Retinopathy of Prematurity: ophthalmological outcomes at 10 years. Arch Ophthalmol. 2001; 119: 1110–1118. [DOI] [PubMed] [Google Scholar]
- 11. Myers VS,, Gidlewski N,, Quinn GE,, Miller D,, Dobson V. Distance and near visual acuity contrast sensitivity, and visual fields of 10-year-old children. Arch Ophthalmol. 1999; 117: 94–99. [DOI] [PubMed] [Google Scholar]
- 12. Quinn GE,, Dobson V,, Hardy RJ,, Tung B,, Phelps DL,, Palmer EA. Visual fields measured with double-arc perimetry in eyes with threshold retinopathy of prematurity from the cryotherapy for retinopathy of prematurity trial. The CRYO-Retinopathy of Prematurity Cooperative Group. Ophthalmology. 1996; 103: 1432–1437. [DOI] [PubMed] [Google Scholar]
- 13. Dobson V,, Quinn GE,, Abramov I,, et al. Color vision measured with pseudoisochromatic plates at five-and-a-half years in eyes of children from the CRYO-ROP study. Invest Ophthalmol Vis Sci. 1996; 37: 2467–2474. [PubMed] [Google Scholar]
- 14. Fulton AB,, Hansen RM,, Moskowitz A. The cone electroretinogram in retinopathy of prematurity. Invest Ophthalmol Vis Sci. 2008; 49: 814–819. [DOI] [PMC free article] [PubMed] [Google Scholar]
- 15. Fulton AB,, Hansen RM,, Moskowitz A,, Barnaby AM. Multifocal ERG in subjects with a history of retinopathy of prematurity. Doc Ophthalmol. 2005; 111: 7–13. [DOI] [PubMed] [Google Scholar]
- 16. Hammer DX,, Iftimia NV,, Ferguson RD,, et al. Foveal fine structure in retinopathy of prematurity: an adaptive optics Fourier domain optical coherence tomography study. Invest Ophthalmol Vis Sci. 2008; 49: 2061–2070. [DOI] [PMC free article] [PubMed] [Google Scholar]
- 17. Swanson C,, Cocker KD,, Parker KH,, Moseley MJ,, Fielder AR. Semiautomated computer analysis of vessel growth in preterm infants without and with ROP. Br J Ophthalmol. 2003; 87: 1474–1477. [DOI] [PMC free article] [PubMed] [Google Scholar]
- 18. Hammer DX,, Ferguson RD,, Mujat M,, et al. Multimodal adaptive optics retinal imager: design and performance. J Opt Soc Am A Opt Image Sci Vis. 2012; 29: 2598–2607. [DOI] [PMC free article] [PubMed] [Google Scholar]
- 19. Scoles D,, Sulai YN,, Langlo CS,, et al. In vivo imaging of human cone photoreceptor inner segments. Invest Ophthalmol Vis Sci. 2014; 55: 4244–4251. [DOI] [PMC free article] [PubMed] [Google Scholar]
- 20. Scoles D,, Flatter JA,, Cooper RF,, et al. Assessing photoreceptor structure associated with ellipsoid zone disruptions visualized with optical coherence tomography. Retina. 2016; 36: 91–103. [DOI] [PMC free article] [PubMed] [Google Scholar]
- 21. Fulton AB,, Reynaud X,, Hansen RM,, Lemere CA,, Parker C,, Williams TP. Rod photoreceptors in infant rats with a history of oxygen exposure. Invest Ophthalmol Vis Sci. 1999; 40: 168–174. [PubMed] [Google Scholar]
- 22. Zhong Z,, Song H,, Chui TY,, Petrig BL,, Burns SA. Noninvasive measurements and analysis of blood velocity profiles in human retinal vessels. Invest Ophthalmol Vis Sci. 2011; 52: 4151–4157. [DOI] [PMC free article] [PubMed] [Google Scholar]
- 23. Elsner AE,, Zhou Q,, Beck F,, et al. Detecting AMD with multiply scattered light tomography. Int Ophthalmol. 2001; 23: 245–250. [DOI] [PubMed] [Google Scholar]
- 24. Elsner A,, Miura M,, Burns S,, et al. Multiply scattered light tomography and confocal imaging: detecting neovascularization in age-related macular degeneration. Opt Express. 2000; 7: 95–106. [DOI] [PubMed] [Google Scholar]
- 25. Early Treatment for Retinopathy of Prematurity Cooperative Group. Revised indications for the treatment of retinopathy of prematurity: results of the early treatment for retinopathy of prematurity randomized trial. Arch Ophthalmol. 2003; 121: 1684–1694. [DOI] [PubMed] [Google Scholar]
- 26. International Committee for the Classification of Retinopathy of Prematurity. The International Classification of Retinopathy of Prematurity revisited. Arch Ophthalmol. 2005; 123: 991–999. [DOI] [PubMed] [Google Scholar]
- 27. Ferguson RD,, Zhong Z,, Hammer DX,, et al. Adaptive optics scanning laser ophthalmoscope with integrated wide-field retinal imaging and tracking. J Opt Soc Am A Opt Image Sci Vis. 2010; 27: A265–A277. [DOI] [PMC free article] [PubMed] [Google Scholar]
- 28. Chui TY,, Vannasdale DA,, Burns SA. The use of forward scatter to improve retinal vascular imaging with an adaptive optics scanning laser ophthalmoscope. Biomed Opt Express. 2012; 3: 2537–2549. [DOI] [PMC free article] [PubMed] [Google Scholar]
- 29. Mujat M,, Patel A,, Iftimia N,, Akula JD,, Fulton AB,, Ferguson RD. High-resolution retinal imaging: enhancement techniques. SPIE Ophthalmic Technologies XXV. 2015: 93073.
- 30. Kroon D-J. B-spline grid image and point based registration. 2008. Available at: http://www.mathworks.com/matlabcentral/fileexchange/20057-b-spline-grid--image-and- point-based-registration. Accessed March 8, 2015.
- 31. Rueckert D,, Sonoda LI,, Hayes C,, Hill DL,, Leach MO,, Hawkes DJ. Nonrigid registration using free-form deformations: application to breast MR images. IEEE Trans Med Imaging. 1999; 18: 712–721. [DOI] [PubMed] [Google Scholar]
- 32. Lee S,, Wolberg G,, Shin SY. Scattered data interpolation with multilevel B-splines. IEEE Trans Vis Comput Graph. 1997; 3: 228–244. [Google Scholar]
- 33. Li KY,, Tiruveedhula P,, Roorda A. Intersubject variability of foveal cone photoreceptor density in relation to eye length. Invest Ophthalmol Vis Sci. 2010; 51: 6858–6867. [DOI] [PMC free article] [PubMed] [Google Scholar]
- 34. Rabbetts RB. The schematic eye. : Rabbetts RB, Bennett and Rabbetts' Clinical Visual Optics. Boston, MA: Butterworth-Heinemann Ltd.; 1998: 207–228. [Google Scholar]
- 35. Rasband WS. ImageJ. Bethesda, MD: U.S. National Institutes of Health; 1997–2012. [Google Scholar]
- 36. Hammer DX,, Ferguson RD,, Mujat M,, et al. Multimodal adaptive optics retinal imager: design and performance. J Opt Soc Am A. 2012; 29: 2598–2607. [DOI] [PMC free article] [PubMed] [Google Scholar]
- 37. Curcio CA,, Sloan KR,, Kalina RE,, Hendrickson AE. Human photoreceptor topography. J Comp Neurol. 1990; 292: 497–523. [DOI] [PubMed] [Google Scholar]
- 38. Harris ME,, Moskowitz A,, Fulton AB,, Hansen RM. Long-term effects of retinopathy of prematurity (ROP) on rod and rod-driven function. Doc Ophthalmol. 2011; 122: 19–27. [DOI] [PMC free article] [PubMed] [Google Scholar]
- 39. Hansen RM,, Tavormina JL,, Moskowitz A,, Fulton AB. Effect of retinopathy of prematurity on scotopic spatial summation. Invest Ophthalmol Vis Sci. 2014; 55: 3311–3313. [DOI] [PMC free article] [PubMed] [Google Scholar]
- 40. Jones BW,, Watt CB,, Frederick JM,, et al. Retinal remodeling triggered by photoreceptor degenerations. J Comp Neurol. 2003; 464: 1–16. [DOI] [PubMed] [Google Scholar]
- 41. Munro RJ,, Fulton AB,, Chui TY,, et al. Eye growth in term- and preterm-born eyes modeled from magnetic resonance images. Invest Ophthalmol Vis Sci. 2015; 56: 3121–3131. [DOI] [PMC free article] [PubMed] [Google Scholar]
- 42. Stiles WS,, Crawford BH. The luminous efficiency of rays entering the eye pupil at different points. Proc R Soc Lond B. 1933; 112: 428–450. [Google Scholar]
- 43. Westheimer G. Directional sensitivity of the retina: 75 years of Stiles-Crawford effect. Proc Biol Sci. 2008; 275: 2777–2786. [DOI] [PMC free article] [PubMed] [Google Scholar]
- 44. Vohnsen B. Directional sensitivity of the retina: a layered scattering model of outer-segment photoreceptor pigments. Biomed Opt Express. 2014; 5: 1569–1587. [DOI] [PMC free article] [PubMed] [Google Scholar]
- 45. Panorgias A,, Zawadzki RJ,, Capps AG,, Hunter AA,, Morse LS,, Werner JS. Multimodal assessment of microscopic morphology and retinal function in patients with geographic atrophy. Invest Ophthalmol Vis Sci. 2013; 54: 4372–4384. [DOI] [PMC free article] [PubMed] [Google Scholar]
- 46. Gao W,, Cense B,, Zhang Y,, Jonnal RS,, Miller DT. Measuring retinal contributions to the optical Stiles-Crawford effect with optical coherence tomography. Opt Express. 2008; 16: 6486–6501. [DOI] [PMC free article] [PubMed] [Google Scholar]
- 47. Chui TY,, Gast TJ,, Burns SA. Imaging of vascular wall fine structure in the human retina using adaptive optics scanning laser ophthalmoscopy. Invest Ophthalmol Vis Sci. 2013; 54: 7115–7124. [DOI] [PMC free article] [PubMed] [Google Scholar]
- 48. Jonnal RS,, Kocaoglu OP,, Zawadzki RJ,, Lee SH,, Werner JS,, Miller DT. The cellular origins of the outer retinal bands in optical coherence tomography images. Invest Ophthalmol Vis Sci. 2014; 55: 7904–7918. [DOI] [PMC free article] [PubMed] [Google Scholar]
- 49. Kotschick D. The topology and combinatorics of soccer balls: when mathematicians think about soccer balls, the number of possible designs quickly multiplies. Am Sci. 2006; 94: 350–357. [Google Scholar]


