Abstract
Purpose
To compare ocular outcomes in healthy subjects undergoing 14- and/or 70-day head-down-tilt (HDT) bed rest (BR).
Methods
Participants were selected by using NASA standard screening procedures. Standardized NASA BR conditions were implemented. Subjects maintained a 6° HDT position for 14 and/or 70 consecutive days. Weekly ophthalmologic examinations were performed in the sitting (pre/post-BR only) and HDT positions. Mixed-effects linear models compared pre- and post-HDT BR observations between 14- and 70-day HDT BR in best-corrected visual acuity, spherical equivalent, intraocular pressure (IOP), Spectralis OCT retinal nerve fiber layer thickness, peripapillary and macular retinal thicknesses.
Results
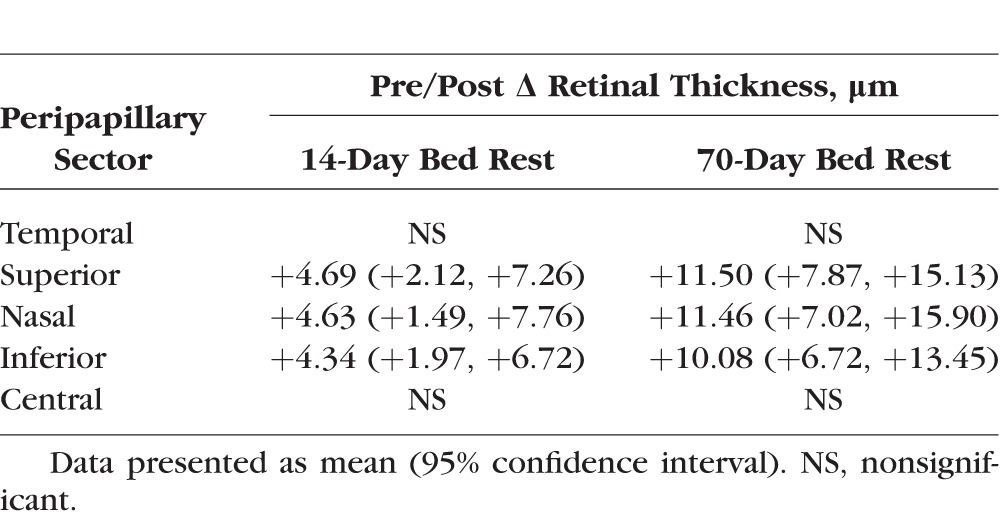
Sixteen and six subjects completed the 14- and 70-day HDT BR studies, respectively. The magnitude of HDT BR–induced changes was not significantly different between the two studies for all outcomes, except the superior (mean pre/post difference of 14- vs. 70-day HDT BR: +4.69 μm versus +11.50 μm), nasal (+4.63 μm versus +11.46 μm), and inferior (+4.34 μm versus +10.08 μm) peripapillary retinal thickness. A +1.42 mm Hg and a +1.79 mm Hg iCare IOP increase from baseline occurred during 14- and 70-day HDT BR, respectively. Modified Amsler grid, red dot test, confrontational visual field, color vision, and stereoscopic fundus photography were unremarkable.
Conclusions
Seventy-day HDT BR induced greater peripapillary retinal thickening than 14-day HDT BR, suggesting that time may affect the amount of optic disc swelling. Spectralis OCT detected retinal nerve fiber layer thickening post BR, without clinical signs of optic disc edema. A small IOP increase during BR subsided post HDT BR. Such changes may have resulted from BR-induced cephalad fluids shift. The HDT BR duration may be critical for replicating microgravity-related ophthalmologic changes observed in astronauts on ≥6-month spaceflights.
Keywords: bed rest, intraocular pressure, microgravity, optic disc, Spectralis OCT
Gravity is a unique environmental factor that has shaped life on Earth, thus playing an important evolutionary role.1,2 Being under the influence of the force of gravity lifelong implies that transient exposure to the microgravity environment of outer space may alter the body homeostasis. The experience gained during the past 55 years of manned space travel indicates that, to some extent, the organism can adapt to and operate in microgravity.3 However, long-duration space missions may pose serious threats to human health. For example, ocular abnormalities including optic nerve sheath distension with signs of optic disc edema, posterior globe flattening with hyperopic shift, choroidal folds, and cotton wool spots have been reported in several astronauts who spent 6 months or more in orbit.4–6 In some cases, such changes resulted in significant visual impairment. The underlying pathophysiologic mechanisms are yet to be characterized. It has been hypothesized that increased intracranial pressure (ICP) secondary to microgravity-induced cephalad fluids shift may be responsible for these findings in predisposed individuals, hence the name “visual impairment intracranial pressure syndrome.”7,8
Prolonged head-down-tilt bed rest produces cephalad fluids shift and other changes, such as bone demineralization, muscle loss, reduced metabolic needs, and decreased sensory stimulation. Body resting in this position has long been used on Earth to simulate the effects of microgravity in humans and evaluate potential countermeasures to the physiological changes in space.9,10 However, the effects of sustained bed rest on ocular structures and visual function are largely unknown. Most studies have evaluated the acute ocular responses to postural changes, with emphasis on intraocular pressure (IOP) variations.6,11 More recently, a few ocular changes including retinal nerve fiber layer (RNFL) thickening without signs of optic disc edema have been described in healthy subjects who spent 14 consecutive days in a 6° head-down-tilt position.12 It is conceivable that longer bed rest durations may lead to ophthalmologic changes of greater magnitude. However, available bed rest studies have shown conflicting results, possibly explained by substantial differences in ocular testing protocols, instrumentation, and bed rest conditions (e.g., different angles of body tilt).6 Therefore, the purpose of the present investigation was to compare ocular structural and functional changes in healthy human subjects who underwent 14- and/or 70-day head-down-tilt bed rest in the same setting under standardized NASA bed rest conditions and measures.9 We hypothesized that the magnitude of ocular changes induced by bed rest would be affected by the time spent in the recumbent position.
Methods
Two separate, multidisciplinary bed rest studies (14- and 70-day bed rest, respectively) were conducted at the NASA Flight Analogs Research Unit (FARU), located at The University of Texas Medical Branch at Galveston (UTMB), Galveston, Texas. The studies were approved by the NASA Johnson Space Center and the UTMB Institutional Review Boards, and all methods adhered to the tenets of the Declaration of Helsinki and the Health Insurance Portability and Accountability Act. In each study, written informed consent to participate was obtained from the participants after explanation of the nature and possible consequences of the study.
Subject qualification criteria and bed rest conditions were comparable for both studies and are detailed elsewhere,9 thus we combined the relevant data from both for the purposes of this research. In brief, to qualify for participation, subjects passed extensive physical and psychological examinations. A standardized diet, based on the NASA space flight nutritional requirements, was provided throughout each study. To ensure nutritional intake, subjects were required to consume all food served to them.13 In addition, they adhered to a strict sleep/wake schedule and did not nap during the day, with lights turned on at 6 AM and turned off at 10 PM. Subject health was monitored by the attending physician and nursing staff 24 hours a day for the entire duration of each study.
To become acclimated to the FARU, participants spent 13 days in the pre–bed rest phase, in which they were ambulatory and underwent baseline assessment of their nutritional, cardiovascular, neurologic, and fitness status. The in-bed phase consisted of either 14 or 70 consecutive days of bed rest at 6° head-down-tilt, the NASA standardized position for bed rest studies.14 All daily activities, including showering and toileting, were performed in this position.9 Finally, subjects were ambulatory and remained at the FARU for 7 or 14 more days post bed rest, based on the duration of the study, to collect poststudy measures and receive rehabilitation to compensate for the deconditioning that occurs after prolonged bed rest.
Ocular Examinations
The ophthalmologic procedures and test operators were common to both studies. Subjects were evaluated on a weekly basis throughout the duration of each bed rest campaign. Specifically, pre– and post–bed rest ocular examinations were conducted in the sitting position at the UTMB University Eye Center; in-bed ocular examinations were performed in the 6° head-down-tilt position at the FARU. All ocular examinations followed the same sequence of testing and were performed at approximately the same time in the morning to account for the potential effects of circadian variations on our outcomes, particularly IOP. Ocular testing included best-corrected visual acuity (BCVA), modified Amsler grid test, red dot test, confrontational visual field, color vision (Hardy-Rand-Rittler plates), IOP measurement, and cycloplegic autorefraction (Retinomax K-plus 3; Right Mfg. Co., Ltd., Tokyo, Japan). Pre– and post–bed rest visits comprised also stereoscopic color fundus photography and spectral-domain optical coherence tomography (SD-OCT) scans of the macula and the optic disc.
Instrumentation
Early Treatment Diabetic Retinopathy Study (ETDRS) charts (Precision Vision, La Salle, IL, USA) were used to assess monocular near BCVA. A standardized protocol was followed: after manifest refraction, subjects were required to consecutively identify the optotypes of each chart line from the left to the right, starting from the top line. There were no termination criteria; rather, the number of optotypes correctly identified was recorded and converted to logMAR units for further evaluation.
Goldmann applanation tonometry (GAT) was performed pre and post bed rest by two operators in a masked, standardized fashion: the tonometer dial was covered to eliminate potential bias from knowing prior IOP values. The dial was reset and the IOP recorded by the second operator. In addition, for reproducible measurements, contact between the inner edges of the fluorescein bands was achieved at the systolic peak of the cardiac cycle. To account for interoperator differences, in each eye the mean of the two operators' IOP was considered.
Handheld tonometry was performed by using iCare (Icare Finland Oy, Espoo, Finland). In each eye, the mean of four consecutive measurements obtained on the same visit was considered. In-bed IOP was measured with subjects maintaining a 6° head-down-tilt while assuming a right and left lateral decubitus position for assessment of the left and the right eye IOP, respectively. To account for IOP changes possibly induced by transitioning from the supine to the lateral decubitus position,15 in each eye a minimum 5-minute interval was given before starting the measurements. At baseline, iCare was not available for the first 5 subjects and 1 subject enrolled in the 14- and 70-day bed rest campaigns, respectively. Therefore, in these subjects handheld tonometry was performed at all time points by using Tonopen (Reichert, Inc., Depew, NY, USA). Tonopen and iCare were not considered interchangeable for the purpose of the analysis.
The SD-OCT scans were obtained by using Spectralis OCT (software version 5.1.3.0; Heidelberg Engineering, GmbH, Heidelberg, Germany). The Volume Scan acquisition protocol (512 A-scans × 19 B-scans) was used to analyze a 20 × 15° area centered to the macula and the optic disc, respectively. After scan acquisition, the software automatically places an ETDRS grid in the center of the fundus image for evaluation of the retinal thickness. As the diameter of the external circle exceeded the scan area, only the retinal thickness measures from the central and inner sectors of the ETDRS grid were considered, consistent with previous bed rest studies.12,16 The Circle Scan protocol was used to obtain circumpapillary RNFL thickness measurements. All Spectralis OCT follow-up scans were obtained by using the AutoRescan feature. This feature uses a retinal map created by a real-time eye tracking system that combines confocal scanning laser ophthalmoscopy and SD-OCT scans to compensate for eye movements, allowing for automatic placement of the follow-up scans in the same location as baseline. All Spectralis OCT funduscopic images were evenly illuminated with signal-to-noise ratio > 15 dB, the minimum quality score as per manufacturer's recommendation.
Statistical Analysis
All statistical analyses were conducted by using Stata (software version 14.0; StataCorp LP, College Station, TX, USA).
Our primary outcomes included near BCVA, spherical equivalent, GAT and iCare IOP, and Spectralis OCT peripapillary retinal thickness, average RNFL thickness, and macular thickness, all of which are continuously scaled and assumed to follow a normal distribution in the population. The main outcome measures were collected in the two eyes of each subject, pre and post bed rest, and in the two bed rest campaigns, resulting in a 2 × 2 × 2 mixed factorial experimental design. These outcomes were fit to separate mixed-effects linear models using Stata's mixed command syntax, with fixed parameters evaluating the pre– versus post–bed rest main effect, the 14- vs. 70-day bed rest campaign main effect, and the interaction effect that evaluated whether the 14-day pre/post delta differed significantly from the 70-day pre/post delta. Each model included random intercept terms for subject and eye to accommodate our repeated observations within person (left/right eye) and over time (pre/post bed rest). Close examinations of model residuals revealed a few overly influential outliers that had to be eliminated to meet the statistical assumptions, which are described below per outcome.
Results
Baseline demographic characteristics of the participants are summarized in Table 1. Mean pre– and post–bed rest ophthalmologic data are presented in Table 2.
Table 1.
Baseline Demographic Characteristics of the Participants
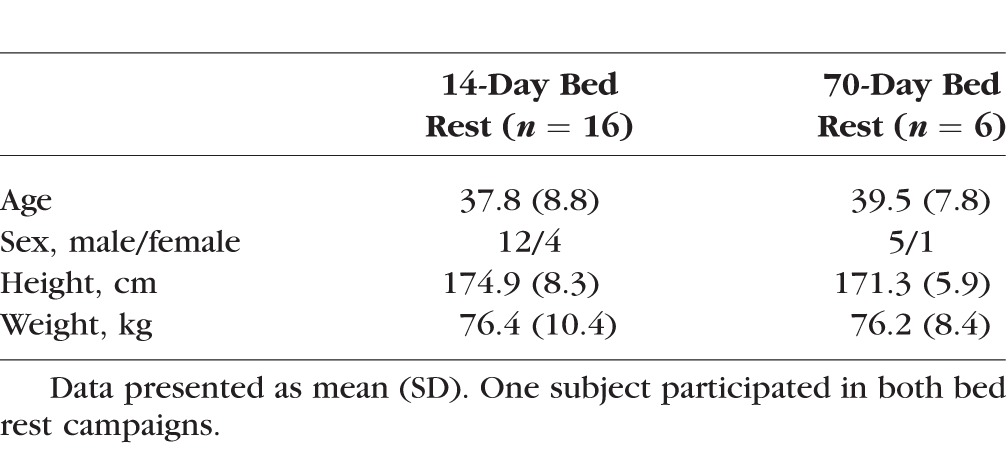
Table 2.
Pre– and Post–Bed Rest Ophthalmologic Data
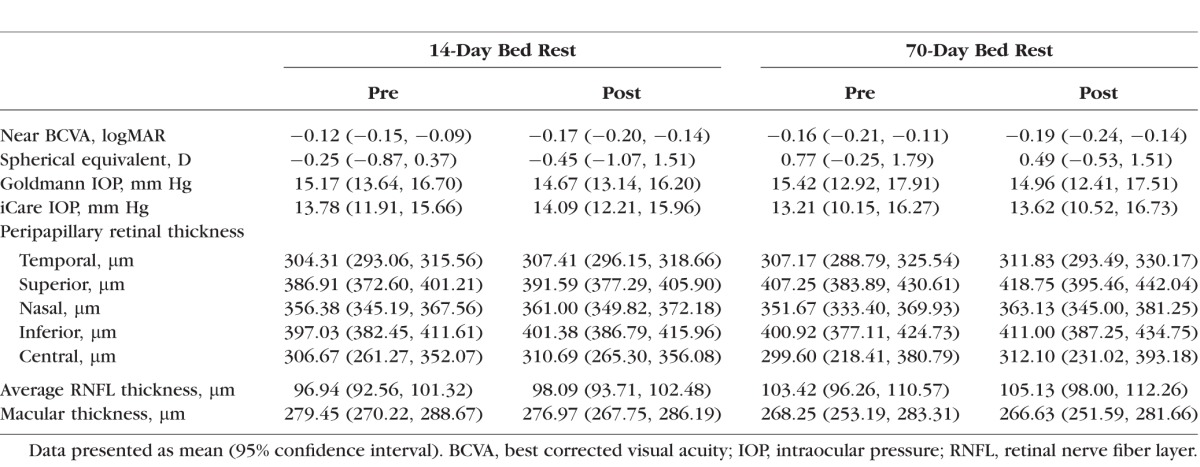
In both studies, measures of modified Amsler grid test, red dot test, confrontational visual field, and color vision were within normal limits in the two eyes of each subject at all time points. No qualitative changes from baseline were detected on stereoscopic color fundus photography.
Near BCVA and Spherical Equivalent
Overall, logMAR and spherical equivalent decreased both during and after bed rest (all P's < 0.001). However, we did not find differences in either near BCVA or spherical equivalent between the 14- and 70-day bed rest campaigns overall (P's = 0.14 and 0.09, respectively), nor did we uncover interaction effects, suggesting that the magnitude of changes during bed rest was not different between the two campaign durations (P's = 0.25 and 0.93, respectively).
Intraocular Pressure
Intravisit GAT and iCare IOP repeated measurements were highly reproducible in both campaigns. For iCare IOP, the intraclass correlation coefficient (ICC), a variability measure, was 0.98 in the 14-day bed rest study and 0.97 ≤ ICC ≤ 0.99 in the 70-day study; and for GAT IOP, 0.94 ≤ ICC ≤ 0.96 in the 14-day bed rest study and 0.82 ≤ ICC ≤ 0.97 in the 70-day study.
Analysis of GAT IOP failed to reveal significant effects of bed rest, campaign, or the interaction effect (P's = 0.18, 0.87, and 0.95, respectively).
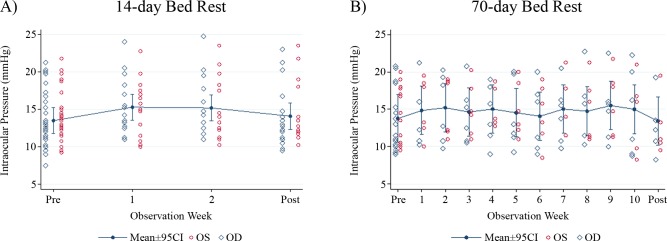
Figure 1 shows mean iCare measures for the two cohorts. There was an overall increase in iCare IOP during bed rest (+1.42 mm Hg, P < 0.01), but no differences from baseline were observed post bed rest (P = 0.46). We did not find differences between the 14- and 70-day bed rest campaigns overall (main effect P = 0.75), nor did we uncover interaction effects, suggesting that the magnitude of the increase in iCare IOP during bed rest was not different between the two campaign durations (+1.42 mm Hg versus +1.79 mm Hg for the 14- and 70-day bed rest campaigns, respectively; P = 0.64).
Figure 1.
iCare intraocular pressure plots for the 14- and 70-day bed rest campaigns. Error bars represent the 95% confidence interval of the mean.
Spectralis OCT
Peripapillary Retinal Thickness.
In the temporal sector, analysis revealed an overall increase in peripapillary retinal thickness post bed rest (P < 0.01), but the campaign and interaction effects were not significant (P's = 0.80 and 0.19, respectively). However, significant interactions were found in the superior, nasal, and inferior peripapillary regions (P's < 0.01), indicating that in these sectors the magnitude of peripapillary retinal thickening post bed rest was greater in the 70-day bed rest campaign (Table 3). Finally, in the central sector, analysis failed to reveal significant effects of bed rest, campaign, or the interaction effect (P's = 0.12, 0.88, and 0.08, respectively).
Table 3.
Pre/Post–Bed Rest Peripapillary Retinal Thickness Deltas
Average RNFL Thickness and Macular Thickness.
Overall, average RNFL thickness increased (P = 0.002), while macular thickness decreased from baseline (P < 0.01). For both outcomes, we did not find differences between the 14- and 70-day bed rest campaigns overall (P's = 0.13 and 0.21, respectively), nor did we uncover interaction effects, suggesting that the magnitude of changes post bed rest was not different between the two campaign durations (P's = 0.39 and 0.40, respectively).
Discussion
This study compared ocular outcomes between 14- and 70-day head-down-tilt bed rest. In general, there was a significant effect of bed rest for most of the structural and functional outcomes analyzed, with no differences in the magnitude of changes between the two bed rest durations. However, 70-day bed rest induced greater peripapillary retinal thickening, indicating that the time spent in the head-down-tilt position may affect the degree of optic disc swelling.
Our analysis showed an overall improvement in near BCVA, which likely resulted from a learning effect rather than an actual gain in visual acuity. In fact, subjects' vision was evaluated on a weekly basis with identical test conditions and ETDRS charts, thereby increasing the likelihood of learning over time. However, direct comparison with a control group of ambulatory subjects is needed to confirm this hypothesis. As healthy individuals with no preexisting ocular conditions were enrolled, near BCVA soon reached a plateau and could not increase further, thus explaining the lack of difference in the amount of change in logMAR between the two campaigns.
The increase in near BCVA was accompanied by an overall reduction in spherical equivalent, as obtained by cycloplegic autorefraction. In microgravity and conceivably during prolonged head-down-tilt bed rest, the presence of longstanding hydrostatic forces against the posterior eye could potentially result in some degree of globe flattening with hyperopic shift. Instead, there was a small myopic shift that persisted post bed rest. It should be noted that subjects were not allowed to nap during the day; therefore, they occupied a significant portion of their daily schedule doing recreational activities (e.g., laptop or TV use, reading, drawing, painting), when not involved in research testing. This may explain the observed refractive change, since it is well established that sustained nearsighted work may lead to transient myopia.17,18
As expected, iCare IOP increased during bed rest, in agreement with the literature showing raised IOP when the body moves from the sitting to the supine or reclined position.11 Our results also indicated that the amount of in-bed IOP elevation was not different between 14- and 70-day bed rest (+1.42 mm Hg and +1.79 mm Hg increase in iCare IOP from baseline, respectively). Compensatory mechanisms may have taken place to stabilize the IOP at a new level throughout bed rest (Fig. 1). It has yet to be determined whether the primary IOP regulation mechanism during prolonged head-down-tilt consisted in decreased aqueous humor production, increased outflow, or both. However, it has been recently shown the ability of the trabecular meshwork cells to sense IOP changes through the movement of their primary cilia and subsequent activation of signal transduction pathways.19 Finally, the return to baseline IOP levels post bed rest, as confirmed by GAT and iCare analyses, suggests the cessation of compensatory mechanisms upon reestablishment of the ambulatory regimen.
Spectralis OCT detected superior, nasal, and inferior peripapillary retinal thickening, which was greater after 70-day bed rest. Peripapillary retinal thickness also increased temporally, but the amount of change from baseline was not different between the two campaigns. This is not surprising, as the temporal region tends to be involved late in the optic disc swelling process.20,21 In our scans, the ETDRS grid was centered to the optic disc; thus, a large portion of the central sector hosted the optic disc cup. In this sector, the small number of data points may have affected the ability of Spectralis OCT algorithm to detect retinal thickness changes over time.
Overall, peripapillary retinal thickening may have resulted from a deregulation of the fine pressure balance across the lamina cribrosa (i.e., the IOP on the “ocular side” and the ICP on the “brain side”).22 Intracranial pressure may have increased more than IOP in the head-down-tilt position, thus leading to stasis of the retinal nerve fibers axoplasmic flow followed by optic disc swelling.23 Research is needed to confirm this hypothesis, as ICP could not be estimated in our subjects.
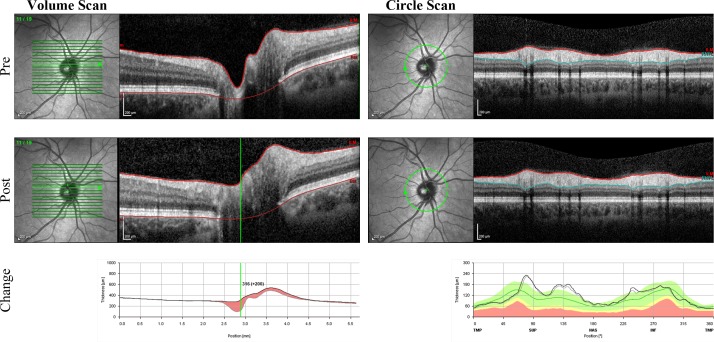
Interestingly, analysis also displayed increased average RNFL thickness, although the amount of change from baseline was not different between 14- and 70-day bed rest (+1.15 μm and +1.71 μm, respectively). As the inner sectors of the ETDRS grid are adjacent to the optic disc margins, they may be more sensitive for detecting early signs of optic disc swelling than the circle scan, which provides only RNFL thickness measures (Fig. 2). Nevertheless, it is expected that greater RNFL thickening, possibly induced by longer bed rest durations, would be captured by Spectralis OCT circle scan.
Figure 2.
Pre/post–bed rest Spectralis OCT Volume Scan (left) and Circle Scan (right) from a sample eye of the 70-day bed rest campaign. Post–bed rest structural changes on the circle scan are minimal (+5 μm [+4.5%] increase in average retinal nerve fiber layer thickness from baseline) but appear more pronounced at the level of the optic disc (see the OCT tomograms and the thickness profile plots).
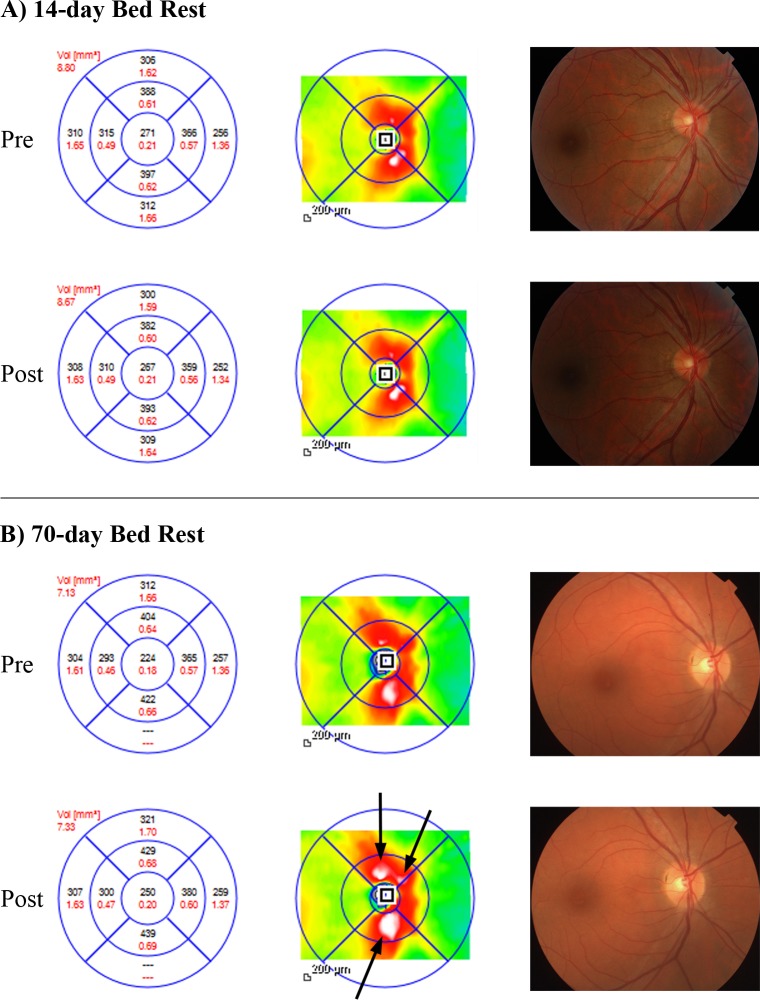
Our results indicate time as a determinant of the amount of optic disc swelling in the 6° head-down-tilt position. This is exemplified in Figure 3, showing pre/post–bed rest Spectralis OCT peripapillary retinal thickness measures of a sample eye from each bed rest campaign. Minimal structural changes occurred after 14-day head-down-tilt bed rest (Fig. 3A); instead, peripapillary retinal thickening following 70-day bed rest is clearly noticeable on the thickness map as an enlargement of the white regions, representing the areas of greatest retinal thickness (Fig. 3B). However, it should be emphasized that the availability of only 14- and 70-day bed rest data does not allow characterizing the pattern of optic disc changes over time (e.g., linear, exponential, other). Therefore, our results should not be used to predict the amount of peripapillary retinal thickening at arbitrary bed rest durations. In addition, the adoption of safety measures to the head and neck may have mitigated the effects of prolonged bed rest on our outcomes. First, the resting pillow may have slightly reduced the angle of head-tilt relative to the body. Second, subjects were allowed to elevate their head on the elbow to prevent choking hazard during meals consumption. However, Spectralis OCT was able to identify microstructural optic disc and RNFL thickness changes that would have remained undetected by ophthalmologic examination or color stereophotograph assessment (Fig. 3).
Figure 3.
Pre/post–bed rest Spectralis OCT peripapillary retinal thickness (left, black) and volume (left, red), retinal thickness map (middle), and color fundus photography (right) of two sample eyes from the 14- and the 70-day bed rest campaigns. After 14-day bed rest (A), Spectralis OCT displays minimal changes. Instead, peripapillary retinal thickening (mean increase from baseline: +18 μm [+5.3 %]) following 70-day head-down-tilt bed rest is visible on Spectralis OCT retinal thickness map as an enlargement of the white areas ([B] arrows). In both case examples, no changes are detectable on color fundus photography after bed rest.
Along with the duration of bed rest, the angle of tilt is another potential factor affecting the magnitude of posture-induced ophthalmologic changes. For example, it appears to correlate with the amount of IOP elevation; that is, the steeper the angle, the higher the IOP elevation.11 Thus, the combined interaction of the time spent in the recumbent position and the angle of tilt on the ocular outcomes should be systematically evaluated. The clinical relevance is not confined to aerospace medicine or ophthalmology. In fact, steep Trendelenburg positioning (approximately 30°–40° head-down-tilt) is routinely adopted in many nonophthalmic fields, such as obstetrics/gynecology, urology, and spine surgery. It is estimated that approximately 570,000 robot-assisted surgical procedures were performed worldwide in 2014 with the da Vinci Surgical System (Intuitive Surgical, Inc., Sunnyvale, CA, USA), which typically requires several hours of steep Trendelenburg.24 Moreover, complete body inversion (headstand posture) is assumed by several yoga practitioners, some of whom displayed marked IOP elevation and/or visual field deterioration.25,26 Therefore, it would be important to estimate the individual risk of visual impairment associated with the time spent in head-down-tilt at a given angle.
The bed rest platform may also be used to evaluate potential countermeasures to reduce the risk of posture-induced ocular changes. For example, two recent studies27,28 have shown attenuated IOP responses to head-down-tilt by assuming a modified steep Trendelenburg position (i.e., abdomen and thorax in reclined tilt while the head and shoulders are maintained horizontal), or after 10-minute exposure to lower body negative pressure. Future studies should determine whether lower limb physical exercise during bed rest, similarly to lower body negative pressure, might counteract cephalad fluids shift and effectively reduce the ocular effects of postural changes.
Our research has limitations. First, prolonged head-down-tilt bed rest produces cephalad fluids shift but does not perfectly replicate outer space, as it cannot completely eliminate the gravitational forces on the body. However, both campaigns were conducted in a controlled environment with standardized bed rest conditions and measures. In addition, subjects were evaluated by using clinical instrumentation that could not be easily carried or operated aboard the International Space Station (ISS), such as GAT or the stereoscopic ophthalmic camera. Experimental conditions that more closely replicate the ISS environment, such as continuous 0.5% CO2 exposure, are being implemented for future bed rest studies.29
Second, post–bed rest visits occurred on the third day out of bed owing to rigid protocol constraints. However, earlier assessments, such as on the first day post bed rest, may reveal greater changes to the optic disc or the RNFL, possibly strengthening our findings.
In conclusion, 70-day bed rest induced greater peripapillary retinal thickening than 14-day bed rest, suggesting that the time spent in the 6° head-down-tilt position may affect the amount of optic disc swelling. In addition, Spectralis OCT detected a slight increase in RNFL thickness post bed rest; however, there were no visible signs of optic disc edema. Such changes may have occurred in response to cephalad fluids shift induced by bed rest. Overall, 6° head-down-tilt determined a small nonprogressive increase in IOP that subsided post bed rest. This study suggests that the duration of bed rest may be critical for replicating microgravity-related ophthalmologic changes observed in astronauts involved in long-duration (≥6 months) spaceflights. Further research is necessary to elucidate the interaction between the duration of bed rest and the angle of tilt for the study of space-related ocular changes and to evaluate potential countermeasures aimed at preventing or mitigating the risk of visual impairment in space.
Acknowledgments
Supported by NASA Flight Analogs Project 516724.03.04.01; National Institutes of Health/National Center for Research Resources 1UL1RR029876-01. Supported in part by an unrestricted grant from Research to Prevent Blindness (RPB) to the University of Texas Medical Branch, Galveston, Texas, United States.
Disclosure: G. Taibbi, None; R.L. Cromwell, None; S.B. Zanello, None; P.O. Yarbough, None; R.J. Ploutz-Snyder, None; B.F. Godley, None; G. Vizzeri, None
References
- 1. Dubinin NP,, Vaulina EN. The evolutionary role of gravity. Life Sci Space Res. 1976; 14: 47–55. [PubMed] [Google Scholar]
- 2. Morey-Holton ER. 9 - The impact of gravity on life. : Lister LJRM, Evolution on Planet Earth. London: Academic Press; 2003: 143–159. [Google Scholar]
- 3. Nicogossian AE,, Parker JF. Space Physiology and Medicine (NASA SP-447). Washington DC: US Government Printing Office; 1982. [Google Scholar]
- 4. Kramer LA,, Sargsyan AE,, Hasan KM,, Polk JD,, Hamilton DR. Orbital and intracranial effects of microgravity: findings at 3-T MR imaging. Radiology. 2012; 263: 819–827. [DOI] [PubMed] [Google Scholar]
- 5. Mader TH,, Gibson CR,, Pass AF,, et al. Optic disc edema, globe flattening, choroidal folds, and hyperopic shifts observed in astronauts after long-duration space flight. Ophthalmology. 2011; 118: 2058–2069. [DOI] [PubMed] [Google Scholar]
- 6. Taibbi G,, Cromwell RL,, Kapoor KG,, Godley BF,, Vizzeri G. The effect of microgravity on ocular structures and visual function: a review. Surv Ophthalmol. 2013; 58: 155–163. [DOI] [PubMed] [Google Scholar]
- 7. Fogarty JA,, Otto C,, Kerstman E,, Oubre C,, Wu J. The Visual Impairment Intracranial Pressure Summit Report. Houston TX: National Aeronautics and Space Administration, Lyndon B; Johnson Space Center; 2011. [Google Scholar]
- 8. Alexander DJ,, Gibson RC,, Hamilton DR,, et al. Risk of Spaceflight-Induced Intracranial Hypertension and Vision Alterations. Human Research Program, Human Health Countermeasures Element Evidence Report. Houston, TX: National Aeronautics and Space Administration, Lyndon B; Johnson Space Center; 2012. [Google Scholar]
- 9. Meck JV,, Dreyer SA,, Warren LE. Long-duration head-down bed rest: project overview vital signs, and fluid balance. Aviat Space Environ Med. 2009; 80: A1–A8. [DOI] [PubMed] [Google Scholar]
- 10. Pavy-Le Traon A, Heer M, Narici MV, Rittweger J, Vernikos J. From space to earth: advances in human physiology from 20 years of bed rest studies (1986-2006). Eur J Appl Physiol. 2007; 101: 143–194. [DOI] [PubMed] [Google Scholar]
- 11. Prata TS,, De Moraes CG,, Kanadani FN,, Ritch R,, Paranhos A,, Jr. Posture-induced intraocular pressure changes: considerations regarding body position in glaucoma patients. Surv Ophthalmol. 2010; 55: 445–453. [DOI] [PubMed] [Google Scholar]
- 12. Taibbi G,, Cromwell RL,, Zanello SB,, et al. Ocular outcomes evaluation in a 14-day head-down bed rest study. Aviat Space Environ Med. 2014; 85: 983–992. [DOI] [PMC free article] [PubMed] [Google Scholar]
- 13. Inniss AM,, Rice BL,, Smith SM. Dietary support of long-duration head-down bed rest. Aviat Space Environ Med. 2009; 80: A9–A14. [DOI] [PubMed] [Google Scholar]
- 14. Human Research Program Flight Analogs Projects Information Package for Bed Rest Studies. 2012. Available at: https://www.nasa.gov/pdf/579501main_hrp_bed_rest_experiment_information_package.pdf. Accessed: December 1, 2015.
- 15. Malihi M,, Sit AJ. Effect of head and body position on intraocular pressure. Ophthalmology. 2012; 119: 987–991. [DOI] [PubMed] [Google Scholar]
- 16. Taibbi G,, Kaplowitz K,, Cromwell RL,, Godley BF,, Zanello SB,, Vizzeri G. Effects of 30-day head-down bed rest on ocular structures and visual function in a healthy subject. Aviat Space Environ Med. 2013; 84: 148–154. [DOI] [PMC free article] [PubMed] [Google Scholar]
- 17. Ciuffreda KJ,, Vasudevan B. Nearwork-induced transient myopia (NITM) and permanent myopia: is there a link? Ophthalmic Physiol Opt. 2008; 28: 103–114. [DOI] [PubMed] [Google Scholar]
- 18. Ong E,, Ciuffreda KJ. Nearwork-induced transient myopia: a critical review. Doc Ophthalmol. 1995; 91: 57–85. [DOI] [PubMed] [Google Scholar]
- 19. Luo N,, Conwell MD,, Chen X,, et al. Primary cilia signaling mediates intraocular pressure sensation. Proc Natl Acad Sci U S A. 2014; 111: 12871–12876. [DOI] [PMC free article] [PubMed] [Google Scholar]
- 20. Wall M. Idiopathic intracranial hypertension. Neurol Clin. 2010; 28: 593–617. [DOI] [PMC free article] [PubMed] [Google Scholar]
- 21. Schirmer CM,, Hedges TR. Mechanisms of visual loss in papilledema. Neurosurg Focus. 2007; 23: E5. [DOI] [PubMed] [Google Scholar]
- 22. Morgan WH,, Yu DY,, Balaratnasingam C. The role of cerebrospinal fluid pressure in glaucoma pathophysiology: the dark side of the optic disc. J Glaucoma. 2008; 17: 408–413. [DOI] [PubMed] [Google Scholar]
- 23. Hayreh SS. Pathogenesis of optic disc edema in raised intracranial pressure. Prog Retin Eye Res. 2016; 50: 108–144. [DOI] [PMC free article] [PubMed] [Google Scholar]
- 24. Intuitive Surgical Inc. Form 10-K. 2015. Available at: http://phx.corporate-ir.net/phoenix.zhtml?c=122359&p=irol-sec. Accessed: October 21, 2015.
- 25. Baskaran M,, Raman K,, Ramani KK,, Roy J,, Vijaya L,, Badrinath SS. Intraocular pressure changes and ocular biometry during Sirsasana (headstand posture) in yoga practitioners. Ophthalmology. 2006; 113: 1327–1332. [DOI] [PubMed] [Google Scholar]
- 26. Gallardo MJ,, Aggarwal N,, Cavanagh HD,, Whitson JT. Progression of glaucoma associated with the Sirsasana (headstand) yoga posture. Adv Ther. 2006; 23: 921–925. [DOI] [PubMed] [Google Scholar]
- 27. Raz O,, Boesel TW,, Arianayagam M,, et al. The effect of the modified Z trendelenburg position on intraocular pressure during robotic assisted laparoscopic radical prostatectomy: a randomized, controlled study. J Urol. 2015; 193: 1213–1219. [DOI] [PubMed] [Google Scholar]
- 28. Macias BR,, Liu JH,, Grande-Gutierrez N,, Hargens AR. Intraocular and intracranial pressures during head-down tilt with lower body negative pressure. Aerosp Med Hum Perform. 2015; 86: 3–7. [DOI] [PubMed] [Google Scholar]
- 29. Appendix E: Behavioral Health & Performance and Human Health Countermeasures Topic. Houston, TX: National Aeronautics and Space Administration, Johnson Space Center, Human Exploration and Operations Mission Directorate, Human Research Program; 2015. Available at: http://nspires.nasaprs.com/external/solicitations/summary.do?method=init&solId={FDCEA984-F985E984-982DA983- 984F984F-981496823C981496825B}&path=closedPast. Accessed October 21, 2015. [Google Scholar]


