

Abstract
A convenient and fast method for quantifying urea in biofluids is demonstrated using NMR analysis and the solvent water signal as a concentration reference. The urea concentration can be accurately determined with errors less than 3% between 1 mM and 50 mM, and less than 2% above 50 mM in urine and serum. The method is promising for various applications with advantages of simplicity, high accuracy, and fast non-destructive detection. With an ability to measure other metabolites simultaneously, this NMR method is also likely to find applications in metabolic profiling and system biology.
Introduction
Urea is one of the crucial nitrogen-containing metabolites in biological systems. In humans, the synthesis of urea is the main route for the removal of waste nitrogen, which is generated by protein and amino acid metabolism.1 This process takes place in the liver via the urea cycle. Urea is then removed from the blood and excreted into urine by the kidneys. Both the production and regulation of urea are closely correlated to various metabolic processes such as protein and amino acid metabolism, the urea cycle, arginine and proline metabolism,2,3 urea hydrolysis,4 as well as ammonia and glutamine metabolism.5 The normal range of urea is 2.6 to 6.5 mM in human blood,6 and can be 50-fold more concentrated with high variation in human urine (daily excretion of 342 ± 67 mmol in 490 to 2690 mL urine).6–8 Abnormal urea levels are often indicators of various metabolic diseases including liver disease,9 renal disease, hereditary urea cycle abnormalities (argininosuccinic aciduria10 for example), heart failure11,12 or dietary problems.13
Urea quantification in both urine and blood is of significant clinical interest. Since the 1960’s scientists have used chemical reaction coupled colorimetric and fluorometric detection methods to determine urea in blood.14–17 The urease-catalysed hydrolysis coupled methods such as the modified Berthelot reaction are widely used for modern clinical urea measurements.18 Since these methods depend on the measurement of ammonia formed by urea hydrolysis, experimental error can be introduced by both external sources of ammonia such as glassware contamination, atmosphere, reagents, and endogenous ammonia which increases in human plasma with storage time.19,20 Other interferences also affect the measurement accuracy, including: stray light; streptomycin sulfate (STR), which is one of the reagents but also inhibits the consecutive ammonia reactions;21 and ions that inhibit urease activity, such as sodium, potassium or fluoride.18 The presence of bacterial urease and excreted ammonia in urine limits the accurate urea determination in urine;18,22 nevertheless, urine is an easily obtained bio-fluid for the non-invasive and convenient diagnosis for disease.23 In the last decades, various polymer based urea biosensors have been implemented to determine urea concentrations.24 However, these measurements are based on urea hydrolysis catalyzed by immobilized urease; hence, the urease activity and ammonia contamination issues are still present. In addition, most of the urea sensors provide narrow detection limits in different concentration ranges.24 In the Fearon reaction method, urea reacts with diacetyl monoxime directly; however, thiourea, nitrite, thiosulfate as well as various reducing agents may interfere.18 Furthermore, all these methods require a number of chemical reagents, and multiple steps of sample preparation. Finally, the linear quantification limit is approximately 30 mM, and therefore requires significant sample dilution. Given the broad range of urea concentrations in biofluids, an improved concentration determination method is desirable.
A number of advanced analytical techniques are capable of measuring urea directly while avoiding the introduction of interfering substances. Mass spectrometry approaches have been used to quantify urea to achieve acceptable precision and accuracy (99.7~109.7%).25 For example, 13C-labelled urea in human serum has been analyzed by liquid chromatography-atmospheric pressure chemical ionization mass spectrometry (HPLC-APCI-MS) for helicobacter pylori infection diagnosis.25 13C-15N-labeled urea was used as an internal standard to quantify endogenous urea by gas chromatograph coupled MS.26 In these methods, a series of complex sample preparation steps including metabolite extraction, derivatization, and isotope labeling are typically required.
NMR can also be used to measure urea concentrations. NMR is an attractive analytical method because of its high reproducibility, simple sample preparation, non-destructive nature, rapid acquisition, and easy quantification for different compounds with a single internal standard.27,28 An NMR method was reported for urea quantification in 1987.29 However, this approach was conducted in DMSO and required an additional internal or external concentration reference. For bio-fluids, the interference of water due to its strong intensity and chemical exchange can potentially compromise the accuracy. In contrast, we present a method that utilizes the solvent water as the native internal concentration reference and demonstrate that a WET water suppression sequence with optimized selective pulses is sufficient to overcome the interference from water. This method is rapid and accurate (3% error or better) and does not require any special sample preparation.
Experimental methods
Chemicals and bio-fluid samples
Urea crystals were purchased from Mallinckrodt Baker (Paris, KY) with an assayed purity of 100.1%, and were used without further purification. Deuterium oxide (99.9% D) was purchased from Cambridge Isotope Labs (Andover, MA). The urine sample was collected from a healthy male volunteer. The human serum was obtained from Sigma Aldrich (St. Louis, MO), and stored at −80 °C until used.
Preparation of NMR samples
A series of aqueous samples were prepared with urea concentrations ranging from 1 mM to 0.5 M (Supplementary Table S1†). Two urea stock solutions were prepared by dissolving 0.3092 g and 0.3440 g urea crystals to make 25.0 ml and 5.00 ml aqueous solutions at room temperature, leading to stock solutions with urea concentrations of 0.206 M and 1.15 M, respectively. In each sample, the relative amount of urea stock solution was weighed and added to a volumetric flask. Urea solution densities of 1.0007 g ml−1 and 1.0138 g ml−1 for the 0.206 M and 1.15 M urea solutions, respectively, were used to calculate the final, diluted urea concentrations.30 The 0.206 M urea stock solution was used to prepare samples with final urea concentrations from 1 to 100 mM. The 1.15 M urea stock solution was used to make samples with 0.2 to 0.5 M urea. Phosphate buffer (PBS, 0.20 M) with pH = 7.50 was added to each sample to make the final buffer concentration equal to 0.05 M.31 D2O and distilled water were added so that the final D2O concentration was 5% (v/v; presence of small amount of deuterium in the solution has minimal impact to the urea quantitation as deuterium is distributed in urea and water in the same isotopic ratio). 500 μl of each sample was then transferred to a standard 5mm NMR tube for measurements.
For standard addition experiments, 1.245 g urea crystals were dissolved to make a 10.0 ml aqueous solution at room temperature resulting in a 2.07 M urea stock solution. Urine standard addition samples were prepared by spiking different amounts of the urea stock solution into weighed urine (Supplementary Table S2†). A urine density of 1.01 g ml−132–34 and urea solution density of 1.0304 g ml−130 were used for the calculations. 1.0 ml of 0.25 M PBS buffer (0.05 M final concentration) and 5% (v/v) D2O were added for pH adjustment and NMR field locking, respectively. Again, 500 μl of each sample was used for NMR measurements.
The serum sample was prepared by adding 25 μl D2O and 475 μl thawed human serum to an NMR tube.
NMR spectroscopy
All 1H NMR experiments were carried out on a Bruker DRX 500 MHz spectrometer equipped with a z-gradient HCN 1H inverse detection probe at 25 °C. The acquisition time was 2.726 s and the sweep width was 12 ppm. Delays between acquisitions were sufficiently long (10~20s) for the magnetization to return to equilibrium. The receiver gain was fixed at 16 for all samples. The excitation pulse was calibrated at the beginning of the data acquisition for each sample. The urea signal was observed using a 90 degree pulse after executing a WET sequence for water suppression.35 The WET selective pulse length was optimized (to 4 ms for an 81.4 degree pulse) so that it had minimal RF impact on the adjacent urea signal while the pulse was still short enough to limit proton exchange with water. The water (concentration reference) and urea signals were observed under the same conditions, however the water signal was observed with a very small excitation angle pulse of around 3° and without any solvent suppression. All the samples were analyzed 3 times, except the most dilute sample, which was measured 9 times.
For each spectral measurement, multiple (8 to 512) FIDs were accumulated for phase cycling and sufficient signal to noise ratios. FIDs were then Fourier transformed after applying exponential line-broadening of 0.3 Hz. The spectra were phased manually. First order baseline correction was applied for the interesting signals. The spectral integrals for the urea NMR proton signal in the water suppressed spectrum, and the combined water and urea signal in the spectrum without any solvent suppression were obtained.
Urea concentration determination
The combined signal of water and urea was used as the concentration reference. As the receiver gain was fixed for both the urea and water observations, the relationship between the analyte concentration Ca and the reference Cs can be found from:
| (1) |
where, Aa and As are the NMR peak integrations (per scan) for the analyte of interest and the solvent, respectively.36 The excitation angle θa was calibrated by the nominal 360° method. The combined proton concentration of urea and water can be calculated as 111 M (with error less than 0.5%) based on known aqueous urea solution densities, as long as the urea concentration is below 0.5 M.30
Results
Urea aqueous solutions
Eight aqueous samples containing urea concentrations in the range of 1 to 500 mM were analyzed by NMR. Each NMR determined urea concentration was linearly regressed against the actual concentration. The correlation coefficient (R2) gives a result of 1.0000 (Fig. 1), indicating an excellent correlation between the NMR determined urea concentrations and the expected values across all eight solutions.
Fig. 1.
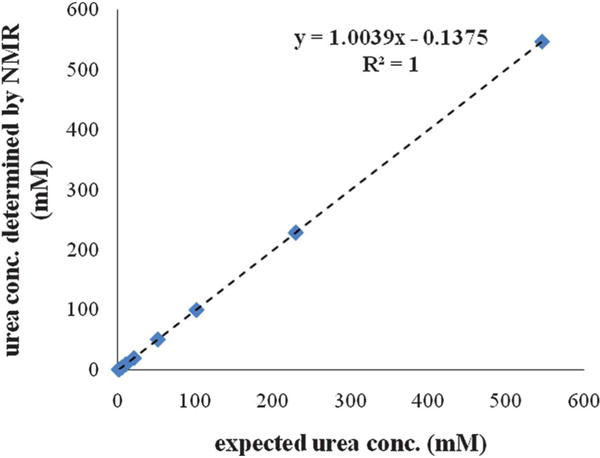
Urea concentrations determined by NMR for a series of synthetic urea solutions described in Table 1 that are plotted against the expected values. The dashed line shows the linear trendline across all measurements. The fitted equation and R-squared value are shown.
Both the NMR determined and the expected urea concentrations are listed in Table 1, together with the accuracy analysis showing the deviation of the measurement from the actual value. The first four samples were determined to be 1.04, 5.03, 9.93, and 20.3 mM, with the deviations from the expected concentrations of 2.7%, −2.9%, −1.2%, and −0.93%, respectively. The increased accuracy obtained for the latter solutions is presumably due to the larger signal-to-noise ratios at higher analyte concentrations. A further improvement in accuracy was also observed for the samples with urea concentrations higher than 50 mM. For urea concentrations of 51.29, 100.5, 229.4, and 547.0 mM, the observed errors were 0.31%, −0.30%, 0.37% and 0.37%, respectively.
Table 1.
Set of synthetic urea aqueous solutions used
| sample label | expected urea conc. (mM) | urea conc. determined by NMR (mM) | deviation from expected value (%) |
|---|---|---|---|
| 1 | 1.02 | 1.04 | 2.7 |
| 2 | 5.18 | 5.03 | −2.9 |
| 3 | 10.0 | 9.93 | −1.2 |
| 4 | 20.5 | 20.3 | −0.93 |
| 5 | 51.1 | 51.3 | 0.31 |
| 6 | 101 | 100 | −0.30 |
| 7 | 229 | 229 | 0.37 |
| 8 | 545 | 547 | 0.37 |
Each sample’s urea concentration was determined using the average of 3 independent measurements for both analyte and solvent, except for the sample with 1.02 mM urea, for which 9 measurements were obtained. To evaluate the potential experimental errors of our current method, an error analysis was conducted using the standard deviation of multiple measurements for each sample. The standard deviations for all 8 samples range from 0.02 mM to 0.40 mM (Supplementary Table 1), which corresponds to 2.6 to 0.023% for the coefficient of variation (CV).
Urea determination in human urine
A typical urea NMR peak in human urine is illustrated in Fig. 2, together with the combined water and urea proton signals used as the concentration reference. While the true urea concentration of bulk urine is unknown, we used the direct measurement and the standard addition method to determine the concentration.
Fig. 2.
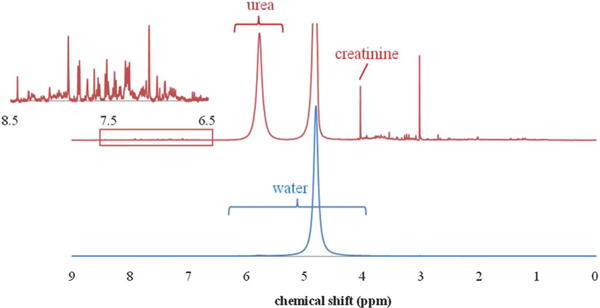
1H NMR spectrum of urea in human urine is dominated by the water signal (bottom). Expanded view (top) shows urea and other metabolites along with the large (attenuated) water signal. Inset shows additional metabolite signals in the aromatic region.
First, the urea concentration in a pure urine sample (Sample 1, Table 2) was directly measured by NMR. Simple integration of the urea signal after WET water suppression and comparison to the water signal (eqn (1)) resulted in a concentration of 127 mM for Sample 1, which corresponds to 256 mM in bulk urine. The CV of 3 independent measurements was found to be 0.22%.
Table 2.
Set of urine spike-in samples used for standard addition measurements
| sample no. | added urea (mM) | total urea determined by NMR (mM) | CV |
|---|---|---|---|
| 1 | 0 | 126.8 | 0.22% |
| 2 | 20.20 | 148.6 | 0.041% |
| 3 | 101.1 | 229.5 | 0.19% |
| 4 | 198.9 | 330.4 | 0.056% |
| 5 | 299.8 | 435.0 | 0.11% |
| 6 | 398.2 | 530.3 | 0.22% |
For the standard addition method, known amounts of urea were added to the above bulk urine sample (Supplemental Table S2†). The NMR determined urea concentrations were plotted against the added urea concentrations and a linear relationship was observed (Supplemental Figure 1). The determined concentration was 126 mM, which compares well with the result of 127 mM measured by the direct method described above, and the relative difference is very small (less than 1%). The direct measurement is preferred because it gives essentially the same result without the need for extra sample preparation or multiple sample measurements. This is not surprising, because best practices in NMR measurements result in linear detection of all signals, regardless of amplitude. In fact, a linear detection range of 7 orders of magnitude can be observed by NMR, as demonstrated in detecting proton concentrations from μM to more than 100 M.36 For NMR quantification purposes, the standard addition method offers no benefit other than confirmation of assignments. We note that our result of 256 mM urea in bulk urine is consistent with the range of 245 to 267 mM measured in normal human urine using a 13C {1H} NMR targeted profiling method.7
Urea in human serum
The broad signal at ~5.7 ppm in the serum NMR spectrum is mainly contributed by urea (Supplemental Figure 2). Potential sources of interference include arginine as a free metabolite or in proteins, and sugar anomeric proton signals. Though the guanidine group of arginine mimics urea structurally, its proton chemical shifts are typically located about 1 ppm further down field at about 7.3 ppm.37 A broad peak around 5.3 ppm, representing a –CH group of lipid in the serum 1H NMR spectrum can be well distinguished from urea signal.38 The glucose alpha-anomeric proton signal tends to be slightly shifted up-field (to less than 5.3 ppm) and has a characteristic scalar coupling pattern. Furthermore, if there is any evidence suggesting significant amounts of sugar in the sample, it can be quantitatively evaluated by NMR after urea and water suppression and subtracted from the urea signal integral or taken into account by applying a curve fitting analysis for accurate quantification. As such, we determined the urea concentration in bulk serum to be 2.93 mM with the CV of 0.54% based on 3 measurements using the direct measurement as described in the above section. This result is consistent with various literature reported ranges.6 Our value corresponds to the low end of the 2.6–6.5 mM range reported in the Geigy Scientific Tables6 and a similar range reported by N. Psychogios et al.,39 which may be caused by different separation or extraction methods used for obtaining “clean” serum.
Discussion
Urea is a crucial metabolite, which when present at abnormal levels in human bio-fluids frequently indicates pathological conditions such as renal disease, liver disease, heart failure or dietary problems. Blood urea nitrogen measurements have become part of a standard physical testing regime. Despite the available methods, an important and convenient method for direct urea determination with high accuracy over a broad range of concentrations would be beneficial. The NMR based urea quantification method reported here has high accuracy and good linearity over a wide concentration range from 1 mM to 500 mM in aqueous solution, which is beyond the range of 1.5~250 mM for biofluid samples reported in the literature. The method was validated in a urine sample by comparing the result with the one obtained from standard addition. The accuracy of more than 95% over the entire range, and CV of 0.2% indicates the method’s reliability. By comparison, the commercial blood urea nitrogen (BUN) test has a CV of 0.8% to 2%.40
The method proposed here does not require any additional reagents such as urease to facilitate the measurement, or any external reference such as isotope labeled compounds. Using only the solvent water as the concentration reference, the method is convenient and environmental friendly for laboratory measurements. In addition to essentially no sample preparation, the measurement is fast, taking less than 5 min per sample on average.
Furthermore, the method developed here should be suitable for urea quantification in other biofluid samples, such as cerebrospinal fluid and cellular cytoplasm. For those samples, the concentration of water is readily calculated with the sample density. Hence, our method is feasible and convenient to monitor the urea content in biofluids or biological samples in general for various biomedical applications.
Another merit of this method is the measurement of all other metabolites in a single NMR analysis simultaneously. For urine, the urea concentration is frequently reported as a ratio with the creatinine concentration. As creatinine can be directly measured by NMR (at 4.05 ppm, see Fig. 2), the strategy outlined in this study should be directly applicable to the creatinine concentration measurement. An added advantage is that some of the systematic errors in concentration determinations can be reduced. This is especially beneficial for researchers in metabolomics interested in exploring underlying disease mechanisms. Except for only a few studies,7,39,41,42 urea has mostly been overlooked in the NMR based metabolomics field since urea’s quantification is unreliable using “pre-saturation” water suppression methods. The pulse train in a typical hard pulse based WATERGATE water suppression sequence may negatively impact the urea signal due to lack of sufficient selectivity. In this study, we used WET for water suppression, and chose its pulses to be long enough so that it had sufficient selectivity to exert minimal impact on urea signal; on the other hand, it was still short enough so that proton exchange between water and urea could be ignored. We note that the urea water proton exchange rate is approximately 100 ms near pH = 7.43 We examined the effect of the WET selective pulse length between 1 and 10 ms, and verified that the urea signal was independent (less than 1% variation) of selective pulse length between 4 and 6 ms (total WET pulse train length of 10 to 30 ms), and chose a selective pulse length of 4 ms.
The interaction between the magnetization from sample molecules and induced current in RF coil were always small in our experiments. However, for strong signals in high magnetic field or cryo-probe NMR, these so-called “radiation damping” effects can be large, resulting in abnormally broadening of the signal (like water). In the present experiments we used a moderate field (500 MHz) magnet and conventional NMR probe, so that radiation damping does not pose serious problems to the accuracy of urea quantitation in this study. This approach also made the method more economical because we could avoid a more expensive high field spectrometer or cryo-probe technology. If the latter NMR systems are the only ones available or are preferred for other bio-fluid studies, a shorter flip angle for recording the solvent signal and an RF inhomogeneity factor I(θ) can be applied to minimize the impact of radiation damping.44
Conclusions
We propose a simple NMR method for urea concentration determination that uses the solvent as a concentration reference. This method is both precise and accurate with a demonstrated working range between 1 mM to 500 mM. This method is readily applicable to a variety of bio-fluids. We believe this approach will be promising for clinical measurements, and research areas such as metabolic profiling and system biology.
Supplementary Material
Acknowledgments
This work is supported in part by the NIH (GM 5R01GM085291), DOD (U.S. Army Medical Research and Command, (W81XWH-08-1-0065), Purdue University Center for Cancer Research and Oncological Sciences Center in Discovery Park at Purdue. The use of NMR instrumentation in the Purdue Interdepartmental NMR Facility is gratefully acknowledged.
Footnotes
Electronic supplementary information (ESI) available. See DOI: 10.1039/c2an15780b
References
- 1.Berg JM, T JL, Stryer L. Biochemistry. 6th. W.H.Freeman and Company; New York: 2007. Protein Turnover and Amino Acid Catabolism; pp. 649–678. [Google Scholar]
- 2.Ignarro LJ, Buga GM, Wei LH, Bauer PM, Wu G, del Soldato P. Role of the arginine-nitric oxide pathway in the regulation of vascular smooth muscle cell proliferation. Proc Natl Acad Sci U S A. 2001;98(7):4202–8. doi: 10.1073/pnas.071054698. [DOI] [PMC free article] [PubMed] [Google Scholar]
- 3.Wu G, Morris SM., Jr Arginine metabolism: nitric oxide and beyond. Biochem J. 1998;336(Pt 1):1–17. doi: 10.1042/bj3360001. [DOI] [PMC free article] [PubMed] [Google Scholar]
- 4.Young VR, El-Khoury AE, Raguso CA, Forslund AH, Hambraeus L. Rates of urea production and hydrolysis and leucine oxidation change linearly over widely varying protein intakes in healthy adults. J Nutr. 2000;130(4):761–6. doi: 10.1093/jn/130.4.761. [DOI] [PubMed] [Google Scholar]
- 5.Curthoys NP, Watford M. Regulation of glutaminase activity and glutamine metabolism. Annu Rev Nutr. 1995;15:133–59. doi: 10.1146/annurev.nu.15.070195.001025. [DOI] [PubMed] [Google Scholar]
- 6.Geigy Scientific Tables. 8th. Basle, Switzerland: Ciba-Geigy; 1981–1992. Rev ed. [Google Scholar]
- 7.Shaykhutdinov R, MacInnis G, Dowlatabadi R, Weljie A, Vogel H. Quantitative analysis of metabolite concentrations in human urine samples using 13C{1H} NMR spectroscopy. Metabolomics. 2009;5(3):307–317. [Google Scholar]
- 8.Taylor AJ, Vadgama P. Analytical reviews in clinical biochemistry: the estimation of urea. Ann Clin Biochem. 1992;29(Pt 3):245–64. doi: 10.1177/000456329202900301. [DOI] [PubMed] [Google Scholar]
- 9.Marescau B, De Deyn PP, Holvoet J, Possemiers I, Nagels G, Saxena V, Mahler C. Guanidino compounds in serum and urine of cirrhotic patients. Metab, Clin Exp. 1995;44(5):584–8. doi: 10.1016/0026-0495(95)90114-0. [DOI] [PubMed] [Google Scholar]
- 10.Brusilow SW. Arginine, an indispensable amino acid for patients with inborn errors of urea synthesis. J Clin Invest. 1984;74(6):2144–8. doi: 10.1172/JCI111640. [DOI] [PMC free article] [PubMed] [Google Scholar]
- 11.Thomas RD, Morgan B. Increased production of urea and heart failure. Br Med J. 1979;2(6193):795. doi: 10.1136/bmj.2.6193.795. [DOI] [PMC free article] [PubMed] [Google Scholar]
- 12.Aronson D, Mittleman MA, Burger AJ. Elevated blood urea nitrogen level as a predictor of mortality in patients admitted for decompensated heart failure. Am J Med. 2004;116(7):466–73. doi: 10.1016/j.amjmed.2003.11.014. [DOI] [PubMed] [Google Scholar]
- 13.Umesawa M, Yamagishi K, Sawachi S, Ikeda A, Noda H, Ikehara S, Cui R, Sakurai S, Tanigawa T, Iso H. Urea nitrogen concentrations in spot urine, estimated protein intake and blood pressure levels in a Japanese general population. Am J Hypertens. 23(8):852–8. doi: 10.1038/ajh.2010.54. [DOI] [PubMed] [Google Scholar]
- 14.Chaney AL, Marbach EP. Modified reagents for determination of urea and ammonia. Clin Chem. 1962;8:130–2. [PubMed] [Google Scholar]
- 15.Coulombe JJ, Favreau L. A new simple semimicro method for colorimetric determination of urea. Clin Chem. 1963;9:102–8. [PubMed] [Google Scholar]
- 16.Marsh WH, Fingerhut B, Miller H. Automated and Manual Direct Methods for the Determination of Blood Urea. Clin Chem. 1965;11:624–7. [PubMed] [Google Scholar]
- 17.Rej R. Clinical chemistry through Clinical Chemistry: a journal timeline. Clin Chem. 2004;50(12):2415–58. doi: 10.1373/clinchem.2004.042820. [DOI] [PMC free article] [PubMed] [Google Scholar]
- 18.Francis PS, Lewis SW, Lim KF. Analytical methodology for the determination of urea: current practice and future trends. TrAC, Trends Anal Chem. 2002;21(5):389–400. [Google Scholar]
- 19.Searle PL. The Berthelot or Indophenol Reaction and Its Use in the Analytical-Chemistry of Nitrogen - a Review. Analyst. 1984;109(5):549–568. [Google Scholar]
- 20.Prytz B, Grossi CE, Rousselo LM. In vitro Formation of Ammonia in Blood of Dog and Man. Clinical Chemistry. 1970;16(4):277–9. [PubMed] [Google Scholar]
- 21.Mitic SSM, Gordana Z, Kostic Danijela A, Rasic Ivana D. A Spectrophotometric Study of Streptomycin Effect on the Clinical Urea Determination. Chin J Chem. 2011;29(1):135–142. [Google Scholar]
- 22.Srivastava T, Althahabi R, Garg U. Measurement of urea nitrogen and creatinine concentrations in peritoneal dialysate and other body fluids using the Vitros analyzer. Clin Biochem. 2007;40(5–6):420–2. doi: 10.1016/j.clinbiochem.2006.12.009. [DOI] [PubMed] [Google Scholar]
- 23.Adamko DJS, Eric Brian Rowe, Sykes Brian, Moqbel . Redwan A method of diagnosing a respiratory disease PCT Int Appl. 2010. (WO 2010020058 A1 20100225). [Google Scholar]
- 24.K D, Ahuja Tarushee, Rajesh Polymer Based Urea Biosensors: A Brief Overview. Sens Lett. 2008;6(5):663–674. [Google Scholar]
- 25.Tanigawa T, Mizo-oku Y, Moriguchi K, Suzuki T, Osumi T, Odomi M. Simple and rapid quantitative assay of 13C-labelled urea in human serum using liquid chromatography-atmospheric pressure chemical ionization mass spectrometry. J Chromatogr, Biomed Appl. 1996;683(2):135–42. doi: 10.1016/0378-4347(96)00115-6. [DOI] [PubMed] [Google Scholar]
- 26.Kessler A, Siekmann L. Measurement of urea in human serum by isotope dilution mass spectrometry: a reference procedure. Clin Chem. 1999;45(9):1523–9. [PubMed] [Google Scholar]
- 27.Zhang S, Nagana Gowda GA, Ye T, Raftery D. Advances in NMR-based biofluid analysis and metabolite profiling. Analyst. 2010;135(7):1490–8. doi: 10.1039/c000091d. [DOI] [PMC free article] [PubMed] [Google Scholar]
- 28.Malet-Martino M, Holzgrabe U. NMR techniques in biomedical and pharmaceutical analysis. J Pharm Biomed Anal. 2011;55(1):1–15. doi: 10.1016/j.jpba.2010.12.023. [DOI] [PubMed] [Google Scholar]
- 29.Main KB, Medwick T, Bailey LC, Shinkai JH. Quantitative analysis of hydroxyurea and urea by proton nuclear magnetic resonance (NMR) spectroscopy. Pharm Res. 1987;4(5):412–5. doi: 10.1023/a:1016490430135. [DOI] [PubMed] [Google Scholar]
- 30.Holden NE. Concentration properties of aqueous solutions: density, refractive index, freezing point depression, and viscosity. In: Lide DR, editor. CRC handbook of chemistry and physics. 91st. CRC press; Boca Raton, FL: 2011. [Google Scholar]
- 31.Asiago VM, Gowda GAN, Zhang S, Shanaiah N, Clark J, Raftery D. Use of EDTA to minimize ionic strength dependent frequency shifts in the H-1 NMR spectra of urine. Metabolomics. 2008;4(4):328–336. [Google Scholar]
- 32.Nordberg GF. Handbook of the toxicology of metals. Third. Academic Press; 2007. Biological Monitoring and Biomarkers. [Google Scholar]
- 33.Handbook of medical-surgical nursing. 4th. Lippincott Williams & Wilkins; 2006. [Google Scholar]
- 34.Drug abuse handbook. 2nd. CRC Press, Taylor & Francis Group; 2007. [Google Scholar]
- 35.Ogg RJ, Kingsley PB, Taylor JS. WET, a T-1-Insensitive and B-1-Insensitive Water-Suppression Method for in vivo Localized H-1-Nmr Spectroscopy. J Magn Reson, Ser B. 1994;104(1):1–10. doi: 10.1006/jmrb.1994.1048. [DOI] [PubMed] [Google Scholar]
- 36.Mo H, Raftery D. Solvent signal as an NMR concentration reference. Anal Chem. 2008;80(24):9835–9. doi: 10.1021/ac801938j. [DOI] [PMC free article] [PubMed] [Google Scholar]
- 37.Biological Magnetic Resonance Data Bank. www.bmrb.wisc.edu.
- 38.Brindle JT, Nicholson JK, Schofield PM, Grainger DJ, Holmes E. Application of chemometrics to 1H NMR spectroscopic data to investigate a relationship between human serum metabolic profiles and hypertension. Analyst. 2003;128(1):32–6. doi: 10.1039/b209155k. [DOI] [PubMed] [Google Scholar]
- 39.Psychogios N, Hau DD, Peng J, Guo AC, Mandal R, Bouatra S, Sinelnikov I, Krishnamurthy R, Eisner R, Gautam B, Young N, Xia J, Knox C, Dong E, Huang P, Hollander Z, Pedersen TL, Smith SR, Bamforth F, Greiner R, McManus B, Newman JW, Goodfriend T, Wishart DS. The human serum metabolome. PLoS One. 2011;6(2):e16957. doi: 10.1371/journal.pone.0016957. [DOI] [PMC free article] [PubMed] [Google Scholar]
- 40.Geddes CC, Traynor J, Walbaum D, Fox JG, Mactier RA. A new method of post-dialysis blood urea sampling: the ‘stop dialysate flow’ method. Nephrol Dial Transplant. 2000;15(4):517–23. doi: 10.1093/ndt/15.4.517. [DOI] [PubMed] [Google Scholar]
- 41.Saxena V, Gupta A, Nagana Gowda GA, Saxena R, Yachha SK, Khetrapal CL. 1H NMR spectroscopy for the prediction of therapeutic outcome in patients with fulminant hepatic failure. NMR Biomed. 2006;19(5):521–6. doi: 10.1002/nbm.1034. [DOI] [PubMed] [Google Scholar]
- 42.Subramanian A, Gupta A, Saxena S, Kumar R, Nigam A, Mandal SK, Roy R. Proton MR CSF analysis and a new software as predictors for the differentiation of meningitis in children. NMR Biomed. 2005;18(4):213–25. doi: 10.1002/nbm.944. [DOI] [PubMed] [Google Scholar]
- 43.Chun Y, Yavari I, Roberts JD. N-15 Nuclear Magnetic-Resonance Spectroscopy - N–H Proton-Exchange Reactions of Urea, Thiourea, Acetamide and Thioacetamide. Org Magn Reson. 1982;18(2):74–76. [Google Scholar]
- 44.Mo H, Harwood J, Raftery D. NMR quantitation: influence of RF inhomogeneity. Magn Reson Chem. 2011;49(10):655–658. doi: 10.1002/mrc.2812. [DOI] [PMC free article] [PubMed] [Google Scholar]
Associated Data
This section collects any data citations, data availability statements, or supplementary materials included in this article.