

Abstract
The CD27+IgD+ B cell population, known as IgM memory, reduces with age. It is thought that this population is responsible for pneumococcal polysaccharide T‐independent responses, and that the age‐related reduction might be partially responsible for the increased susceptibility of older people to bacterial pathogens. There are other IgM+ B cell populations that do not express IgD. We compared the different IgM populations using high‐throughput sequencing of the immunoglobulin (Ig) gene repertoire and multidimensional cell phenotyping and found that the different populations of IgM cells, defined by CD27 and IgD expression, have repertoire differences. Some of these differences are likely indicative of different selection pressures in an immune response, although the older individuals were found to have a changed repertoire in naive B cells, which may contribute to some of the changes seen in memory cells. In addition, even within the CD27+IgD+ IgM memory population there are multiple cell types. We show that the level of IgM expression varies substantially and hypothesize that this distinguishes between T‐dependent and T‐independent types of IgM memory cells. Significant age‐related changes in the relative proportions of these populations may exacerbate the reduction in T‐independent responders in old age.
Keywords: IgM memory, immunoglobulin repertoire, aging
Introduction
The origin and function of the CD19+CD27+IgD+ B cell population known as IgM memory is still a subject of some controversy. The term IgM memory was originally given to these cells, as they have mutations in their immunoglobulin (Ig) genes and express CD27.1, 2 In humans, it is thought that they are the recirculating equivalent of the marginal zone cells of the spleen, where IgM cells containing mutations are also found.3, 4, 5 Some believe they are the B cells that respond to T‐independent stimuli,4, 5, 6, 11 while others argue that they are precursors to switched memory cells in a T‐dependent response.7 More recently, it has been proposed that this population contains the human equivalent of mouse B1 cells.8 In our lab, we have shown that the Ig gene repertoire of IgM memory cells differs markedly from that of switched memory cells,9 and therefore we would argue that the majority of the population would respond to different stimuli than the switched cells in order for this difference to appear. However, there is no denying the evidence that some IgM and IgG cells can originate from the same B cell precursor, presumably in the same reaction,7 nor that persistent IgM memory cells can be formed in a T‐dependent response, at least in mice.10
Both the putative human B1 cell population and the IgM memory population have been shown by some groups to decrease with age.11, 12 Since IgM memory is thought to provide protection against encapsulated bacteria, it could be argued that it is this decrease that causes the increased risk of morbidity and mortality due to pneumonococcal pneumonia in older people.11 Indeed, for many years the poor functionality of older serum against pneumococci (as measured by the opsonophagocytic assay) was puzzling in face of the fact that these patients had the same levels of IgG as younger vaccine recipients. However, Park and Nahm showed that removing IgM from the serum can decrease serum functionality.13 In the same year, we showed that the antipneumococcal IgG titer was the same in older people, but that IgM and IgA were deficient.14
In light of the heterogeneity and proposed function of these IgD+CD27+ cells, the name “IgM memory” is perhaps confusing. There are also other IgM‐expressing cells that are not naive but have lost IgD and may or may not express CD27. The differences between switched memory cells that differ in expression of CD27 have been discussed elsewhere,15 and it is important to note that the CD27– memory population increases with age16 and with autoimmunity and chronic viral challenge.16, 17, 18 During B cell development there are formative events that increase the representation of certain types of Ig genes, by expansion in response to challenge, and events that decrease the use of some Ig genes, by deletion as a result of autoreactivity. Ig gene repertoire analysis can be used to infer whether the formative events for a particular B cell population are different from those of another population. Ig heavy chain genes are formed by random recombination of variable (IGHV), diversity (IGHD) and joining (IGHJ) genes, with additional diversity gained by the imprecise joining of the segments at the V–D and D–J junctions, whereby nucleotides are inserted or deleted into these junctions by terminal deoxynucleotidyl transferase. The junctional region is known as the heavy chain complementarity determining region 3 (CDR‐H3) and can be used as a fingerprint to identify copies of a particular Ig gene rearrangement from the same lineage. The B cell repertoire can be described in terms of the frequency of use of the different types of genes.
In this paper, we sorted cells into different subsets based on CD27, IgD, and CD10 staining and used IgM constant region‐specific primers to produce a large number of IGH sequences from individuals aged from 21 to 87 years old. We describe the different populations of antigen‐experienced IgM cells in relation to their Ig gene repertoire and demonstrate the changes with age at a point 28 days after vaccination with influenza and pneumococcal polysaccharide vaccines. Additionally, we used a large panel of markers, using mass cytometry, and we show the heterogeneity of IgM memory cells with respect to different levels of IgM expression and identify two distinct populations whose frequencies are altered in aging.
Methods
B cell isolation and cell sorting
Peripheral blood mononuclear cells (PBMCs) were isolated from a total of 14 young (21–45 years) and 16 old (62–87 years) healthy volunteers. Written consent was obtained in accordance with the Declaration of Helsinki after approval from the Guy's Hospital research ethics committee (REC 08/H0804/57 and 09/H0504/39). PBMCs were isolated using Ficoll plaque Plus (GE Healthcare) and Leucosep tubes (Grenier Bio‐One Ltd).
For high‐throughput sequencing analysis, CD19+ B cells were positively selected for using the MACS B cell Isolation Kit (Miltenyi Biotec), stained with CD10‐APC, CD27‐FITC (Miltenyi Biotec) and IgD‐PE (BD Bioscience PharMingen) at 4 °C (15 min) and analyzed on a FACSAria (BD Biosciences PharMingen). Five subsets were separately collected (Fig. 1), as previously published: transitional (IgD+CD27–CD10+), naive (IgD+CD27–CD10–), IgM memory (IgD+CD27+), IgD−CD27+, and IgD–CD27– into 180 μL of Sort‐Lysis RT buffer (SLyRT).9 SLyRT comprises 150 ng/μL pd(N)6 (Invitrogen), 2.5 U/μL RNAse inhibitor (Bioline), 0.13% Triton X‐100 (Sigma‐Aldrich), 12.5 mM DTT, and 500 μM each deoxyribonucleotide triphosphate (dNTP) mix (Promega) in 1× First‐Strand RT buffer (Invitrogen) final concentration (i.e., in 200 μL). IgM‐specific PCR primers were later used to ensure that all sequences came from IgM+ cells, and the IgM‐sequenced IgD– cells are henceforth referred to as IgM‐only CD27+ or IgM‐only CD27– cells.
Figure 1.
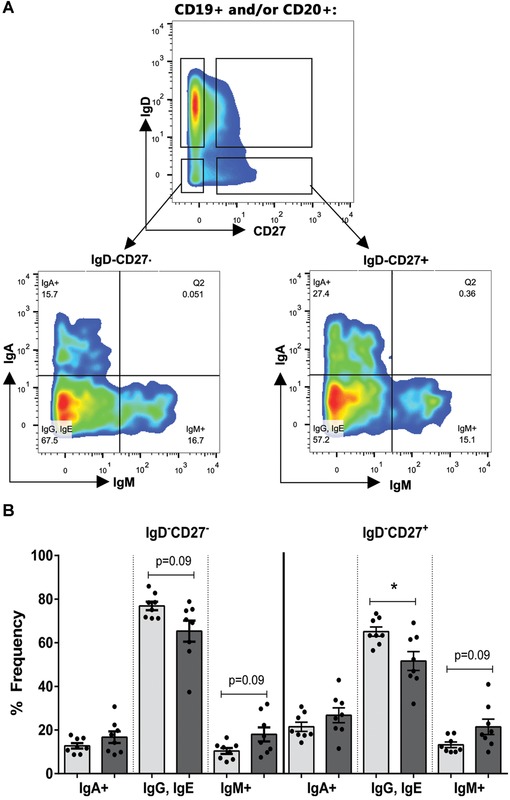
Age‐related changes in B cell populations. (A) Gating used to identify populations of naive (IgD+CD27–), IgM memory (IgD+CD27+), IgD–CD27+, and IgD–CD27– populations from pre‐gated CD19+ and/or CD20+ B cells using metal‐tagged antibodies and mass cytometry. Further gating of IgD– populations into IgA+, IgM+, and IgA–IgM– cells (referred to as IgG, IgE). (B) Quantification of subclasses of cells within the IgD– populations in young and old donors. n = 8 young (light gray) and n = 8 old donors (dark gray), *denotes P < 0.05 by Mann–Whitney U test, bars are standard error of the mean (SEM).
Mass cytometry and data analysis
For mass cytometry experiments, PBMCs were stained with CD14‐FITC and CD3‐APC (Biolegend), and a population of enriched B cells (CD3–CD14–) was collected into 50% FCS (Biosera) and 50% RPMI‐1640 (Gibco). The CD3−CD14− enriched B cells were labeled with a rhodium intercalator (Rh103, DVS Sciences) followed by intracellular and extracellular staining with a panel of 30 different metal‐tagged antibodies (DVS Sciences, BD Biosciences and Biolegend). Cells were fixed, iridium stained (Ir193, DVS Sciences), and normalization beads (DVS Sciences) were added before analysis on a CyTOF (DVS Sciences). Between 1 and 5× 10⁵ stained cells were analyzed per sample.
Data were normalized and files were concatenated and cleaned up to remove debris (by gating on cell length and DNA+ cells), to exclude normalization beads (Ce140– cells), to positively select intact cells (Ir191+ Ir193+), to positively select live cells (Rh103–Ir193+), and to identify CD19+ and/or CD20+ B cells. Within FlowJo v10 (TreeStar), conservative IgD and CD27 gating was employed to identify the four distinct B cell populations (naive IgD+CD27–, IgM memory IgD+CD27+, IgD–CD27+, and IgD–CD27–). The abundance of different classes of B cells (IgM+, IgA+, and IgM−IgA−) was quantified and compared between different IgD− cell populations. To phenotypically characterize and compare the different cell subpopulations and samples, histograms of the mean fluorescence index (MFI) or frequency of positive cells by expression of different markers were overlaid and statistical comparisons made using Student's t‐tests, the Mann–Whitney U test, or 2‐way ANOVAs.
High‐throughput sequencing and data analysis
cDNA synthesis was performed by adding 500 U SuperScript III reverse transcriptase (Invitrogen) to the 180 μL of SLyRT buffer containing the sorted cells. The following RT reaction was performed: 42 °C (10 min), 25 °C (10 min), 50 °C (60 min), and 72 °C (15 min). The Ig genes were amplified as in Ref. 9. Briefly, Ig genes were amplified using a semi‐nested PCR with isotype‐specific primers. A 25 μL PCR1 reaction containing 6.25 μL of cDNA, 0.625U Phusion DNA polymerase (NEB), 200 μM each dNTP, 41.75 nM each of 5′ IGHV gene family primer, and 250 nM IgM‐specific constant‐region primer, was run at 98 °C (30 s), 15 cycles of 98 °C (10 s); 58 °C (15 s); 72 °C (30 s), and 1 cycle of 72 °C (5 min). PCR2 was then performed using 2 μL of PCR1 product, 0.5 U Phusion DNA polymerase, 200 μM each dNTPs, 41.75 nM each of 5′ IGHV gene family, and 250 nM nested constant‐region primer where all primers contained matched multiplex identifiers (MIDS), at 20 (PCR2) cycles of 98 °C (10 s); 58 °C (15 s); 72 °C (30 s), and 1 cycle of 72 °C (5 min). PCR products were purified and sequencing was carried out on the Roche 454 Titanium platform by LGC Genomics (Germany).
Downstream data clean‐up and processing were carried out as previously published.9 The data were first subjected to a stringent set of rules to remove sequences with two different MIDs or internal MID sequences and to remove sequences that were biologically implausible (i.e., containing multiple V or J genes, a C‐terminus at both ends, or an internal subclass motif and a 3′ subclass primer). Finally, short sequences were removed from the data where the C to IGHV regions are smaller than the following: Cα < 289 nucleotides, Cμ < 333 nucleotides and Cγ < 409 nucleotides. Approximately 50% of sequences pass this quality control step.
After the initial quality control, sequences underwent Ig genotyping as follows. Ig gene usage and the CDR‐H3 junction regions were determined using V‐QUEST.19 ProtParam was used to determine the physicochemical properties of the CDR‐H3 peptide between the conserved first (cysteine) and last amino acid (tryptophan).20 Clonotype clustering was carried out on CDR‐H3 using a clustering matrix such that sequences with the same IGHV gene and within 10 nucleotides in length of the test sequence were used to make a distance matrix, which was then used for hierarchical clustering. Related sequence pairs were determined as having a distance of 0.25.9 Once the clusters of related sequences were established, the modal sequence was determined to be used as a representative of this group and was assigned as a unique sequence. Only the unique sequences were used within this analysis to remove any skewing that could have arisen from PCR amplification. Annotated and cleaned data were combined and subsequent analyses performed in Excel (Microsoft). Owing to the difficulties of accurately studying any differences caused by mutation, and the focus on the IgM sequences, we have made no analysis of somatic hypermutation.
Results
Age‐related changes in B cell populations
Reports on the frequency of IgM memory cells show either no change16 or a decrease11 with age. The frequency of CD27– memory cells has been shown to increase with age.16 However, data on the proportions of IgM‐only cells in the IgD– populations are scarce. We pregated for CD19+ and/or CD20+ cells and quantified the proportions of IgM and IgA cells that are IgD– in eight young (18–32 years) and eight old (62–82 years) individuals using mass cytometry. Since we could not use anti‐IgG in our staining panel, we assumed that the CD19+ and/or CD20+ B cells that did not stain with IgM or IgA were mainly IgG+ with possibly some expression of IgE (here referred to as IgG, IgE (Fig. 1A)). It is worth noting that, for mass cytometry experiments, the negative cells have no mass and so are found along the axis, meaning that plots look different from those produced in conventional flow. To ensure that clean populations were analyzed, conservative gating was used to identify our B cell populations. We found that the IgD–CD27+ population had a significantly higher proportion of IgM and IgA cells than the IgD–CD27– population (P = 0.04 and P = 0.008, respectively). The proportion of IgM+ and IgA+ cells together increased further with age in both populations (Fig. 1B).
Immunoglobulin IGHV gene repertoire of IgM+ B cells
To determine whether these IgM‐only cells were related to IgM memory cells, we compared the repertoires of four different IgM+ cell types (naive, IgM memory, IgD–CD27–, IgD–CD27+) using conventional flow cytometry. An example of the gating strategy is shown in Figure 2(A). Subsequently, the Ig genes were amplified using IgM‐specific constant‐region primers, to identify IgM+ sequences. After quality control to ensure only full‐length VH to Cμ sequences were represented, a total of 71,681 IgM sequences were obtained from six young and eight old individuals (Table 1). After heavy chain complementarity determining region 3 (CDR‐H3) clustering to identify related sequences, we identified 31,928 unique VDJ gene rearrangements (Table 1). From this point onward, only unique VDJ rearrangements were used in the analysis.
Figure 2.
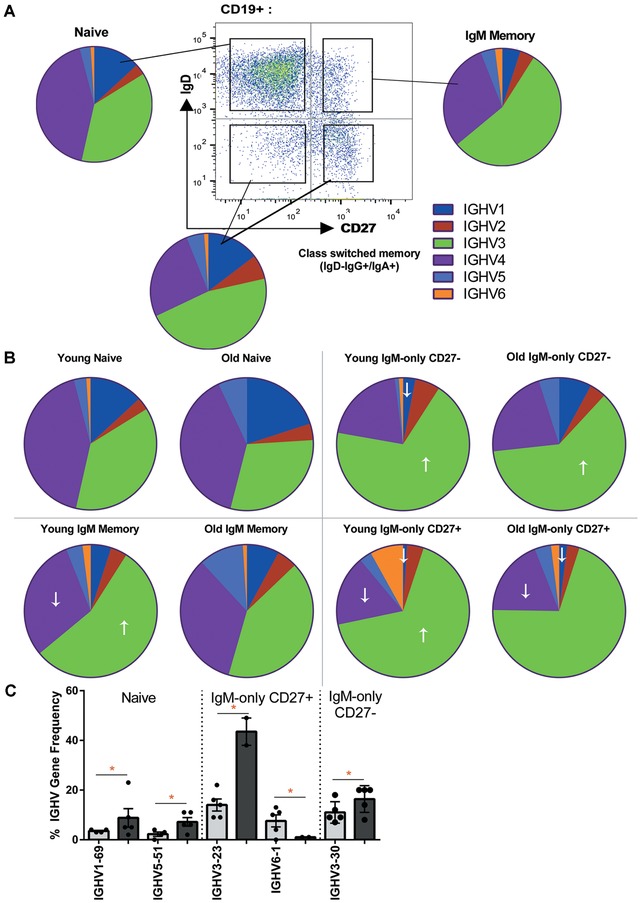
Immunoglobulin IGHV gene repertoire of IgM+ B cells. (A) IGHV family usage within naive, IgM memory, and class switched (IgD–IgG+/IgA+) cells as identified using conventional flow cytometry. (B) Average IGHV family usage within naive, IgM memory, IgM‐only (IgD–) CD27–, and IgM‐only (IgD–) CD27+ cells from young and old donors. ↑ indicates a significant increase in that IGHV gene family usage compared to the frequency in naive cells. ↓ indicates a significant decrease in that IGHV gene family usage compared to the frequency in naive cells. (C) Frequency usage of individual IGHV genes in different IgM+ cell types from young (light gray) and old (dark gray) donors. n = 8 young (light gray) and n = 8 old donors (dark gray). Significance was determined by 2‐way ANOVA with Sidak or Tukey post hoc testing and correction for multiple comparisons
Table 1.
IgM sequences from four different IgM+ cell types
| Naive | IgM memory | IgD−CD27+ | IgD−CD27+ | |
|---|---|---|---|---|
| Young | ||||
| Total IgM sequences | 2110 | 17,200 | 4425 | 4969 |
| Unique IgM rearrangements | 1386 | 9302 | 2142 | 773 |
| Old | ||||
| Total IgM sequences | 8027 | 25,820 | 7586 | 1544 |
| Unique IgM rearrangements | 4398 | 10,176 | 3321 | 430 |
Our previous work showed that the IGHV family usage of IgM memory cells differs from that of both naive cells and switched memory cells (IgD–IgA+/IgG+) (Fig. 2A). We used the sorting strategy in Figure 2(A) and we analyzed the IGHV gene use in our samples and found that, unlike the switched cells, IGHV1 usage is significantly reduced in IgM‐only CD27+ and IgM‐only CD27– populations compared to naive cells (Fig. 2B, P = 0.0092 and 0.0431, respectively). IGHV3 is significantly higher in all IgM populations than in young naive cells (P < 0.0001 for all comparisons). This is at the expense of IGHV1 and IGHV4 (P < 0.0001, < 0.0001, and 0.0034 for IGHV4 IgM‐only CD27+, IgM‐only CD27–, and IgM memory). However, with increasing age, the naive and IgM memory repertoires change slightly, such that there is no longer a significant difference between the two in their IGHV3 use (Fig. 2B, P = 0.1929) and there is significantly lower IGHV3 in IgM memory cells in the old (Fig. 2B, 54.5% in the young, 41.4% in the old, P = 0.0085). The IgM‐only cells retain their distinctive IGHV1, 3, and 4 family use with age. An analysis of individual IGHV genes showed very few significant differences with age. In naive cells, there was an increase in the usage of IGHV1‐69 and IGHV5‐51, in IgM‐only CD27+ cells, there was an increase in IGHV3‐23 and a small reduction in IGHV6‐1, and in IgM‐only CD27– cells an increase in IGHV3‐30 (Fig. 2C). Therefore, it appears that age‐related changes affect selection at the family level but not at the individual IGHV gene level.
CDR‐H3 characteristics within different IgM+ B cells
We have previously shown that there are general characteristics of the CDR‐H3 region, such as the overall size and hydrophobicity that predominate in memory B cell populations compared to naive cells.9, 15 The size of the CDR‐H3 region is affected by IGHJ use, and, since IGHJ6 is larger than the other IGHJ genes, it is quite often associated with a larger CDR‐H3 region. In common with previous findings, we see an increase of IGHJ4 in CD27+ cells compared to naive cells (Fig. 3A, P < 0.0001 and P = 0.0012 for IgM‐only CD27+ and IgM memory cells, respectively). This is often at the expense of IGHJ6 (P = 0.0123 IgM‐only CD27+). CD27+ IgM‐only cells have a greater skew toward increased IGHJ4 and decreased IGHJ6 than do IgM memory cells (Fig. 3A). The increase in IGHJ4 in IgM memory cells from the young is not observed in the old, thus showing a further age‐related change, in addition to IGHV usage, in the repertoire of IgM memory cells (young 43.8–51.3%, P = 0.0026; old 42.4–46.8%, P = 0.1717). There was a small but statistically significant increase of IGHJ5 use in both older IgM memory and CD27– IgM‐only populations (Fig. 3B). Generally, the picture of IGHJ usage shows that the IgM memory population has more in common with the IgM‐only CD27– population than with the IgM‐only CD27+ population. In contrast to this observation, the size of CDR‐H3 decreases in both the IgM memory and the IgM‐only CD27+ populations compared to naive cells, but there is no decreased CDR‐H3 size in the IgM‐only CD27– population (Fig. 3C). The size of the CDR‐H3 region is also affected by the IGHD use, and in theory a number of different IGHD–IGHJ combinations can produce the same size of CDR‐H3 (Fig. 3D). Nevertheless, the other qualities of the CDR‐H3 region are important, as evidenced by the fact that different IGHD–IGHJ combinations that form fragments of the same size are used to different extents in the repertoire. For example, within fragment size 30, the combinations IGHD5–IGHJ4 and IGHD6–IGHJ4 are used more frequently than IGHD1–IGHJ2 or IGHD4–IGHJ2, despite them all forming the same size fragments. Additionally, a general qualitative positive selection is shown, whereby particular combinations can be increased or decreased in memory cells compared to the naive population (Fig. 3D). Of particular interest, there is a significantly increased use of the IGHD1–IGHJ4 combination in memory cells, which is much less evident in the older samples than in the young (Fig. 3E).
Figure 3.
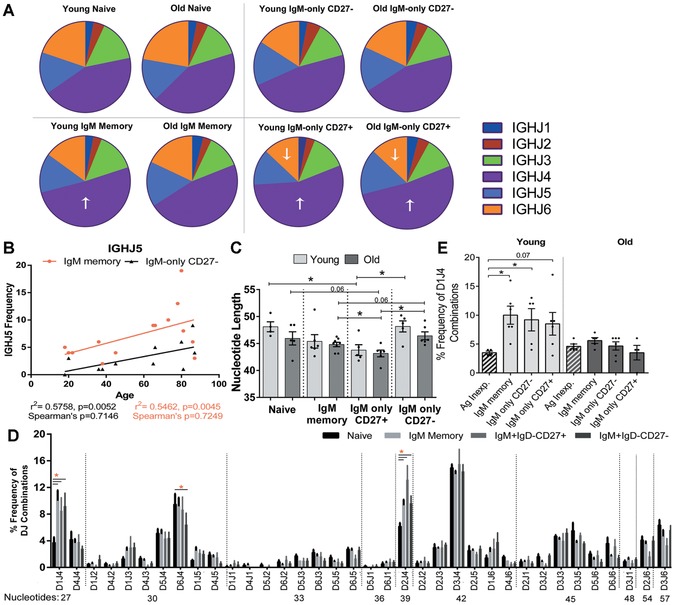
CDR‐H3 characteristics within different IgM+ B cells. (A) Average IGHJ family usage within naive, IgM memory, IgM‐only (IgD–) CD27–, and IgM‐only (IgD–) CD27+ cells from young and old donors. ↑ indicates a significant increase in IGHJ gene family usage compared to the frequency in naive cells. ↓ indicates a significant decrease in IGHJ gene family usage compared to the frequency in naive cells. (B) Correlation between IGHJ5 family usage and age within IgM memory cells (red squares) and IgM‐only CD27– (black triangles). (C) Average CDR‐H3 length, in nucleotides, between different IgM+ cells from young (light gray) and old (dark gray) donors. (D) Frequency of each IGHD and IGHJ (DJ) combination within naive and all IgM+ memory cells (IgM memory, IgD–CD27–, and IgD–CD27+). Combinations are listed in order of increasing nucleotide length, with the nucleotide size written below the combination. (E) Frequency usage of the IGHD1 and IGHJ4 (D1J4) gene combination within different IgM+ memory B cells (plain bars) compared to naive cells (diagonal lines) within young (light gray) and old (dark gray) donors. n = 8 young (light gray) and n = 8 old donors (dark gray). Significance was determined by 2‐way ANOVA with Tukey post hoc testing and correction for multiple comparisons; bars are SEM. Spearman's statistic was determined for correlations where stated.
Heterogeneity of IgM‐expressing memory cells
The above data would indicate that the three types of IgM+ memory cell are distinct from each other. We also highlight some age‐related differences. One of the issues in looking at repertoire characteristics is that if one looks at a mixed population of cells the observations are averaged values over any different populations in the mix. Since the origin of IgM memory cells has been questioned, it is quite possible that there are different subpopulations of IgM memory cells. We have shown that IgM memory cells vary in their CD24 and CD38 expression.21 If distinct subpopulations change differentially with age, that could also explain some age‐related changes in repertoire. In addition to the finding of a B1‐like population in IgM memory cells,12 a recent paper has shown that IL‐10–producing regulatory B cells are also present.22
Although we call the IgD+CD27+ B cells IgM memory cells, it was suspected that further heterogeneity within IgM memory cells existed. Using a panel of 30 different metal‐tagged antibodies and undertaking mass cytometry, we saw that the levels of IgM expression are quite varied. In particular, we found two subpopulations of cells that were distinguishable by variation in IgD and IgM level, and these changed with age. An IgMloIgDhi population decreased from 39% to 29% with age, while an IgMhiIgDlo population increased with age from 18% to 27% (Fig. 4A). These two populations were distinguishable by other markers, such as CD23, CD24, CD38, CXCR4, β7, and CD40 (Fig. 4B). The IgMhiIgDlo population has more surface markers in common with both IgM‐only and switched memory cells than with IgMloIgDhi B cells (Fig. 4C).
Figure 4.
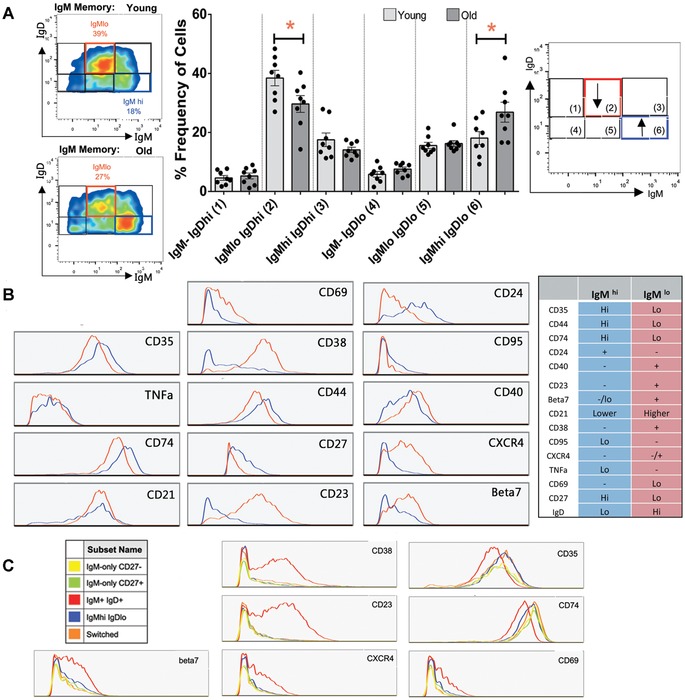
IgM memory cell heterogeneity: IgM and IgD expression using mass cytometry. (A) Pregated IgM memory cells (IgD+CD27+) were further split on the basis of expression of IgD and IgM into six gates. The IgMloIgDhi (IgMlo) population is shown within the red box and the IgMhiIgDlo (IgDhi) population within the blue box. Representative plots from young and old individuals are shown. (B) Quantification of the frequency of each IgM/IgD population within young (light gray) and old (dark gray) groups, with a schematic indicating significant age‐related changes with arrows. Expression histograms for IgMhi and IgMlo cells were overlaid for comparison between populations. Representative histograms are from a single donor, and the phenotype of each population is summarized to the right. TNFα and CD74 are intracellular‐staining and all others are surface‐staining markers. Statistical significance was determined using paired t‐tests (P < 0.05) to compare either the mean signal between cell types (CD35 and CD74) or comparing the frequency of positive cells in each population. (C) Expression histograms overlaid to compare IgMloIgDhi (IgMlo,red) and IgMhiIgDlo (IgDhi, blue) cells to switched cells (IgD–IgG+/IgA+, orange), IgM‐only CD27+ (green), and IgM‐only CD27– cells (yellow).
Discussion
We have shown that all antigen‐experienced IgM+ cells differ in repertoire from naive cells, but there are also subtle differences between the different types of IgM+ cells. IgM‐only cells appear to increase with age (Fig. 1), which may be a reflection of the decreased capacity for class switching that has been previously reported.23 The IgM memory cells have a different IGHV repertoire from the IgM‐only populations, while their IGHJ repertoire is similar to that in CD27– IgM‐only, but not that of CD27+ IgM‐only cells. The repertoire of IgM memory cells appears to be most affected by age, with the characteristic increase in IGHV3/IGHJ4 family usage and decrease in IGHV4 usage not being seen in older patients (Figs. 2B and 3A), suggesting a possible change in gene family selection with age.
The CD27– IgM‐only cells are distinct from the other antigen‐experienced IgM+ cells as they do not show the decrease in CDR‐H3 size that we normally see between naive and memory repertoires. All of our previous observations regarding CDR‐H3 size in the repertoire indicate that small CDR‐H3 size is a feature of antigen‐selected memory cells.14, 15, 24 It is also well accepted that hypermutation is a feature of memory cells, yet CD27–IgD– memory cells have fewer mutations and thus also differ from CD27+IgD– memory cells in this respect, having fewer mutations.9, 15, 25 It has been hypothesized that the CD27–IgD– memory cells are exhausted memory cells. If this were the case, we would not expect differences in CDR‐H3 use or hypermutation from CD27+ memory cells. Rather, we postulate that these cells may have been initially activated in an immune response, but could then have perhaps undergone a tolerance event, with a downregulation of activation markers and possibly reduced participation in the immune response. The finding of increased numbers of these cells in association with aging and autoimmune diseases would be in agreement with this hypothesis.
This work has also highlighted the fact that, although subtle repertoire differences in memory cells can be seen with age, they may be a reflection of differences that are present in naive cells in the first instance. Although we do show a change in selection of IGHD1–IGHJ4 in the memory repertoire (Fig. 3E), it is also clear that naive cells may be different in the older population (Fig. 2B). It may also be the case that the populations we have studied are heterogeneous, and that changes in the relative proportions of any composite subpopulations could result in overall repertoire changes. We have illustrated IgM memory heterogeneity and an age‐related change in subpopulation frequency.
IgM memory cells are of particular interest owing to their importance in protection against T‐independent antigens, such as pneumococcal antigens, and the susceptibility of older people to pneumococcal disease. We have shown evidence to support the hypothesis that they are a mixed population, and that the repertoire changes we see here may well be muted as a result of averaging across different populations. Further work to separate out the IgMhi subpopulation for repertoire analysis would be required to determine whether this population more closely matched the IgM‐only cells, but the phenotypic analysis presented here indicate that they might. Since IgM‐only cells are T dependent (being absent in CD40‐deficient hyper‐IgM syndrome),4 we could hypothesize that the other major subpopulation of IgM memory cells, with low expression of IgM and high expression of IgD, might be the population thought to be responsible for polysaccharide T‐independent responses. Thus, not only has the population of IgM memory cells as a whole decreased, but also within this population there are further key changes that could significantly affect the older immune system with respect to T‐independent responses. Breg cells have been reported to be enriched within the IgM memory population.22 However, we do not know where they would fall in our two subpopulations. Total IL‐10+ Breg cells have been shown to have a high expression of IgM;22 therefore, we could hypothesize that they may be found within the IgMhi population.
Acknowledgments
We are very grateful for the help from Dr. Rajive Mitra and the staff at Lambeth Walk Group Practice, and to all the blood donors. This work was supported by the Human Frontiers Science Programme (RGP9/2007), BBSRC (BB/G017190/1), MRC (MR/L01257X/1). Research into Ageing (323), the Rosetrees Trust (JS16/A386), and the Dunnhill Medical Trust (R279/0213). The research was funded/supported by the National Institute for Health Research (NIHR) Biomedical Research Centre based at Guy's and St. Thomas' NHS Foundation Trust and King's College London. The views expressed are those of the author(s) and not necessarily those of the NHS, the NIHR, or the Department of Health. We are particularly grateful for the help and advice provided by Richard Ellis and Suzanne Heck in the BRC Flow Core Facility.
References
- 1. Klein, U. , Rajewsky K. & Kuppers R.. 1998. Human immunoglobulin (Ig)M+IgD+ peripheral blood B cells expressing the CD27 cell surface antigen carry somatically mutated variable region genes: CD27 as a general marker for somatically mutated (memory) B cells. J. Exp. Med. 188: 1679–1689. [DOI] [PMC free article] [PubMed] [Google Scholar]
- 2. Klein, U. , Kuppers R. & Rajewsky K.. 1997. Evidence for a large compartment of IgM‐expressing memory B cells in humans. Blood 89: 1288–1298. [PubMed] [Google Scholar]
- 3. Dunn‐Walters, D. K. , Isaacson P. G. & Spencer J.. 1995. Analysis of mutations in immunoglobulin heavy chain variable region genes of microdissected marginal zone (MGZ) B cells suggests that the MGZ of human spleen is a reservoir of memory B cells. J. Exp. Med. 182: 559–566. [DOI] [PMC free article] [PubMed] [Google Scholar]
- 4. Weller, S. , et al 2004. Human blood IgM “memory” B cells are circulating splenic marginal zone B cells harboring a prediversified immunoglobulin repertoire. Blood 104: 3647–3654. [DOI] [PMC free article] [PubMed] [Google Scholar]
- 5. Kruetzmann, S. , et al 2003. Human immunoglobulin M memory B cells controlling Streptococcus pneumoniae infections are generated in the spleen. J. Exp. Med. 197: 939–945. [DOI] [PMC free article] [PubMed] [Google Scholar]
- 6. Weller, S. , et al 2001. CD40–CD40L independent Ig gene hypermutation suggests a second B cell diversification pathway in humans. Proc. Natl. Acad. Sci. U.S.A. 98: 1166–1170. [DOI] [PMC free article] [PubMed] [Google Scholar]
- 7. Seifert, M. & Kuppers R.. 2009. Molecular footprints of a germinal center derivation of human IgM+(IgD+)CD27+ B cells and the dynamics of memory B cell generation. J. Exp. Med. 206: 2659–2669. [DOI] [PMC free article] [PubMed] [Google Scholar]
- 8. Griffin, D. O. & Rothstein T. L.. 2011. A small CD11b(+) human B1 cell subpopulation stimulates T cells and is expanded in lupus. J. Exp. Med. 208: 2591–2598. [DOI] [PMC free article] [PubMed] [Google Scholar]
- 9. Wu, Y. C. , et al 2010. High‐throughput immunoglobulin repertoire analysis distinguishes between human IgM memory and switched memory B‐cell populations. Blood 116: 1070–1078. [DOI] [PMC free article] [PubMed] [Google Scholar]
- 10. Dogan, I. , et al 2009. Multiple layers of B cell memory with different effector functions. Nat. Immunol. 10: 1292–1299. [DOI] [PubMed] [Google Scholar]
- 11. Shi, Y. , et al 2005. Regulation of aged humoral immune defense against pneumococcal bacteria by IgM memory B cell. J. Immunol. 175: 3262–3267. [DOI] [PubMed] [Google Scholar]
- 12. Griffin, D. O. , Holodick N. E. & Rothstein T. L.. 2011. Human B1 cells in umbilical cord and adult peripheral blood express the novel phenotype CD20+ CD27+ CD43+ CD70– . J. Exp. Med. 208: 67–80. [DOI] [PMC free article] [PubMed] [Google Scholar]
- 13. Park, S. & Nahm M. H.. 2011. Older adults have a low capacity to opsonize pneumococci due to low IgM antibody response to pneumococcal vaccinations. Infect. Immun. 79: 314–320. [DOI] [PMC free article] [PubMed] [Google Scholar]
- 14. Ademokun, A. , et al 2011. Vaccination‐induced changes in human B‐cell repertoire and pneumococcal IgM and IgA antibody at different ages. Aging Cell 10: 922–930. [DOI] [PMC free article] [PubMed] [Google Scholar]
- 15. Wu, Y. C. , Kipling D. & Dunn‐Walters D. K.. 2011. The relationship between CD27 negative and positive B cell populations in human peripheral blood. Front. Immunol. 2: 81. [DOI] [PMC free article] [PubMed] [Google Scholar]
- 16. Colonna‐Romano, G. , et al 2009. A double‐negative (IgD–CD27–) B cell population is increased in the peripheral blood of elderly people. Mech. Ageing Devel. 130: 681–690. [DOI] [PubMed] [Google Scholar]
- 17. Moir, S. , et al 2008. Evidence for HIV‐associated B cell exhaustion in a dysfunctional memory B cell compartment in HIV‐infected viremic individuals. J. Exp. Med. 205: 1797–1805. [DOI] [PMC free article] [PubMed] [Google Scholar]
- 18. Wei, C. , et al 2007. A new population of cells lacking expression of CD27 represents a notable component of the B cell memory compartment in systemic lupus erythematosus. J. Immunol. 178: 6624–6633. [DOI] [PubMed] [Google Scholar]
- 19. Brochet, X. , Lefranc M. P. & Giudicelli V.. 2008. IMGT/V‐QUEST: the highly customized and integrated system for IG and TR standardized V‐J and V‐D‐J sequence analysis. Nucleic Acids Res. 36: W503‐508. [DOI] [PMC free article] [PubMed] [Google Scholar]
- 20. Wilkins, M. R. , et al 1999. Protein identification and analysis tools in the ExPASy server. Methods Mol. Biol. 112: 531–552. [DOI] [PubMed] [Google Scholar]
- 21. Boyd, S. D. , et al 2013. Human lymphocyte repertoires in ageing. Curr. Opin. Immunol. 25: 511–515. [DOI] [PMC free article] [PubMed] [Google Scholar]
- 22. Khoder, A. , et al 2014. Regulatory B cells are enriched within the IgM memory and transitional subsets in healthy donors but are deficient in chronic GVHD. Blood 124: 2034–2045. [DOI] [PMC free article] [PubMed] [Google Scholar]
- 23. Frasca, D. , et al 2008. Aging down‐regulates the transcription factor E2A, activation‐induced cytidine deaminase, and Ig class switch in human B cells. J. Immunol. 180: 5283–5290. [DOI] [PubMed] [Google Scholar]
- 24. Wu, Y. C. , Kipling D. & Dunn‐Walters D. K.. 2012. Age‐Related Changes in Human Peripheral Blood IGH Repertoire Following Vaccination. Front. Immunol. 3: 193. [DOI] [PMC free article] [PubMed] [Google Scholar]
- 25. Fecteau, J. F. , Cote G. & Neron S.. 2006. A new memory CD27–IgG+ B cell population in peripheral blood expressing VH genes with low frequency of somatic mutation. J. Immunol. 177: 3728–3736. [DOI] [PubMed] [Google Scholar]