

Abstract
Because x-ray based image-guided vascular interventions are minimally invasive they are currently the most preferred method of treating disorders such as stroke, arterial stenosis, and aneurysms; however, the x-ray exposure to the patient during long image-guided interventional procedures could cause harmful effects such as cancer in the long run and even tissue damage in the short term. ROI fluoroscopy reduces patient dose by differentially attenuating the incident x-rays outside the region-of-interest. To reduce the noise in the dose-reduced regions previously recursive temporal filtering was successfully demonstrated for neurovascular interventions. However, in cardiac interventions, anatomical motion is significant and excessive recursive filtering could cause blur. In this work the effects of three noise-reduction schemes, including recursive temporal filtering, spatial mean filtering, and a combination of spatial and recursive temporal filtering, were investigated in a simulated ROI dose-reduced cardiac intervention.
First a model to simulate the aortic arch and its movement was built. A coronary stent was used to simulate a bio-prosthetic valve used in TAVR procedures and was deployed under dose-reduced ROI fluoroscopy during the simulated heart motion. The images were then retrospectively processed for noise reduction in the periphery, using recursive temporal filtering, spatial filtering and a combination of both.
Quantitative metrics for all three noise reduction schemes are calculated and are presented as results. From these it can be concluded that with significant anatomical motion, a combination of spatial and recursive temporal filtering scheme is best suited for reducing the excess quantum noise in the periphery. This new noise-reduction technique in combination with ROI fluoroscopy has the potential for substantial patient-dose savings in cardiac interventions.
INTRODUCTION AND PURPOSE
Fluoroscopy based image guided vascular interventions are widely used for treating several disorders such as stroke, arterial stenosis, and aneurysms [1][2]. Some of the common endovascular image-guided interventional procedures (EIGI’s [3]) are angiography, balloon angioplasty, stenting, and Trans-Aortic Valve Replacement (TAVR). While these procedures are minimally invasive, the x-ray exposure to the patient could cause harmful effects such as cancer, cell or tissue damage. An optimal balance between clinical utility of x-ray radiation and its harmful effect to the patients is needed.
Previously, a novel patient dose reduction technique involving a combination of Region of Interest (ROI) fluoroscopy[4][5] and spatially-different temporal filtering was presented [6][7][8]. Figure 1 demonstrates the concept of dose reduction. An x-ray attenuator (a Kodak Lanex screen) with a circular opening in the middle for the ROI [10] is placed on the x-ray tube, to reduce the amount of x-rays reaching the patient and hence the detector in the peripheral region. This results in an image with differential brightness as shown in Figure 2.
Figure 1.

ROI fluoroscopy concept. An x-ray attenuator with differential attenuation is used to cut patient dose in the periphery region.
Figure 2.

Unprocessed image with differential brightness due to the use of the ROI attenuator. The dose in the periphery and hence the brightness is lower compared to the ROI
In order to equalize the brightness in the image, a pre-acquired mask (of the ROI attenuator) is subtracted from the input images [6][7][8][10][11]. The resulting image (Figure 3) has a higher noise in the periphery (region A in Figure 3) compared to the ROI (region B in Figure 3). In order to reduce the excessive noise in the periphery, a recursive temporal filter with higher filter weight (α) in the periphery was applied using the following equation [6][7][8].
| (1) |
Use of temporal filtering in the periphery may introduce acceptable lag without impacting quality within the ROI where the intervention is occurring. The technique was proposed and previously tested for neuro-interventions, where motion of anatomical features is minimal [6][7][8]. The purpose of this present work is to evaluate the performance of this dose and noise reduction technique in cardiac interventions where there is significant anatomical motion due to the beating of the heart as well as human respiration.
Figure 3.

Brightness equalized image. Region A has higher noise due to lower quanta compared to region B
METHODS
In order to simulate the longitudinal motion of the aortic anatomy due to the heart beat, a linear stage stepper motor assembly (Velmex Inc, Bloomfield, NY) was used. A LabVIEW (National Instruments, Austin, Texas) code was written to communicate with the motor to control the speed and the distance of the motion, to achieve an equivalent rate of 60 beats per second. To simulate the aortic arch a rubber tube was mounted on the linear stage assembly. In order to simulate the patient attenuation a uniform phantom using a combination of solid-water and acrylic blocks were used. A standard state-of-the-art flat panel detector was used as the primary imaging device. To reduce the incident dose a ROI attenuator (a stack of 4 layers of Kodak Lanex screens containing gadolinium with a 1.5cm diameter circular aperture and an attenuation factor of 6 times at 70 kVp spectrum) was placed on top of the collimator. The images were acquired using custom-built acquisition software, CAPIDS [12]. Figure 4 shows the experimental setup.
Figure 4.

Experimental Setup. The rubber tube mounted on the linear stage simulates the longitudinal motion of the aorta. The ROI attenuator is mounted on the x-ray tube under the table.
Placement of a coronary stent (Express 2, 5.0mm diameter fully expanded and 28mm long, Boston Scientific, Marlborough, Massachusetts) was used to simulate a cardiac intervention procedure and it was deployed under dose-reduced ROI fluoroscopy. Two sets of images of the deployed stent were acquired: set1 with the linear stage switched on, and set 2 with the linear stage switched off. The brightness difference in the raw input images seen in Figure 5 was corrected by log-subtracting a pre-acquired mask of the ROI attenuator (Figure 6).
Figure 5.

ROI input image. Regions of the object under the attenuator receive less dose and hence the corresponding portions of the image appear dark
Figure 6.

Pre-acquired image of the attenuator, used as a mask for brightness correction.
The sequence of images of which Figure 7 is one were then retrospectively processed for noise reduction in the periphery, using three different noise reduction schemes listed below:
1) Recursive temporal filtering: Equation 1 represents the recursive temporal filter.
- 2) Spatial filtering: A simple mean blurring filter was used. Each pixel (Iinput (i,j))) in the image was replaced by the average value of its neighborhood (n × n) pixel including itself. Equation 2 gives the implementation of the simple mean blurring filter.
(2) 3) Combination of spatial and recursive temporal filtering.
Figure 7.

Brightness equalized image, by subtracting the mask (figure 6) from the input image (figure5). The ROI is indicated. Part of the stent and one of its markers was positioned outside the ROI to study the effects of different noise reduction schemes
One end of the stent along with the marker was purposely placed outside the ROI to evaluate the effect of the different noise reduction schemes. The image within the ROI remains unprocessed. Signal and noise were calculated from the post processed images for each of the above filtering schemes and were compared.
RESULTS
Two rectangular regions, inside and outside the ROI, were selected (see Figure 8) to calculate Signal to Noise (SNR) ratios of the brightness corrected image for the three different filtering schemes mentioned above. For this calculation the linear stage was switched off (no movement). The noise reduction filters were applied only to the periphery region. The filter weights were varied to achieve similar SNR for the rectangular region in the periphery as compared to the rectangular region inside the ROI.
Figure 8.

Two rectangular regions inside and outside the ROI used for SNR calculations.
Table 1 shows the different SNR’s for different filtering schemes. The SNR within the rectangular region inside the ROI was calculated to be 37.6. By using the recursive temporal filtering scheme with a filter weight of 0.74, or the spatial mean filtering scheme with a kernel size of 5 × 5, similar SNR’s within the rectangular region in the periphery were achieved. A combination of spatial filtering with a kernel size of 3 × 3 and recursive temporal filtering with a weight of 0.3 also resulted in a similar SNR within the rectangular region in the periphery. Figure 9 shows the noise reduced image using recursive filtering, Figure 10 shows the noise reduced image using spatial mean filtering and Figure 11 shows the noise reduced image using the combination of spatial and recursive temporal filtering.
Table 1.
SNR table for the two rectangular regions shown in Figure 6 for different filtering schemes. The filter was applied only in the periphery. By varying the filter weights in the periphery, the SNR in the periphery can be increased to values similar to within the ROI
| Temporal Recursive filter | Spatial mean filter | Combination ( with mean filter kernel size 3×3) |
||||
|---|---|---|---|---|---|---|
| SNR (ROI) |
Recursive Weight |
SNR Periphery |
Kernel | SNR Periphery |
Recursive | SNR Periphery |
| Weight | ||||||
| 37.6 | 0.14 | 15.98 | 3×3 | 26.54 | 0.14 | 29.16 |
| 37.6 | 0.54 | 25.09 | 5×5 | 38.47 | 0.2 | 32.3 |
| 37.6 | 0.78 | 36.15 | 7×7 | 51.1 | 0.3 | 36.04 |
Figure 9.

Noise in the periphery reduced by using a recursive temporal filter with a weight of 0.78
Figure 10.

Noise in the periphery reduced by using a spatial mean filter with a kernel size of 5 × 5
Figure 11.

Noise in the periphery reduced by using a combination of spatial mean filter with a kernel size of 3 × 3 and recursive temporal filter of weight 0.3
In order to quantify the effect of different filter schemes on moving anatomy, the linear stage was turned on, and images of the moving tubing as well as the stent were acquired (x-ray exposure pulse width 6ms and frame rate 10fps). The noise in the periphery of the brightness-corrected images was reduced using different filtering schemes with different weights and kernels given in Table 1. The surface distribution of a small region around the stent marker (see Figure 12) was plotted for each filtering scheme and its corresponding weights are highlighted in green in Table 1.
Figure 12.
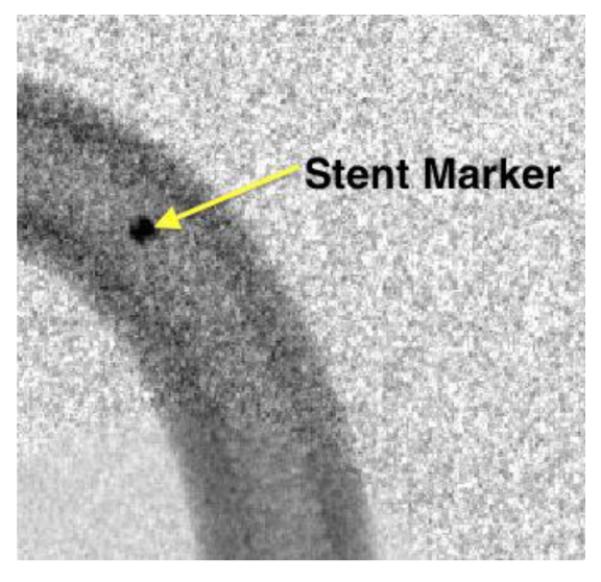
Stent marker used for surface plot distribution. This image is only brightness corrected, but not reduced in noise. The linear stage is switched on
Figure 13 shows the surface plot for the unfiltered image. Figure 14 shows the surface plot for spatial filtering with a 5 × 5 kernel and Figure 17 shows the corresponding image of the marker. Figure 15 shows the surface plot for recursive temporal filtering with a weight of 0.78 and Figure 18 shows the corresponding image of the marker. Figure 16 shows the surface plot for the combination of spatial (3 × 3 kernel) and recursive filtering (0.3 weight) and Figure 19 shows the corresponding image of the marker.
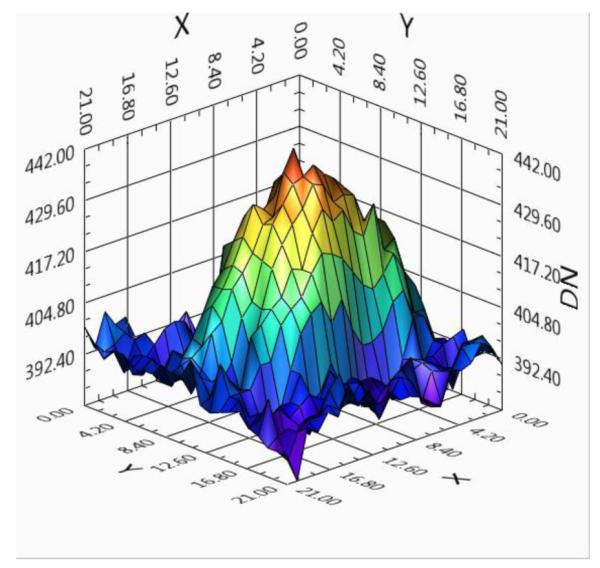
Figure 13.

Surface plot of the stent marker of the unfiltered image
Figure 14.

Surface plot of the stent marker. Noise reduced by using a spatial mean filter with a kernel size of 5 × 5
Figure 17.

Stent marker after being noise reduced using a spatial mean filter with a kernel size of 5
Figure 15.
Surface plot of the stent marker. Noise reduced by using a recursive temporal filter with a weight of 0.78
Figure 18.
Stent marker after being noise reduced using a recursive temporal filter with a weight of 0.78
Figure 16.

Surface plot of the stent marker. Noise in the periphery reduced by using a combination of spatial mean filter with a kernel size of 3 × 3 and recursive temporal filter of 0.3
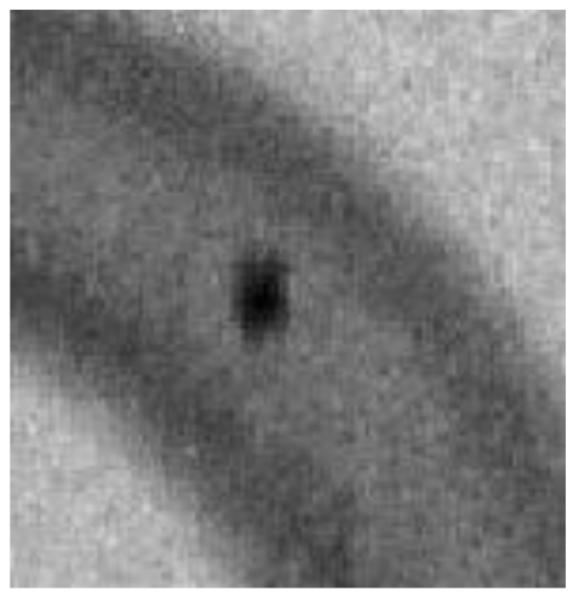
Figure 19.

Stent marker after being noise reduced using a combination of spatial mean filter with a kernel size of 3×3 and recursive temporal filter of weight 0.3
From Table 1 it can be seen that both temporal recursive filtering and spatial filtering can produce the same S/N ratio by reducing noise in the periphery; however, comparing Figure 10 with Figure 9 it can be seen that, while temporal recursive filtering maintains the spatial resolution, spatial mean filtering decreases the spatial resolution. However, when there is motion it can be seen from the surface distribution plot in Figure 15 and the corresponding image of the marker in Figure 18, that temporal recursive filtering introduces lag (see the significant spread of the marker in the direction of motion), while from the plot in Figure 16 and the corresponding image of the marker from Figure 17, it can be seen that, by using spatial mean filtering, the peaks (or sharp features) are blurred. Compared to neuro-vascular interventions, cardiac interventions encounter significant anatomical movement due to the beating heart and respiration. Under such circumstances using recursive filtering in the periphery could significantly introduce lag, and hence misinformation. Using high spatial filtering results in significant degradation of the image, and also as the kernel size increases calculation time increases.
By combining both spatial and recursive filtering, the noise in the periphery can be reduced, at the cost of minimal loss in spatial resolution and minimal lag. Referring to Table 1 and Figure 10 it can be seen that the noise can be reduced without significant loss in spatial resolution. From the surface distribution plots in Figure 16 and the corresponding image of the marker in Figure 19 and comparing it with the surface plot in Figure 13, it can be seen that, while the noise is reduced, the signal peaks in the marker are still maintained and not blurred out or smoothed out.
CONCLUSION
Using a combination of spatial and temporal recursive filtering to reduce quantum noise in the periphery during ROI imaging could result in patient dose reduction with acceptable loss in image quality in the periphery even in the presence of anatomical motion such as in cardiac interventions. A determination of the optimal recursive filter weights and kernel dimensions for clinical cardiac interventional procedures still needs to be further investigated.
Using the combination of spatial and temporal filtering to reduce noise in the peripheral regions when ROI fluoroscopy is used in image-guided interventions which involve significant anatomical motion is a novel concept presented here for the first time.
ACKNOWLEDGMENT
This work is supported in part by NIH Grant R01EB002873 and an equipment grant from Toshiba Medical Systems Corporation.
REFERENCES
- [1].Stroke, mayo clinic [Online]. Available: http://www.mayoclinic.com/health/stroke/DS00150.
- [2].American heart and stroke association [Online]. Available: www.strokeassociation.org.
- [3].Rudin S, Bednarek DR, Hoffmann KR. Endovascular image-guided interventions (EIGIs) Med Phys. 2008 Jan;35(no. 1):301–309. doi: 10.1118/1.2821702. http://www.pubmedcentral.gov/articlerender.fcgi?artid=2669303. [DOI] [PMC free article] [PubMed] [Google Scholar]
- [4].Rudin S, Bednarek DR. Region of interest fluoroscopy. Med Phys. 1992;19(no. 5):1183–1189. doi: 10.1118/1.596792. http://www.ncbi.nlm.nih.gov/pubmed/1435596. [DOI] [PubMed] [Google Scholar]
- [5].Rudin S, Bednarek DR, Kezerashvili M, Granger WE, Serghany JE, Guterman LR, Hopkins LN, Szymanski B, Loftus RJ. Clinical application of region-of-interest techniques to radiologic imaging. Radiographics. 1996 Jul;16(no. 4):895–902. doi: 10.1148/radiographics.16.4.8835978. http://www.ncbi.nlm.gov/pubmed/8835978. [DOI] [PubMed] [Google Scholar]
- [6].Vasan S. N. Swetadri, Panse A, Jain A, Sharma P, Ionita Ciprian N., Titus AH, Cartwright AN, Bednarek DR, Rudin S. Dose reduction technique using a combination of a region of interest (ROI) material x-ray attenuator and spatially different temporal filtering for fluoroscopic interventions. Proc. SPIE 8313, Medical Imaging 2012: Physics of Medical Imaging. 2012 Feb 23;:831357. doi: 10.1117/12.910945. doi:10.1117/12.910945. http://www.ncbi.nlm.nih.gov/pmc/articles/PMC3766980/ [DOI] [PMC free article] [PubMed]
- [7].Vasan S. N. Swetadri, Pope L, Ionita CN, Titus AH, Bednarek DR, Rudin S. Dose reduction in fluoroscopic interventions using a combination of a region of interest (roi) x-ray attenuator and spatially different, temporally variable temporal filtering. Proc. SPIE. 2013;8668:86 683Y–86 683Y–8. doi: 10.1117/12.2006277. [Online]. http://www.ncbi.nlm.nih.gov/pmc/articles/PMC4013118/ [DOI] [PMC free article] [PubMed] [Google Scholar]
- [8].Vasan SN, Sharma P, Ionita CN, Titus AH, Cartwright AN, Bednarek DR, Rudin S. Spatially different, real-time temporal filtering and dose reduction for dynamic image guidance during neurovascular interventions. Conf Proc IEEE Eng Med Biol Soc; 2011. pp. 6192–6195. [DOI] [PMC free article] [PubMed] [Google Scholar]
- [9].Massoumzadeh P, Rudin S, Bednarek DR. Filter material selection for region of interest radiologic imaging. Med Phys. 1998 Feb;25(no. 2):161–171. doi: 10.1118/1.598191. [DOI] [PubMed] [Google Scholar]
- [10].Fletcher LM, Rudin S, Bednarek DR. Method for image equalization of ROI fluoroscopic images using mask localization, selection and subtraction. Comput Med Imaging Graph. 1996;20(no. 2):89–103. doi: 10.1016/0895-6111(96)00028-6. [DOI] [PubMed] [Google Scholar]
- [11].Rudin S, Bednarek DR, Yang CY. Real-time equalization of region of interest fluoroscopic images using binary masks. Med Phys. 1999 Jul;26(no. 7):1359–1364. doi: 10.1118/1.598631. [DOI] [PubMed] [Google Scholar]
- [12].Vasan S. N. Swetadri, Ionita Ciprian N., Titus AH, Cartwright AN, Bednarek DR, Rudin S. Graphics processing unit (GPU) implementation of image processing algorithms to improve system performance of the control acquisition, processing, and image display system (CAPIDS) of the micro-angiographic fluoroscope (MAF) Proc. SPIE 8313, Medical Imaging 2012: Physics of Medical Imaging. 2012 Feb 23;:83134C. doi: 10.1117/12.911272. doi:10.1117/12.911272. http://www.ncbi.nlm.nih.gov/pmc/articles/PMC3767001/ [DOI] [PMC free article] [PubMed]