Abstract
The conformational landscape of HIV-1 protease (PR) can be experimentally characterized by pulsed-EPR double electron-electron resonance (DEER). For this characterization, nitroxide spin labels are attached to an engineered cysteine residue in the flap region of HIV-1 PR. DEER distance measurements from spin-labels contained within each flap of the homodimer provide a detailed description of the conformational sampling of apo-enzyme as well as induced conformational shifts as a function inhibitor binding. The distance distribution profiles are further interpreted in terms of a conformational ensemble scheme that consists of four unique states termed “curled/tucked”, “closed”, “semi-open” and “wide-open” conformations. Reported here are the DEER results for a drug-resistant variant clinical isolate sequence, V6, in the presence of FDA approved protease inhibitors (PIs) as well as a non-hydrolyzable substrate mimic, CaP2. Results are interpreted in the context of the current understanding of the relationship between conformational sampling, drug resistance, and kinetic efficiency of HIV-1PR as derived from previous DEER and kinetic data for a series of HIV-1PR constructs that contain drug-pressure selected mutations or natural polymorphisms. Specifically, these collective results support the notion that inhibitor-induced closure of the flaps correlates with inhibitor efficiency and drug resistance. This body of work also suggests DEER as a tool for studying conformational sampling in flexible enzymes as it relates to function.
1. Introduction
HIV-1 is the causative agent of Acquired Immunodeficiency Syndrome (AIDS). HIV-1 infection is a global epidemic; it is estimated that over 70 million people have been infected with HIV, resulting in over 33 million total deaths, and over 2 million (UN AIDS report 2014) new infections are anticipated world-wide each year.1, 2 HIV-1 has significant genetic diversity, being classified into subtypes, circulating recombinant forms (CRFs) and unique recombinant forms (URFs).2–6 The subtypes include A, B, C, D, F1, F2, G, H, J, K,7 with subtype B being predominant in USA and Europe.2, 3 The circulating recombinant forms are mostly genetic mosaics of subtypes A with E or G, with CRF01_A/E and CRF02_A/G being common in East Asia and West Africa; respectively.2, 8 URFs are unique sequences obtained from individuals that differ from existing classifications.
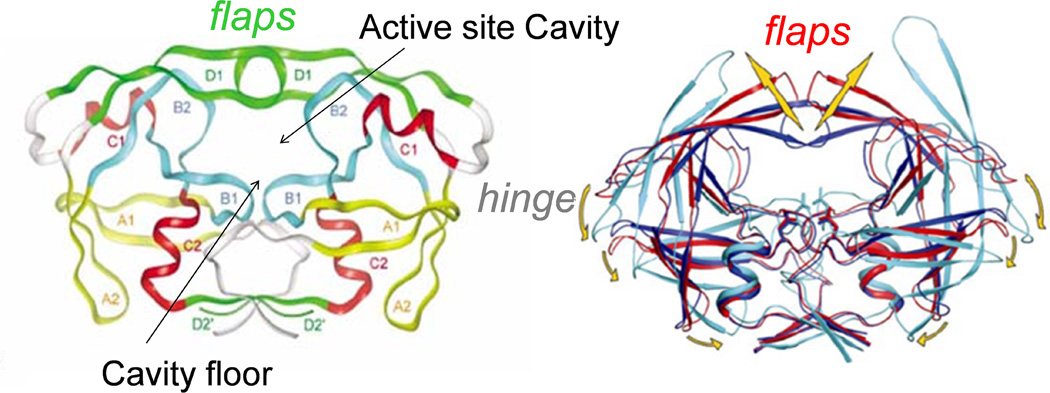
Current treatment of HIV infection is referred to as “Highly Active Antiretroviral Therapy” (HAART), and consists of a mixture of classes of drugs that target essential components of the HIV-1 viral life cycle.9 Although HAART is quite successful in extending the lifetime of most HIV infected patients, the emergence of drug-pressure selected mutations that confer drug resistance has compromised its effectiveness.4, 6, 10 One target of HAART is the enzyme HIV-1 protease (HIV-1PR), whose structure is shown in Figure 1. HIV-1PR is a homodimeric aspartic protease (99 amino acids in each monomer) 11, 12 that is responsible for the cleavage of the viral polyproteins gag and gag-pol. Inhibition of HIV-1PR blocks viral maturation, resulting in immature and non-infectious viruses.13 From rational structure-based drug design, nine different protease inhibitors (PIs) that bind competitively to the active site have been approved by the FDA for clinical treatments.4, 6, 10 The ribbon diagram in Figure 1 illustrates that access to the floor of the active site is mediated by movement of two β-hairpins “flaps”, where each of which is supplied by one of the monomers. As such, motion of the flaps plays a fundamental role in the activity and function of HIV-1PR.14–22
Figure 1.
(Left) 3D structure of HIV protease homodimer with separate structural motifs highlighted in different colors. Figure is modified from reference.11 (Right) Cartoon showing hypothesized flap movement (coordinates of wide-open state courtesy of C. Simmerling).
Drug resistance is a typical problem encountered in treatment of viral infections, where high replication rates lead to rapid evolution. Typically, the first round of drug-pressure selected mutations alters an amino acid within the active site pocket, mitigating the effectiveness of competitive inhibitors by introducing steric hindrance or removing important chemical interactions.23 These mutations, however, often alter enzymatic efficiency.24 Studies on patterns of emergent mutations show that secondary or compensatory mutations (mutations that are usually distal to the active site region) arise to restore catalytic efficiency and fitness, while retaining drug-resistance.6 In order to combat drug-resistance it is important to understand the mechanism(s) by which the patterns of accumulating mutations elicit their effects. A recent review points to two general mechanisms.25 One proposed mechanism is based purely on structural comparisons.25 The second proposed mechanism involves secondary mutations inducing more indirect effects such as changes in protein dynamics or protein-ligand exchange dynamics that can change enzymatic activity.26–31 Our studies of HIV-1PR have led us to propose an alternative mechanism whereby drug-pressure accumulated mutations can lead to drug-resistance by altering the conformational sampling landscape; i.e., conformational equilibrium.
Much is known about the emergence patterns of drug-pressure selected mutations in HIV-1PR with respect to specific PI regimens (Stanford HIV Database), where amino acid changes at 39 out of 99 positions have been found to interfere with PI susceptibility 6, 32 and 5 to 15 mutations in the PR gene being typical for drug resistant patients.33 Primary mutations often mitigate direct interactions with inhibitors 23 but also compromise fitness24 whereas secondary mutations are typically not located in regions of the protein that make physical contact with the PIs,34–37 yet somehow influence inhibitor binding and often impart cross-resistance to other PIs.4, 23, 24, 34–38 The mechanisms by which accumulated mutations affect the active site pocket and confer drug resistance are actively being studied. At present, the mechanism is believed to be multifaceted in that several aspects of protein function are altered such as protein flexibility through the hydrophobic sliding mechanism,39, 40 protein stability,41 or altered dynamics 42 and conformational sampling.43
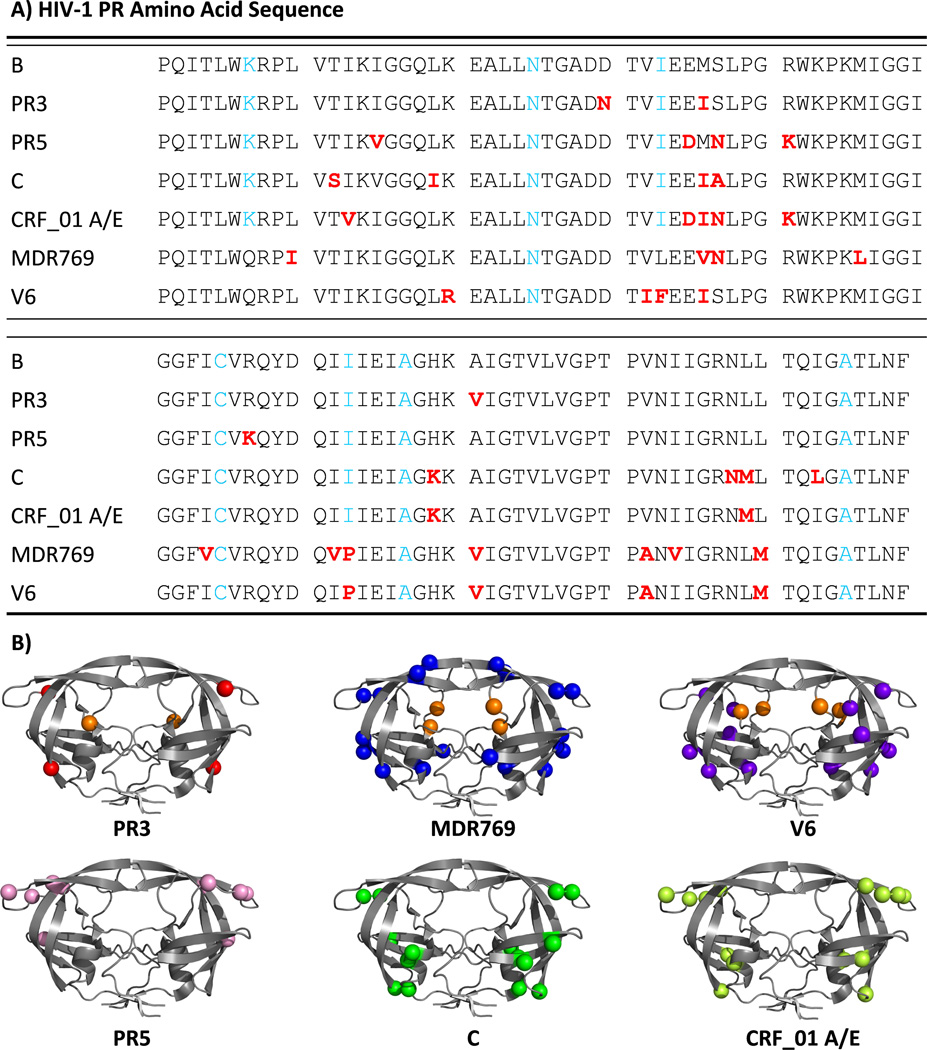
Mutations that arise through genetic drift are referred to as natural polymorphisms, and are categorized into various subtype and CRF classifications. Subtype C, for example, is found in sub-Saharan Africa and parts of South America and2, 3, 44–49 is responsible for roughly 50% of global HIV-1 infections. However, much of the progress and understanding of antiretroviral (ARV) drug development and resistance is based on studies of subtype B.2 Because subtype B accounts for less than 10% of the world-wide infections,7 concerns arise regarding the effectiveness of current HAART treatment against other subtypes, with questions centered on variations in drug susceptibility, emergence patterns of drug pressure selected mutations, viral replicative capacity and dynamics of resistance emergence.2, 3, 5, 7, 44, 48–60 Many of the natural polymorphisms in HIV-1PR that are found in non-B sequences correspond to secondary mutations that arise in subtype B,37 possibly indicating that drug resistance against current PIs in non-B subtypes of HIV-1PR will advance more rapidly.3, 8, 38, 48, 49, 61, 62 For example, Figure 2 shows the locations of natural polymorphisms that occur in subtype C and CRF01_AE, accumulated mutations in a clinical drug resistance isolate, MDR769 63, 64 and clinical isolate V6, as well as mutation sites previously studied in two subtype B constructs; PR5 and PR3. Interestingly, this figure illustrates that many non-active site drug-pressure selected mutations found in subtype B cluster in regions where natural polymorphisms occur.
Figure 2.
(A). Amino acid sequences of HIV-1 protease variants studied. (B) Ribbon diagrams of HIV-1PR variants showing, as spheres, the locations of drug-pressure selected mutations in PR3, MDR769, V6; and the location of natural polymorphisms in subtype B PR5, subtype C and CRF_01 A/E (molecular model with pdb: 3BVB was used). All primary drug-pressure selected mutations are shown as orange spheres
Based upon our previous investigations, our current hypothesis on how mutations accumulate to elicit drug-resistance in HIV-1PR evokes a conformational sampling scheme.25–31, 65, 66 This model suggests that enzyme activity, inhibitor susceptibility and viral fitness can be altered by changes in the equilibrium distribution of structural conformations of HIV-1PR. This model also allows for the possibility that dynamics of each of the conformational states varies 67, 68 and, as mutations accumulate, the exchange rate among the states also varies.42, 69 The four conformers of the proposed ensemble are shown in Figure 3 where the most noticeable change in protein structure involves a segmental motion of the β-hairpin flaps (also shown in Figure 1). Each conformer has been observed, to some degree, via X-ray crystallography. Typically, the closed conformation is obtained in the presence of inhibitor or substrate analog, whereas the semi-open state is dominant in the apo-enzyme.11, 12 A deviation from the semi-open flap conformation to a more closed-like state was seen for a subtype A apo-construct.70 More “open” flap conformations have been observed for variants with inhibitors 71, 72 and for apo constructs containing natural polymorphisms, such as subtype C,46, 62 or drug-pressure induced mutations, as with MDR769 and PR20.63, 64, 72 The conformation termed “curled/tucked” has been reported for both a naïve and a mutant PR sequence.14 Molecular dynamics (MD) simulations have revealed a mechanism for the opening and closing of HIV-1PR21 where the same four conformational states have been described. In one report, the curled/tucked conformation was predicted to be a “trigger” for the full opening of the flaps.73 Our conformational sampling model for HIV-1PR21, 22, 43, 74–77 suggests that the four conformational states shown in Figure 3 are sampled by the apo-enzyme14, 21, 22, 43, 73, 75, 77 and substrate or inhibitor binding shifts the population to the closed state. 21, 22, 74 Our hypothesis regarding drug-resistance is that accumulation of mutations in response to PI-therapy acts first to induce drug resistance by increasing the populations of the wide-open and curled/tucked states with a concomitant decrease in the closed state population 43, 78 and second to restore enzyme activity by re-establishing native-like populations of the semi-open conformational ensemble.43, 67, 68, 77, 78
Figure 3.
Ribbon diagrams of the four conformational states sampled by apo HIV-1PR. Coordinates were obtained from the Protein Data Bank (PDBID given) or courtesy of A. Roitberg from MD simulations. MTSL was appended at site K55C with MMM 2013.2 (http://www.epr.ethz.ch/software/)
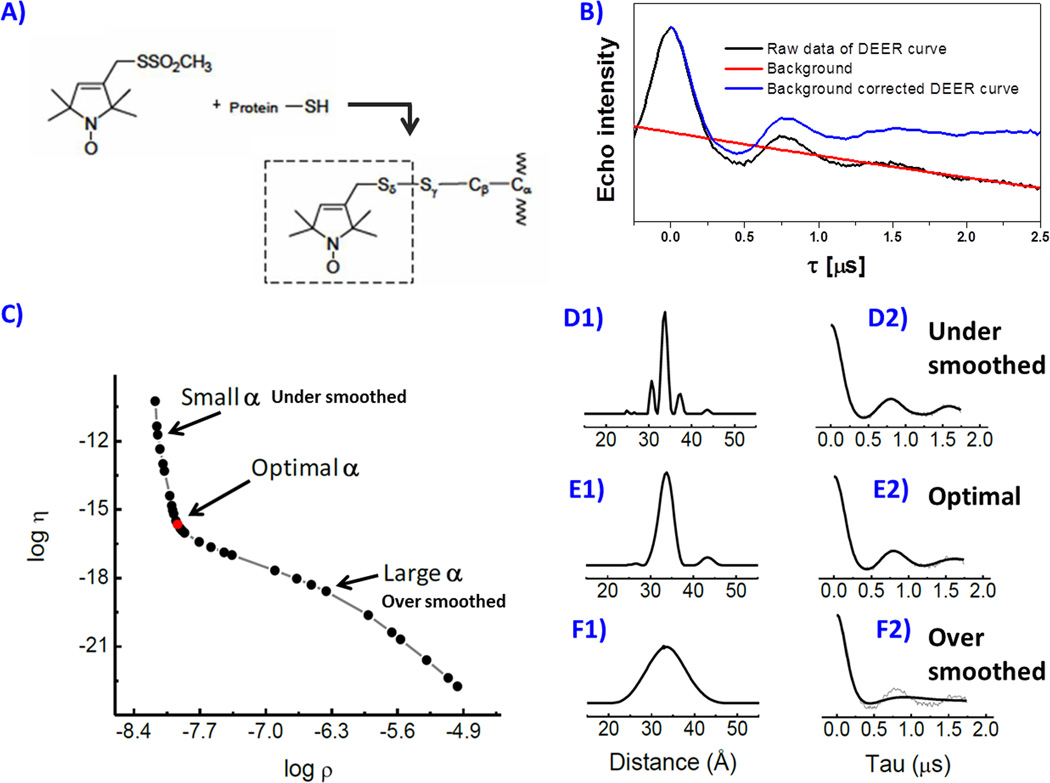
In general, site-directed spin labeling (SDSL) coupled with electron paramagnetic resonance (EPR) spectroscopy has emerged as a powerful method to probe protein dynamics and flexibility.79–85 In the last 10 years, our lab has pioneered procedures for using SDSL 81 with a pulsed version of EPR called double electron-electron resonance (DEER) 86, 87 to characterize the fractional occupancies of the four flap conformations of HIV-1PR.15, 43, 67, 74–77, 88 Advantages of using SDSL-EPR to study biological systems include a relatively high sensitivity (nanomole quantities) and effectively no molecular weight limitation. In most cases, site-specific labeling strategies are required to introduce a unique cysteine residue at a desired location. After protein expression, the cysteine is chemically modified by reaction with a sulfhydryl-specific nitroxide spin label (Figure 4). When two or more spin labels are incorporated, the dipolar interactions between the spin-pairs can be utilized to obtain distance information.86, 87, 89–94 The distances between the two spins can report on conformational changes 15, 74, 95 or be utilized as constraints for 3-D structure determination.96 Because HIV-1PR is a dimer, incorporation of a single cysteine mutation results in a pair of sites for distance measurements. Our SDSL DEER investigations on HIV-1PR clearly demonstrate the ability of this method to characterize conformational sampling ensembles and ensemble populations.15, 43, 74–77, 88
Figure 4.
Spin labeling reaction scheme (A) of MTSL spin label with cysteine, (B) background correction of the DEER echo curve, (C) Tikhonov regularization (TKR) procedure to generate distance distribution profiles where different regulation parameters are chosen in D, E and F, which show the effects of improper α choice.
Distance measurements by SDSL EPR are based on dipole-dipole couplings between unpaired electrons of nitroxide spin labels, which scale in strength as 1/r3, with r being the distance between the unpaired spins. Although traditional continuous wave EPR methods have been used to measure distances in the range of 8–20 Å,89, 90 measurement of larger distances requires pulsed EPR techniques such as DEER.86, 87, 91–94 In the four pulse version of the DEER experiment (4p-DEER),dipolar couplings between the electron spins are encoded in modulations of an electron spin echo amplitude, collected as a function of time spacing between specific microwave pulses applied in a fixed time sequence. With 4p-DEER, the range of sensitivity can be extended to 20–80 Å, achieving a precision of 0.3 Å for the lower end of this range.76, 92, 97 Data are interpreted after transformation of the time domain echo modulation traces to distance domain profiles using analytical expressions and fitting methods such as Tikhonov Regularization (TKR); which we describe in more detail in the methods section. Our DEER distance profiles for HIV-1PR routinely consist of measured distances that correspond to the four major populations mentioned above;43, 74–77, 81, 98 closed, semi-open, curled/tucked and wide-open conformations (Figure 3).
Here we report DEER conformational sampling results for the clinical isolate V6 in the presence of the nine FDA approved PIs (obtained from the NIH reagents program) and the non-hydrolyzable CaP2 substrate mimic (purchased from PEPTIDES INTERNATIONAL, KY); which effectively acts as an inhibitor. The drug-resistant variant V6 sequence was determined from an isolate from a pediatric patient undergoing treatment with the drug Ritonavir (RTV). V6 contains two active site mutations, V32I and V82A, and six non-active site mutations, K20R, L33F, M36I, L63P, A71V, and L90M. In addition to RTV resistance, these mutations are also associated with resistance to the drugs Indinavir (IDV) and Nelfinavir (NFV).36 The V82 mutation is frequently observed as a drug-pressure selected mutation in all clinically used inhibitors. The positions of these mutations are highlighted in Figure 2. Crystal structures (PDBID: 2B60) show that the combination of V32I and V82A alters the shape of the active site, which can directly lead to the decreased inhibitor binding efficiency.36 The side-chain of L90M faces into the hydrophobic core and can alter the shape of the active site by changing key interactions that define protein packing. The residues L33, M36, and K20 are in the region between the fulcrum and the flap elbows. Residues A71 and L63 are located in the cantilever. These non-active site mutations likely impact the relative stability of the various conformational states. We previously reported DEER results for the conformational sampling profile of apo V6, which indicated that this construct has, on average, a more closed-like conformation of the flaps with a higher percentage of the curled/tucked state than wild-type subtype B.76, 77, 99 Here we report effects of inhibitors to induce closed-state conformations and discuss DEER results in relationship to kinetics and inhibition studies.
2. Materials and Methods
2.1 Cloning and Site-Directed Mutagenesis
The drug-resistant HIV-1PR V6 sequence was determined from a clinical isolate of a pediatric patient undergoing Ritonavir (RTV) therapy.36 It contains two active site mutations, V32I and V82A, and six non-active site mutations, K20R, L33F, M36I, L63P, A71V, and L90M relative to the wild-type subtype B construct. The E. coli codon-optimized gene encoding the V6 HIV-1PR was purchased from DNA 2.0 (Menlo Park, CA) and was cloned into the pET-23a vector (Novagen, Gibbstown, NJ) under the control of T7 promoter using standard cloning techniques. Three stabilizing mutations including Q7K, L33I and L63I and two other mutations of C67A and C95A were designed to minimize auto-proteolysis and to ensure site-specific spin-labeling reaction; respectively. The catalytical residue of HIV-1PR was altered to a D25N substitution and the spin-labeling site, K55C, was introduced using site-directed mutagenesis kit (Stratagene). The protein sequences of all HIV-1PR constructs including B, PR3, PR5, C, CRF_01 A/E, MDR769 and V6 are shown in Figure 2A. Kinetics, NMR and MD investigations of K55C labeling on HIV-1PR enzyme have shown that incorporation of the spin-label at this site has little impact on the function, inhibitor binding and conformational sampling of HIV-1PR.15, 22, 43, 76, 78, 100
2.2 Protein Expression and Purification
The plasmid for encoding V6 was transformed into E. coli BL21-(DE3)-pLysS competent cells (Invitrogen, Carlsbad, CA) by heat shock at 42 °C. The transformed cells were then incubated and grown at 37 °C to log phase when the optical density at 600 nm reaches 1.0, after that, Isopropyl-β-D-1-thiogalactopyranoside (IPTG) with a final concentration of 1 mM, was added to the cell culture to induce the protein expression. Expression time was optimized by the pilot expression. The V6 construct was purified from the inclusion body as described previously15, 77 with one modification considering the different isoelectric point (pI) for V6 of 8.92.
2.3 Spin Labeling for DEER Experiments
After purification, the protein sample was concentrated to about 30 µM with a volume of 20 mL for the spin labeling reaction. To maximize the spin labeling efficiency, 20-fold molar excess of spin labels dissolved in ethanol were added to the protein solution. Labeling reaction was allowed to proceed in the dark for 8–16 hours at room temperature (20 to 24 °C). After labeling, the excess spin labels were removed by buffer exchange (HiTrap 26/10) into 10 mM NaOAc buffer at pH 5.0. The labeled protein was diluted to low salt buffer of 2 mM NaOAc (pH 5.0) to maximize protein stability and minimize aggregation and subsequently concentrated to ~40 μM using a PES membrane filtration. The spin labeling efficiency was determined by comparing the CW EPR spectra to a corresponding spectrum for standard 4-Oxo-TEMPO spin-label samples. The sample was subsequently stored at −20°C for further characterization.
2.4 Sample Preparation and DEER Experiments
The V6 protein sample was then buffer exchanged and concentrated to 160 μM in 20 mM deuterated NaOAc buffer at pH 5.0 in D2O. As was determined from previous NMR titration studies,43, 100 for all inhibitor/substrate-bound samples, 4:1 molar excess of inhibitor /substrate, where typically volume of 3 µL of inhibitor stock solution was added ~ 70 µL V6 protein and allowed to equilibrate at room temperature for 1 hour to ensure the sufficient binding. Any possible protein precipitation was removed by centrifugation at 12,000 rpm. Deuterated-glycerol was then added to protein sample to achieve the final concentration of 30% (v/v) glycerol concentration. The homogenized sample was transferred to a 4 mm quartz EPR tube for DEER measurements.
All DEER experiments were performed on a Bruker EleXsys E580 spectrometer at 65 K with an ER 4118X-MD5 dielectric split-ring resonator. Samples were flash frozen in liquid nitrogen before being inserted into the resonator. The four-pulse DEER sequence was used in all experiments as described in detail previously.15, 74, 77 The DEER echo modulation traces were processed and transformed from the time domain to distance profiles which could be separated into four Gaussian-shaped populations, corresponding to curled/tucked, closed, semi-open and wide-open conformations. The details of this procedure are described below.
2.5 DEER Population Analysis
Experimental echo modulation curves from 4p-DEER contain contributions from both intra and intermolecular spin-spin interactions. Data processing begins with removal of the “background signal” that arises from intermolecular spin-spin interactions. The background corrected echo curve is then fit to analytical expressions using Tikhonov Regularization (TKR) methods to extract distance information from the echo modulations.86, 91, 101 Figure 4 graphically represents this method and illustrates the impact of the choice of the regularization parameter (α) on the resultant distance profile. For processing our data and fitting with TKR we utilize the publically available software package, “DEERAnalysis”, which operates in Matlab.86 To describe distance profiles obtained from fitting 4p-DEER data in terms of a conformational sampling scheme, interpretation proceeds by first representing the distance profiles (P(r)) as a sum of sub-distributions (populations), which we model as Gaussian shaped curves, followed by statistical analysis of the relative significances of each population in the total distribution. The likelihood that a certain sub-population in the distance is representative of a distance between unpaired electrons in the sample as opposed to an artifact of processing or fitting depends both on the relative contributions to the total distribution and on the signal-to-noise ratio of the time domain data. For statistically qualifying these minor contributions, we have developed a procedure for selectively suppressing sub-populations in P(r) in order to validate their relative contributions to the time domain data. For this, we have developed an additional MatLab based tool called “DEERconstruct”, which is publically available at the Matlab Central File Exchange. Briefly, the reconstructed distributions (P′(r)), which represent the linear combination of the individual sub-populations, are reverse transformed to time domain representation and compared to the experimental data quantitatively by using a standard deviation (σRE); calculated as,
| [1] |
where n is the number of data points used to collect the experimental data, R(t) is the experimental time domain data, and E(t) (or E′(t)) is the reconstructed time domain representation of P(r) (or P′(r)). This quantity defines a statistical threshold for qualifying individual sub-populations in P′(r). Various reconstructed distributions (P′S(r)) are created by selective suppressions of sub-populations in P′(r), the P′S(r) are reverse transformed to time domain (E′S(t)), and the resulting variances in the time domain representations (vS(t)) are calculated as,
| [2] |
Suppression of a given sub-population is accepted if the maximum of vS(t) is within 105% of σRE. More details of the DEER reconstruction and significance analysis can be found in several of our previous publications, or in the manual provided with the DEERconstruct software package.67, 77, 100, 102 More details, including specifics of interpretation of the data in this report, are also provided in the supplemental information.
3. Results
3.1 Inhibitor Effects on the DEER Echo Evolution
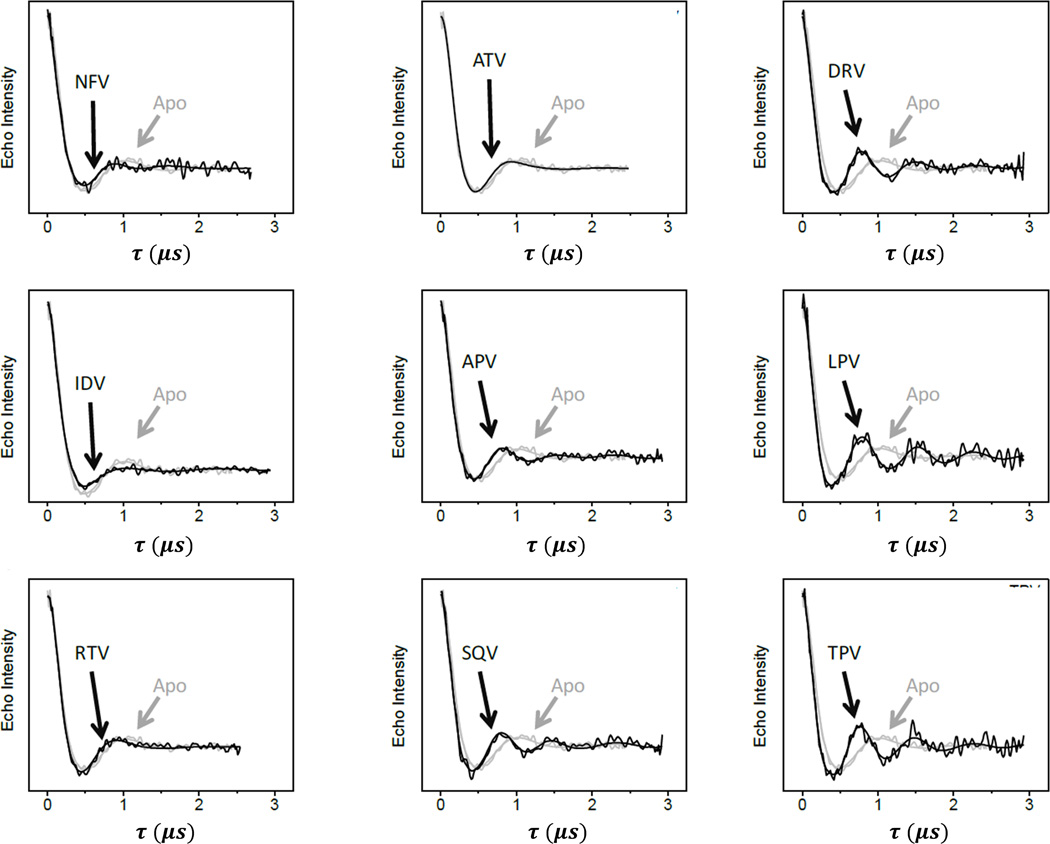
Figure 5 compares the background-corrected time domain DEER traces for the HIV-1 PR variant V6 in the absence and presence of nine FDA-approved inhibitors. Indinavir (IDV), Nelfinavir (NFV), and Atazanavir (ATV) are found to have minimal effects on the DEER dipolar evolution curves compared to apo-enzyme; a small decrease of the first echo amplitude minimum from 515 ns for apo-enzyme to 485 ns can be observed for inhibitor-bound enzyme. This small 30 ns decrease indicates that there is little change in the dipole-dipole distance between the spin labels at site K55C when inhibitor is introduced, indicating that IDV, NFV and ATV have a minimal impact on conformational sampling of V6 and potentially imply drug tolerance or resistance. The DEER modulation curve of V6 in the presence of Ritonavir (RTV) also differs only slightly from the apo enzyme; the first minimum is shifted by −67 ns to 448 ns. For a point of comparison, the first echo minima observed with subtypes B and C occur > 100 ns sooner. This result is not unexpected because the drug-pressure selected mutations in V6 were selected under RTV therapy; and according to the previous protein kinetics assay,36 the inhibition constant (Ki) for V6 increased by > 42 fold relative to the value for subtype B, which was originally in the sub-nano-molar regime. For the remaining inhibitors, the trend of the location of the first minimum of the echo curve is similar to those observed for subtypes B and C. Tipranavir (TPV), Saquinavir (SQV), and Darunavir (DRV) have a strong effect on the dipolar evolution curve producing a rather large shift of the first minimum in the modulated echo amplitude by approximately −115 to −120 ns. Lopinavir (LPV) and Amprenavir (APV) have slightly less effect in the dipolar evolution curves; only decreasing the first minimum by 86 ns, from 515 ns to 429 ns. As a general rule, because the spin labels are located within the “flaps” of the each HIV-1PR monomer, changes in dipole-dipole distances measured using DEER correspond to alterations in the relative orientations of the flaps. Shifts to shorter times in the evolution curves correspond to an increase in strength of the dipolar interaction between the two spin-labels, indicating that a conformational re-arrangement to a shorter distance has occurred. Figure 3 shows that the most probable distances between spin-labels for the semi-open and closed conformations are reduced by approximately 3 Å. Previously, we have shown that this inhibitor induced shift to a higher percentage of the close population tracks with inhibition.74, 78, 100 This observation is significant as it demonstrates the correlation between inhibition constants of inhibitors and HIV-1PR conformation as observed using time domain DEER data.
Figure 5.
Overlay of background-corrected DEER dipolar evolution curves for V6-PR in the presence of nine FDA-approved inhibitors (black) compared to the data obtained for apo-V6 (grey).
3.2 DEER Distance Profile and Flap Conformation Ensemble of V6
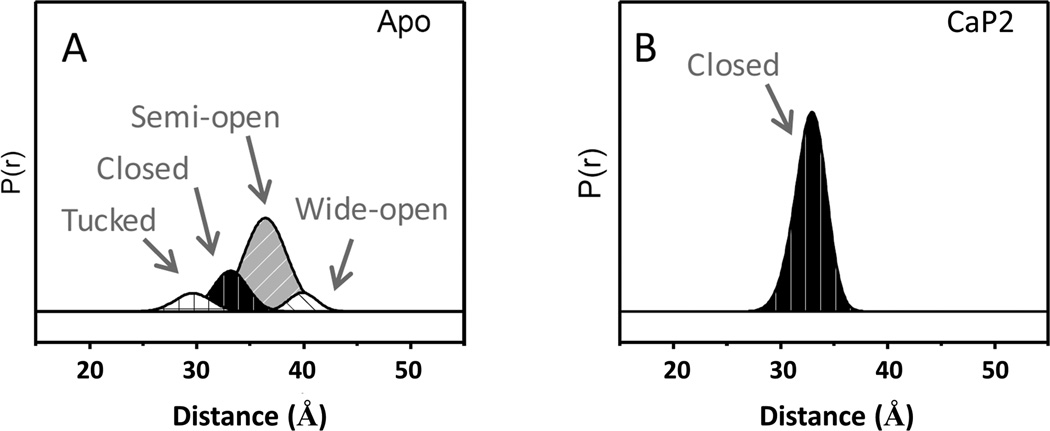
Although the changes in the time domain DEER data can be diagnostic, it is most effective to analyze these data after transforming to a distance domain representation using fitting methods such as TKR (described above and in Figure 4).97 The TKR procedure converts the modulations in the time domain to a distribution of dipolar distances (P(r)). The general shape of the distributions can most often be adequately regenerated as a linear combination of Gaussian distributions, which can be combined or evaluated individually as varying conformations within the ensemble. The breadth of the distribution, or each individual distribution, is reflective of the relative flexibility of the protein coupled to the conformational freedom of the spin label(s) that give rise to the corresponding modulations. Figure 6 shows the Gaussian reconstructions for the apo and CaP2-bound V6 construct in distance profiles where four different flap conformations are used in the fitting; termed curled/tucked (25–30 Å), closed (30–35 Å), semi-open (35–40 Å) and wide-open (40–50 Å) states. These conformational assignments are determined from X-ray crystallography and MD modeling.22, 67, 76 The distance profile for apo V6 was fit to four Gaussian-shaped populations corresponding to the four conformations, representing 10% curled/tucked, 21% closed, 61% semi-open, and 8 % wide-open. Interestingly, the CaP2 bound distance profile is fit by a single population that corresponds to the closed conformation centered at 33 Å. Given CaP2 is a non-hydrolyzable substrate analog, this “inhibitor” acts as a positive control in many of the DEER experiments. As shown here, CaP2 results in ~ 100% closed conformation.
Figure 6.
Gaussian-shaped populations used to reconstruct the distance profiles of apo and CaP2-bound V6-PR.115
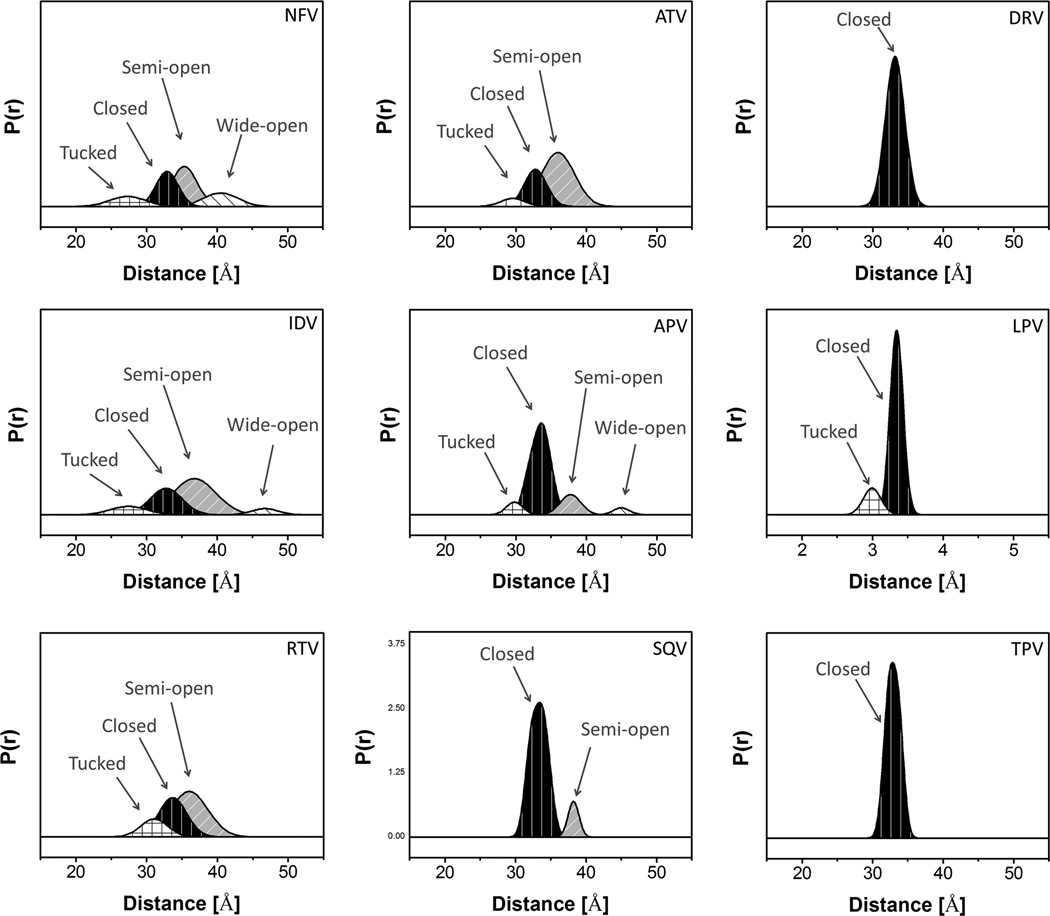
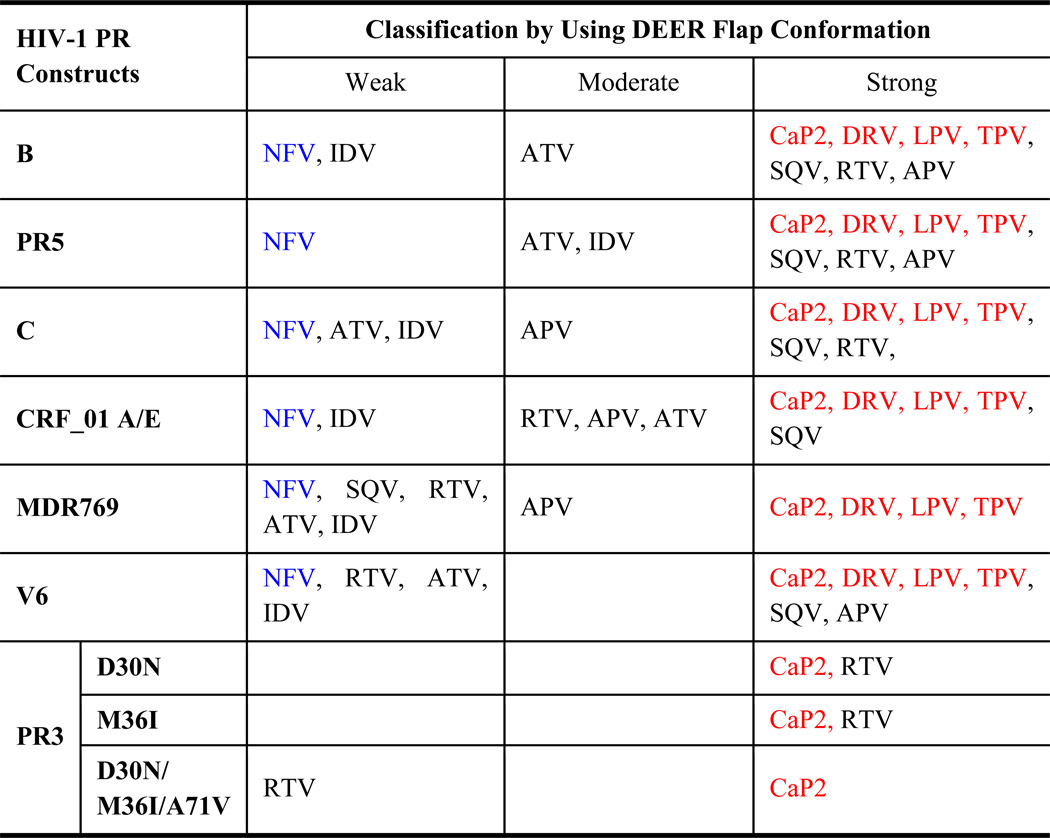
Figure 7 shows the same analyses for the nine inhibitor-bound distance profiles for V6. The corresponding population percentages are given in Table 1. For inhibitors NFV, IDV, RTV, and ATV, the conformational ensembles are dominated by a semi-open conformation with relative percentages of 39%, 54%, 51% and 63% (±5%); respectively. The second largest populations correspond to the inhibitor-induced closed conformation, which represents ~30% for all inhibitors. The inhibitor induced shift to the closed population increased by ~ 20% compared to apo-V6, indicating less potency of the drug in binding with the protease; which corroborates with the increased Ki values of NFV, IDV and RTV of 14, 22 and 42 fold, respectively, compared to subtype B.36 Of these four weak inhibitors, NFV and IDV also have wide-open populations that contribute 17% and 6% of the total population, which may facilitate inhibitor escape from the catalytic pocket. In contrast to the four weak inhibitors above, large populations of the closed conformation are generated for APV,SQV, DRV, LPV, and TPV , which comprise 80%, 96%, 89%, 83%, and 92% of the conformational ensemble; respectively. We classify these inhibitors as being strong since they induce an increase in the difference of the fractional occupancy of the closed state compared to apo-enzyme, Δc%, by > 50%. Accordingly, we anticipate that these inhibitors would have Ki values similar to those of subtype B, but to date these measurements have not yet been made. The designations of inhibitors as “strong”, “moderate” and “weak” are based upon their ability to change the fractional occupancy of the closed state (Δc%) by greater than 50%, between 50 and 20%, and less than 20%; respectively.67, 74, 78, 100 The assignments of inhibitor strength with V6 are given in Table 2 and discussed further below.
Figure 7.
Gaussian-shaped populations used to reconstruct the distance profiles for V6-PR in the presence of nine- FDA-approved inhibitors, with conformational populations labeled.
Table 1.
Parameters of Gaussian-shaped populations used to reconstruct distance profiles for clinical isolate, V6, Ki values of V6 and subtype B constructs and the relative ratio.
| Samples | Curled/Tucked % (population) |
Closed % (population) |
Semi-open % (population) |
Wide-open % (population) |
Ki of V6 a (nM) |
Ki of B a (nM) |
Ratio of Ki V6/B a |
|---|---|---|---|---|---|---|---|
| 25–30Å | 30–35Å | 35–40Å | 40–50Å | ||||
| Apo | 10 | 21 | 61 | 8 | -- | -- | -- |
| CaP2 | 0 | 100 | 0 | 0 | -- | -- | -- |
| DRV | 0 | 100 | 0 | 0 | -- | -- | -- |
| LPV | 17 | 83 | 0 | 0 | -- | 0.11±0.03 | -- |
| TPV | 0 | 100 | 0 | 0 | -- | 0.4±0.04 | -- |
| SQV | 0 | 87 | 13 | 0 | -- | 2.2±0.3 | -- |
| APV | 8 | 72 | 16 | 4 | -- | 0.4±0.1 | -- |
| RTV | 15 | 34 | 51 | 0 | 30±2 | 0.7±0.1 | 42 |
| ATV | 7 | 30 | 63 | 0 | -- | 0.07±0.01 | -- |
| IDV | 10 | 30 | 54 | 6 | 69±8 | 3.1±0.1 | 22 |
| NFV | 14 | 30 | 39 | 17 | 17±3 | 1.2±0.2 | 14 |
Table 2.
Summary of the Strength of Inhibitors classified by conformational shifts of HIV-1PR.
4. Discussion
4.1 Impact of Natural Polymorphisms and Drug-Pressure Selected Mutations on Inhibitor Induced Shifts
HIV-1PR flaps regulate enzymatic function and fitness by mediating access to the active site. As such, their function is critical for maturation of the retrovirus. Flap conformational changes are important for inhibitor/substrate access and escape from the catalytic pocket,21, 103–108 where binding of the substrate or inhibitors induces changes in flap conformation to a closed state, thereby minimizing the chance of a ligand to escape from the pocket. This behavior and the corresponding flap conformational states have been confirmed by X-ray crystallography,6, 38, 109, 110 evaluated by molecular dynamics simulations, 18, 21, 40, 104–108, 111 and observed in DEER measurements.15, 74, 76, 77 Among these techniques, DEER is capable of experimentally discriminating between the four proposed conformational states (closed, semi-open, wide-open and curled/tucked) while also yielding their fractional occupancies in conformational ensembles using data acquisition strategies that are routine and systematic. Based on our previous analyses, the population of the closed states,67, 74, 78, 100 the inhibitor-induced shifts of the closed state (Δ(c)%),100 and the ratio of closed/open-like states43 are hypothesized to be viable indications of enzyme efficiency and resistance to inhibitors.
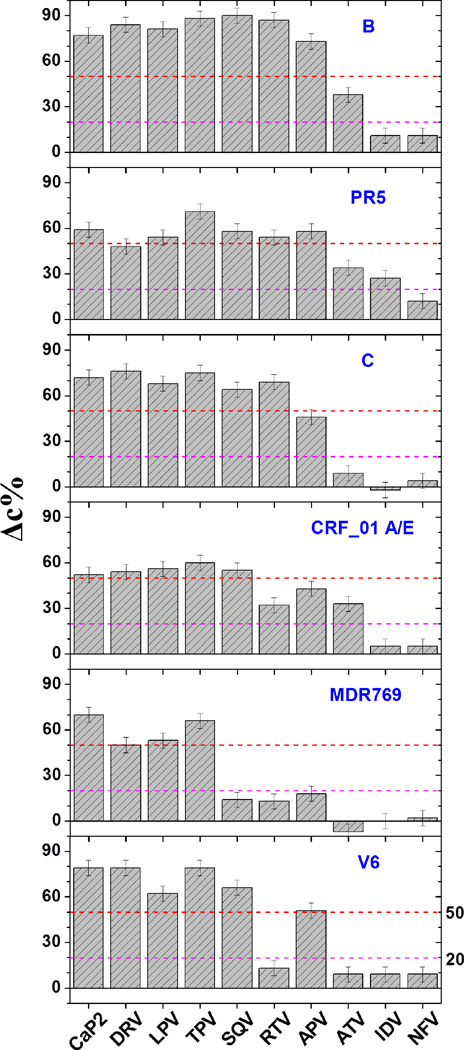
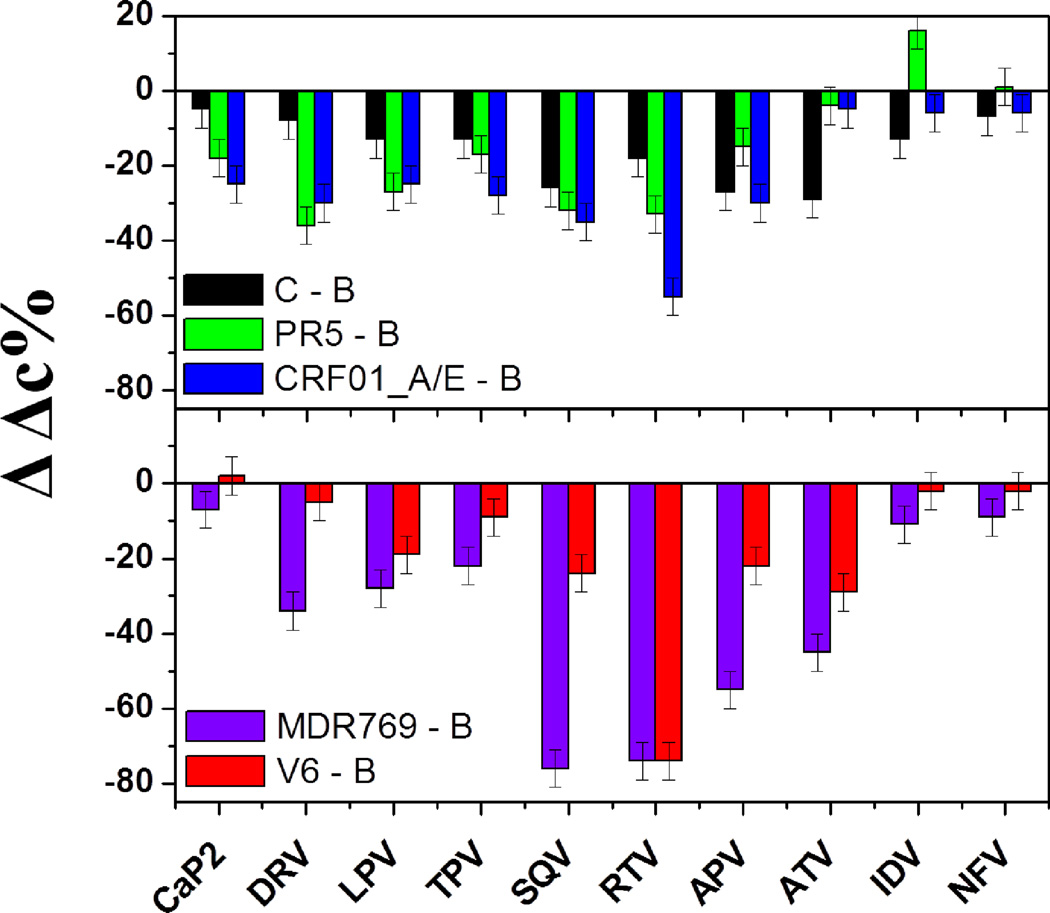
Natural polymorphisms, which oftentimes also correspond to secondary drug-pressure selected mutations, do not typically generate immediate drug resistance to the current PIs. However, they determine the characteristic responses to the drug treatment and may enhance the rate of drug resistance development by reducing the time associated with fitness restoring processes.4, 24, 38 Figure 8 shows the inhibitor-induced population shift to the closed state upon inhibitor binding for a series of HIV-1PR constructs that our lab has studied in detail.67, 76–78, 100 In addition to subtype B, these include three drug-naïve variants or subtypes (PR5, C and CRF_01 A/E) and three drug resistant variants of subtype B (PR3, MDR769 and V6). Analysis of the data in Figure 8 shows that, in nearly all cases, inhibitors induce a stronger shift to the closed state for subtype B than any other variant we have studied to date. The presence of the natural polymorphisms mitigates the induced conformational shift, thus implying a weaker inhibitor-protein interaction in these constructs. These effects are quite pronounced for CRF_01 A/E, with decreased values of Δc% near 60% where these numbers were > 80% in subtype B. When inspecting the data for constructs containing drug-pressure selected mutations, it can be seen that numerous inhibitors that are classified as “strong” for subtype B, now fall into the “weak” category. For example, with V6, the typically strong binding inhibitor RTV is observed to induce only a weak shift to the closed state (Δc% decrease of only 15% compared to ~ 85% in subtype B). This is consistent with differences in the Ki values for subtype B and V6 36 and that V6 evolved in response to RTV therapy.36, 112 A similar effect is observed for MDR769, which showed clinical resistance to SQV, RTV and APV. These three inhibitors are now categorized as having a “weak” effect on shifting the conformational ensemble. Figure 9 replots the data in Figure 8 as a difference in Δc% relative to subtype B (ΔΔc%), readily showing the impact the mutations have on inhibitor-induced conformational shifts. In nearly all cases the inhibitor induced shifts are diminished as a function of both natural polymorphisms and drug-pressure selected mutations. Interestingly, IDV has a stronger conformational effect in PR5 than in subtype B.
Figure 8.
Bar graphs showing the inhibitor-induced shifts to the closed state, Δc%, with inhibitors for PR natural variants (B, PR5, C and CRF_01A/E), drug-resistant construct (MDR769) and clinical isolates (V6). The relative shift of the closed state is calculated as Δc% = [percentage closed (inhibitor)] – [percentage closed (apo)]. The magenta and red lines correspond to the arbitrary cut-offs to designate weak (<20%), strong (>50%) and moderate (20%< Δc%< 50%) effects of inhibitors on shifting the conformational ensemble.
Figure 9.
Bar graphs showing changes of the inhibitor-induced shifts to the closed state, ΔΔc%, of three natural variants and two drug-resistant constructs comparing with B construct. ΔΔc% = [Δc% (variant)] – [Δc% (B construct)].
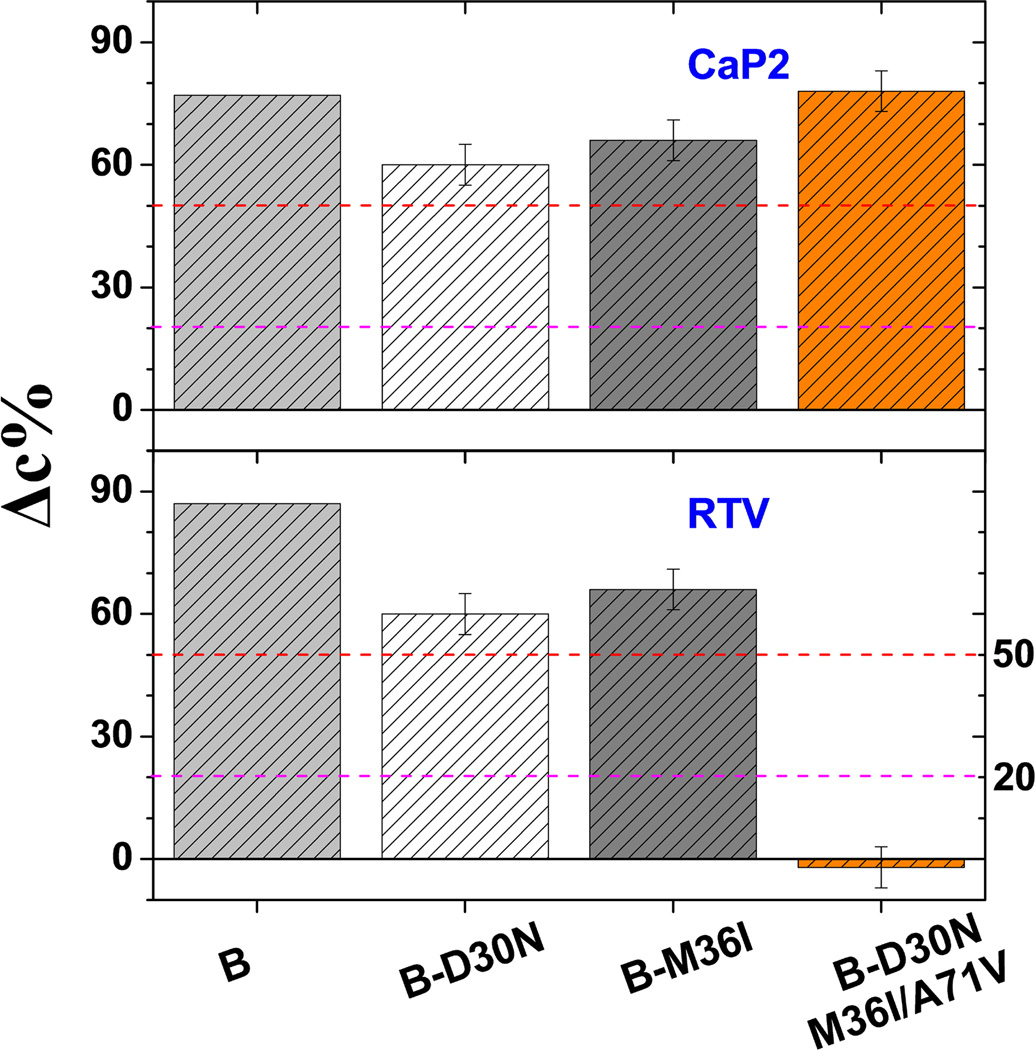
For PR3, which evolves the primary mutation D30N in response to NFV therapy but gains cross resistance to RTV and IDV upon accumulation of A71V and M36I,36 DEER results show altered inhibitor effectiveness reflected in the changes to the closed population as mutations accumulated (Figure 10). Specifically, the ability of RTV to induce a closed conformation is completely lost upon accumulation of the three mutations. Interestingly, although the three mutations abolish RTV induced conformational shifts, the substrate analog CaP2 can bind and efficiently alter the conformation. This observation is consistent with measurements of catalytic activity and inhibition where the combination of the three mutations leads to cross resistance but where enzymatic activity was restored to near wild-type levels.36
Figure 10.
Plots of inhibitor-induced shift to the closed state, Δc%, for PR3 B-mutants carrying a combination of drug-resistant mutations including D30N, M36I and A71V
Table 2 summarizes the classification of effects of inhibitors on HIV-1PR constructs we have studied to date. The demarcations separating the strong to moderate effects and moderate to weak effects are shown as magenta lines (20%) and red lines (50%), respectively, in Figures 8 and 10. A few trends can be noted. For the constructs reported here, NFV (shown in blue text) always demonstrates a weak tendency to shift the conformational ensemble. On the other hand, CaP2, LPV, TPV and DRV always have a strong effect on shifting the conformational ensemble to the closed state, and the effectiveness of the other inhibitors is found to vary among the classifications.
4.2 Relating Conformational Shifts to Protein-Ligand Exchange Rates
Drug naïve constructs, clinical isolates and drug-resistant variants show dramatically different shifts in the fractional occupancies of the conformers in the conformational ensemble in the presence of the inhibitors. As reported in our previous study,78, 100 the values of Δc% are correlated with the time scale of inhibitor binding as assayed using hetero-nuclear single quantum coherence (HSQC) NMR spectra. Given that DEER data are collected on frozen samples, the correlation between shifts to the closed-state and time scales of interactions between HIV-1PR and inhibitors indicates that the effectiveness of an inhibitor to induce flap closure is related to the timescale on which the interaction occurs.78, 100 HSQC is a powerful method to assay the dynamics of ligand-bound and ligand-free enzyme in terms of the slow, intermediate or fast exchange. Consequently, it indicates that inhibitors that bind strongly according to DEER data have a slow exchange rate, whereas those classified as “weak” undergo fast exchange. It is noteworthy to point out that the “weak” inhibitors may not be fully dissociated from the binding pocket, but instead experience some motional freedom and therefore may not lock the flaps into the closed conformation.100, 113, 114 These previous NMR studies validate the utility of DEER experiments even with the consideration that DEER samples are frozen (data collected between 65 and 80 K). The correlations between IC50 and Δc% for MDR769 compared to subtype B 78 further validate the utility of DEER as a tool for relating changes in conformational shifts to in vitro and possibly in vivo studies.
5. Conclusions
The conformation ensemble of V6 HIV-1PR, a drug-resistant variant isolated from a pediatric patient under the drug therapy of RTV, was studied by SDSL-DEER in the presence/absence of the nine FDA approved PIs and substrate mimic CaP2. DEER results clearly show distinct distance profiles that corroborate with a structural and mechanistic model of HIV-1PR conformational sampling. The comparisons of time-domain DEER echo modulation curves for inhibitor-bound and drug-free constructs suggest that NFV, IDV, ATV and RTV are “weak” inhibitors in that they are found to minimally shift the conformational ensemble to the closed-state, which correlates with the weak inhibition kinetics measured for these inhibitors. The DEER distance profiles of V6 show a predominant occupation of the semi-open state in the presence of these weak inhibitors. In contrast, the distance profiles for strong inhibitors such as DRV, LPV, TPV, SQV and APV-bound V6 adopt a mainly closed conformational state. Considering the inability of these inhibitors to stabilize the closed conformational state, these experimental data indicate that V6 should be resistant to inhibition by NFV, IDV, ATV and RTV. This notion is supported by previous protein kinetics assays where drug-resistance is confirmed by the increase in Ki of NFV, IDV and RTV by 14, 22 and 42 fold, respectively, relative to the wild-type subtype B construct.
An overview of the HIV-1PR constructs we have studied clearly shows that natural polymorphisms and drug pressure selected mutations alter the conformational sampling landscape and the ability of inhibitors to induce flap closure in the presence of these mutations. Accordingly, the decrease in value of Δc% for the non-B drug naïve variants may indicate that natural polymorphisms in the hinge region are responsible for altering protein flexibility, possibly by the hydrophobic sliding mechanism.40 Based on Δc% values, we categorize the nine FDA approved inhibitors and CaP2 as weak, moderate or strong ligands for HIV-1PR. Shifts in populations of conformations for HIV-1PR upon ligand binding correlate with IC50 and Ki values, which further rationalizes the use of the DEER measurement to study conformational sampling in biological macromolecules.
Supplementary Material
Acknowledgements
This work was supported by the National Institutes of Health S10RR031603 and GM105409 (G.E.F.), National Science Foundation MCB-0746533 and MCB-1329467 (G.E.F), NHMFL-IHRP and AHA (pre-doctoral fellowships to J.L.K. and L.G.). We thank Dr. Alexander Angerhofer for maintenance of our shared EPR facility and Dr. Ben M. Dunn for useful discussions.
References
- 1.UNAIDS Report on the Global AIDS Epidemic. Joint United Nations Programme on HIV/AIDS (UNAIDS); 2014. [Google Scholar]
- 2.Santos AF, Soares MA. Viruses. 2010;2:503–531. doi: 10.3390/v2020503. [DOI] [PMC free article] [PubMed] [Google Scholar]
- 3.Wainberg MA, Brenner BG. Viruses. 2010;2:2493–2508. doi: 10.3390/v2112493. [DOI] [PMC free article] [PubMed] [Google Scholar]
- 4.Shafer RW, Schapiro JM. Aids Rev. 2008;10:67–84. [PMC free article] [PubMed] [Google Scholar]
- 5.Martinez-Cajas JL, Pant-Pai N, Klein MB, Wainberg MA. Aids Rev. 2008;10:212–223. [PubMed] [Google Scholar]
- 6.Weber IT, Agniswamy J. Viruses. 2009;1:1110–1136. doi: 10.3390/v1031110. [DOI] [PMC free article] [PubMed] [Google Scholar]
- 7.Taylor BS, Hammer SM. N Engl J Med. 2008;359:1965–1966. doi: 10.1056/NEJMc086373. [DOI] [PubMed] [Google Scholar]
- 8.Clemente JC, Coman RM, Thiaville MM, Janka LK, Jeung JA, Nukoolkarn S, Govindasamy L, Agbandje-McKenna M, McKenna R, Leelamanit W, Goodenow MM, Dunn BM. Biochemistry. 2006;45:5468–5477. doi: 10.1021/bi051886s. [DOI] [PMC free article] [PubMed] [Google Scholar]
- 9.Walensky RP, Paltiel AD, Losina E, Mercincavage LM, Schackman BR, Sax PE, Weinstein MC, Freedberg KA. J Infect Dis. 2006;194:11–19. doi: 10.1086/505147. [DOI] [PubMed] [Google Scholar]
- 10.Martinez-Cajas JL, Wainberg MA. Antiviral Res. 2007;76:203–221. doi: 10.1016/j.antiviral.2007.06.010. [DOI] [PubMed] [Google Scholar]
- 11.Wlodawer A, Gustchina A. Biochim Biophys Acta. 2000;1477:16–34. doi: 10.1016/s0167-4838(99)00267-8. [DOI] [PubMed] [Google Scholar]
- 12.Wlodawer A, Vondrasek J. Annu Rev Biophys Biomol Struct. 1998;27:249–284. doi: 10.1146/annurev.biophys.27.1.249. [DOI] [PubMed] [Google Scholar]
- 13.Ashorn P, McQuade TJ, Thaisrivongs S, Tomasselli AG, Tarpley WG, Moss B. Proc Natl Acad Sci U S A. 1990;87:7472–7476. doi: 10.1073/pnas.87.19.7472. [DOI] [PMC free article] [PubMed] [Google Scholar]
- 14.Heaslet H, Rosenfeld R, Giffin M, Lin YC, Tam K, Torbett BE, Elder JH, McRee DE, Stout CD. Acta crystallographica. Section D, Biological crystallography. 2007;63:866–875. doi: 10.1107/S0907444907029125. [DOI] [PubMed] [Google Scholar]
- 15.Galiano L, Bonora M, Fanucci GE. J Am Chem Soc. 2007;129 doi: 10.1021/ja073684k. 11004-+. [DOI] [PubMed] [Google Scholar]
- 16.Ishima R, Freedberg DI, Wang YX, Louis JM, Torchia DA. Structure. 1999;7:1047–1055. doi: 10.1016/s0969-2126(99)80172-5. [DOI] [PubMed] [Google Scholar]
- 17.Freedberg DI, Ishima R, Jacob J, Wang YX, Kustanovich I, Louis JM, Torchia DA. Protein Sci. 2002;11:221–232. doi: 10.1110/ps.33202. [DOI] [PMC free article] [PubMed] [Google Scholar]
- 18.Tozzini V, Trylska J, Chang CE, McCammon JA. J Struct Biol. 2007;157:606–615. doi: 10.1016/j.jsb.2006.08.005. [DOI] [PubMed] [Google Scholar]
- 19.Toth G, Borics A. J Mol Graph Model. 2006;24:465–474. doi: 10.1016/j.jmgm.2005.08.008. [DOI] [PubMed] [Google Scholar]
- 20.Karthik S, Senapati S. Proteins. 2011;79:1830–1840. doi: 10.1002/prot.23008. [DOI] [PubMed] [Google Scholar]
- 21.Hornak V, Okur A, Rizzo RC, Simmerling C. Proc Natl Acad Sci U S A. 2006;103:915–920. doi: 10.1073/pnas.0508452103. [DOI] [PMC free article] [PubMed] [Google Scholar]
- 22.Ding F, Layten M, Simmerling C. J Am Chem Soc. 2008;130:7184–7185. doi: 10.1021/ja800893d. [DOI] [PMC free article] [PubMed] [Google Scholar]
- 23.Kantor R, Fessel WJ, Zolopa AR, Israelski D, Shulman N, Montoya JG, Harbour M, Schapiro JM, Shafer RW. Antimicrob Agents Chemother. 2002;46:1086–1092. doi: 10.1128/AAC.46.4.1086-1092.2002. [DOI] [PMC free article] [PubMed] [Google Scholar]
- 24.Wilson SI, Phylip LH, Mills JS, Gulnik SV, Erickson JW, Dunn BM, Kay J. Biochim Biophys Acta. 1997;1339:113–125. doi: 10.1016/s0167-4838(96)00224-5. [DOI] [PubMed] [Google Scholar]
- 25.Anderson AC. Acs Chem Biol. 2012;7:278–288. doi: 10.1021/cb200394t. [DOI] [PMC free article] [PubMed] [Google Scholar]
- 26.Clore GM. Mol Biosyst. 2008;4:1058–1069. doi: 10.1039/b810232e. [DOI] [PMC free article] [PubMed] [Google Scholar]
- 27.Smock RG, Gierasch LM. Science. 2009;324:198–203. doi: 10.1126/science.1169377. [DOI] [PMC free article] [PubMed] [Google Scholar]
- 28.Baldwin AJ, Kay LE. Nat Chem Biol. 2009;5:808–814. doi: 10.1038/nchembio.238. [DOI] [PubMed] [Google Scholar]
- 29.Ma B, Nussinov R. Curr Opin Chem Biol. 2010;14:652–659. doi: 10.1016/j.cbpa.2010.08.012. [DOI] [PMC free article] [PubMed] [Google Scholar]
- 30.Csermely P, Palotai R, Nussinov R. Trends Biochem Sci. 2010;35:539–546. doi: 10.1016/j.tibs.2010.04.009. [DOI] [PMC free article] [PubMed] [Google Scholar]
- 31.Yon JM, Perahia D, Ghelis C. Biochimie. 1998;80:33–42. doi: 10.1016/s0300-9084(98)80054-0. [DOI] [PubMed] [Google Scholar]
- 32.Johnson VA, Calvez V, Gunthard HF, Paredes R, Pillay D, Shafer R, Wensing AM, Richman DD. Top Antivir Med. 2011;19:156–164. [PMC free article] [PubMed] [Google Scholar]
- 33.Nalam MN, Schiffer CA. Curr Opin Hiv Aids. 2008;3:642–646. doi: 10.1097/COH.0b013e3283136cee. [DOI] [PMC free article] [PubMed] [Google Scholar]
- 34.Mahalingam B, Boross P, Wang YF, Louis JM, Fischer CC, Tozser J, Harrison RW, Weber IT. Proteins. 2002;48:107–116. doi: 10.1002/prot.10140. [DOI] [PubMed] [Google Scholar]
- 35.Mo H, Parkin N, Stewart KD, Lu L, Dekhtyar T, Kempf DJ, Molla A. Antimicrob Agents Chemother. 2007;51:732–735. doi: 10.1128/AAC.00690-06. [DOI] [PMC free article] [PubMed] [Google Scholar]
- 36.Clemente JC, Moose RE, Hemrajani R, Whitford LR, Govindasamy L, Reutzel R, McKenna R, Agbandje-McKenna M, Goodenow MM, Dunn BM. Biochemistry-Us. 2004;43:12141–12151. doi: 10.1021/bi049459m. [DOI] [PubMed] [Google Scholar]
- 37.Clemente JC, Hemrajani R, Blum LE, Goodenow MM, Dunn BM. Biochemistry-Us. 2003;42:15029–15035. doi: 10.1021/bi035701y. [DOI] [PubMed] [Google Scholar]
- 38.Bandaranayake RM, Kolli M, King NM, Nalivaika EA, Heroux A, Kakizawa J, Sugiura W, Schiffer CA. J Virol. 2010;84:9995–10003. doi: 10.1128/JVI.00505-10. [DOI] [PMC free article] [PubMed] [Google Scholar]
- 39.Piana S, Carloni P, Rothlisberger U. Protein Sci. 2002;11:2393–2402. doi: 10.1110/ps.0206702. [DOI] [PMC free article] [PubMed] [Google Scholar]
- 40.Foulkes-Murzycki JE, Scott WR, Schiffer CA. Structure. 2007;15:225–233. doi: 10.1016/j.str.2007.01.006. [DOI] [PMC free article] [PubMed] [Google Scholar]
- 41.Chang MW, Torbett BE. J Mol Biol. 2011;410:756–760. doi: 10.1016/j.jmb.2011.03.038. [DOI] [PMC free article] [PubMed] [Google Scholar]
- 42.Ragland DA, Nalivaika EA, Nalam MNL, Parachanronarong K, Cao H, Bandaranayake RM, Cai Y, Kurt-Yilmaz N, Schiffer CA. J Am Chem Soc. 2014;136:11956–11963. doi: 10.1021/ja504096m. [DOI] [PMC free article] [PubMed] [Google Scholar]
- 43.de Vera IMS, Smith AN, Dancel MCA, Huang X, Dunn BM, Fanucci GE. Biochemistry. 2013;52:3278–3288. doi: 10.1021/bi400109d. [DOI] [PMC free article] [PubMed] [Google Scholar]
- 44.Bar-Magen T, Donahue DA, McDonough EI, Kuhl BD, Faltenbacher VH, Xu H, Michaud V, Sloan RD, Wainberg MA. AIDS (London, England) 2010;24:2171–2179. doi: 10.1097/QAD.0b013e32833cf265. [DOI] [PubMed] [Google Scholar]
- 45.Coman RM, Robbins A, Goodenow MM, McKenna R, Dunn BM. Acta Crystallogr Sect F Struct Biol Cryst Commun. 2007;63:320–323. doi: 10.1107/S174430910701161X. [DOI] [PMC free article] [PubMed] [Google Scholar]
- 46.Coman RM, Robbins AH, Goodenow MM, Dunn BM, McKenna R. Acta Crystallogr D Biol Crystallogr. 2008;D64:754–763. doi: 10.1107/S090744490801278X. [DOI] [PubMed] [Google Scholar]
- 47.Coutsinos D, Invernizzi CF, Xu H, Brenner BG, Wainberg MA. Antivir Chem Chemother. 2010;20:117–131. doi: 10.3851/IMP1443. [DOI] [PubMed] [Google Scholar]
- 48.Lisovsky I, Schader SM, Martinez-Cajas JL, Oliveira M, Moisi D, Wainberg MA. Antimicrob Agents Chemother. 2010;54:2878–2885. doi: 10.1128/AAC.01828-09. [DOI] [PMC free article] [PubMed] [Google Scholar]
- 49.Soares RO, Batista PR, Costa MG, Dardenne LE, Pascutti PG, Soares MA. J Mol Graph Model. 2010;29:137–147. doi: 10.1016/j.jmgm.2010.05.007. [DOI] [PubMed] [Google Scholar]
- 50.de Medeiros RM, Junqueira DM, Matte MC, Barcellos NT, Chies JA, Matos Almeida SE. J Med Virol. 2011;83:1682–1688. doi: 10.1002/jmv.22188. [DOI] [PubMed] [Google Scholar]
- 51.Yu D, Sutherland D, Ghidinelli M, Jordan M. Aids Rev. 2011;13:214–226. [PubMed] [Google Scholar]
- 52.Gonzalez LM, Brindeiro RM, Aguiar RS, Pereira HS, Abreu CM, Soares MA, Tanuri A. Antimicrob Agents Chemother. 2004;48:3552–3555. doi: 10.1128/AAC.48.9.3552-3555.2004. [DOI] [PMC free article] [PubMed] [Google Scholar]
- 53.Soares EA, Santos AF, Sousa TM, Sprinz E, Martinez AM, Silveira J, Tanuri A, Soares MA. Plos One. 2007;2:e730. doi: 10.1371/journal.pone.0000730. [DOI] [PMC free article] [PubMed] [Google Scholar]
- 54.Ariyoshi K, Matsuda M, Miura H, Tateishi S, Yamada K, Sugiura W. J Acquir Immune Defic Syndr. 2003;33:336–342. doi: 10.1097/00126334-200307010-00007. [DOI] [PubMed] [Google Scholar]
- 55.Martinez-Cajas JL, Pai NP, Klein MB, Wainberg MA. J Int Aids Soc. 2009;12:11. doi: 10.1186/1758-2652-12-11. [DOI] [PMC free article] [PubMed] [Google Scholar]
- 56.Sturmer M, Stephan C, Gute P, Knecht G, Bickel M, Brodt HR, Doerr HW, Gurtler L, Lecocq P, van Houtte M. Antimicrob Agents Chemother. 2011;55:5362–5366. doi: 10.1128/AAC.00611-11. [DOI] [PMC free article] [PubMed] [Google Scholar]
- 57.Monteiro-Cunha JP, Araujo AF, Santos E, Galvao-Castro B, Alcantara LC. AIDS Res Hum Retroviruses. 2011;27:623–631. doi: 10.1089/AID.2010.0126. [DOI] [PubMed] [Google Scholar]
- 58.Waleria-Aleixo A, Martins AN, Arruda MB, Brindeiro RM, Da-Silva RM, Nobre FF, Greco DB, Tanuri A. Antimicrob Agents Chemother. 2008;52:4497–4502. doi: 10.1128/AAC.00820-08. [DOI] [PMC free article] [PubMed] [Google Scholar]
- 59.Dumans AT, Barreto CC, Santos AF, Arruda M, Sousa TM, Machado ES, Sabino EC, Brindeiro RM, Tanuri A, Duarte AJ, Soares MA. Infect Genet Evol. 2009;9:62–70. doi: 10.1016/j.meegid.2008.10.002. [DOI] [PMC free article] [PubMed] [Google Scholar]
- 60.de Felipe B, Perez-Romero P, Abad-Fernandez M, Fernandez-Cuenca F, Martinez-Fernandez FJ, Trastoy M, Mata Rdel C, Lopez-Cortes LF, Leal M, Viciana P, Vallejo A. Virol J. 2011;8:416. doi: 10.1186/1743-422X-8-416. [DOI] [PMC free article] [PubMed] [Google Scholar]
- 61.Velazquez-Campoy A, Vega S, Freire E. Biochemistry-Us. 2002;41:8613–8619. doi: 10.1021/bi020160i. [DOI] [PubMed] [Google Scholar]
- 62.Coman RM, Robbins AH, Fernandez MA, Gilliland CT, Sochet AA, Goodenow MM, McKenna R, Dunn BM. Biochemistry. 2008;47:731–743. doi: 10.1021/bi7018332. [DOI] [PubMed] [Google Scholar]
- 63.Logsdon BC, Vickrey JF, Martin P, Proteasa G, Koepke JI, Terlecky SR, Wawrzak Z, Winters MA, Merigan TC, Kovari LC. J Virol. 2004;78:3123–3132. doi: 10.1128/JVI.78.6.3123-3132.2004. [DOI] [PMC free article] [PubMed] [Google Scholar]
- 64.Martin P, Vickrey JF, Proteasa G, Jimenez YL, Wawrzak Z, Winters MA, Merigan TC, Kovari LC. Structure. 2005;13:1887–1895. doi: 10.1016/j.str.2005.11.005. [DOI] [PubMed] [Google Scholar]
- 65.Vallurupalli P, Hansen DF, Lundstrom P, Kay LE. Journal of biomolecular NMR. 2009;45:45–55. doi: 10.1007/s10858-009-9310-6. [DOI] [PubMed] [Google Scholar]
- 66.Miller Y, Ma B, Nussinov R. Chem Rev. 2010;110:4820–4838. doi: 10.1021/cr900377t. [DOI] [PMC free article] [PubMed] [Google Scholar]
- 67.Huang X, Britto MD, Kear JL, Christopher BD, Rocca JR, Simmerling C, McKenna R, Bieri M, Gooley PR, Dunn BM, Fanucci GE. The Journal of biological chemistry. 2014;289:17203–17214. doi: 10.1074/jbc.M114.571836. [DOI] [PMC free article] [PubMed] [Google Scholar]
- 68.Carter JD, Gonzales EG, Huang X, Smith AN, de Vera IMS, D'Amore PW, Rocca JR, Goodenow MM, Dunn BM, Fanucci GE. Febs Lett. 2014;588:3123–3128. doi: 10.1016/j.febslet.2014.06.051. [DOI] [PMC free article] [PubMed] [Google Scholar]
- 69.Cai YF, Myint W, Paulsen JL, Schiffer CA, Ishima R, Yilmaz NK. J Chem Theory Comput. 2014;10:3438–3448. doi: 10.1021/ct4010454. [DOI] [PMC free article] [PubMed] [Google Scholar]
- 70.Robbins AH, Coman RM, Bracho-Sanchez E, Fernandez MA, Gilliland CT, Li M, Agbandje-McKenna M, Wlodawer A, Dunn BM, McKenna R. Acta Crystallogr D Biol Crystallogr. 2010;66:233–242. doi: 10.1107/S0907444909054298. [DOI] [PMC free article] [PubMed] [Google Scholar]
- 71.Bottcher J, Blum A, Dorr S, Heine A, Diederich WE, Klebe G. Chemmedchem. 2008;3:1337–1344. doi: 10.1002/cmdc.200800113. [DOI] [PubMed] [Google Scholar]
- 72.Agniswamy J, Shen CH, Aniana A, Sayer JM, Louis JM, Weber IT. Biochemistry. 2012;51:2819–2828. doi: 10.1021/bi2018317. [DOI] [PMC free article] [PubMed] [Google Scholar]
- 73.Scott WR, Schiffer CA. Structure. 2000;8:1259–1265. doi: 10.1016/s0969-2126(00)00537-2. [DOI] [PubMed] [Google Scholar]
- 74.Blackburn ME, Veloro AM, Fanucci GE. Biochemistry. 2009;48:8765–8767. doi: 10.1021/bi901201q. [DOI] [PubMed] [Google Scholar]
- 75.Carter JD, Smith AN, Gonzales E, de Vera IMS, Goodenow MM, Dunn BM, Fanucci GE. J Am Chem Soc. 2012 submitted. [Google Scholar]
- 76.Galiano L, Ding F, Veloro AM, Blackburn ME, Simmerling C, Fanucci GE. J Am Chem Soc. 2009;131:430–431. doi: 10.1021/ja807531v. [DOI] [PMC free article] [PubMed] [Google Scholar]
- 77.Kear JL, Blackburn ME, Veloro AM, Dunn BM, Fanucci GE. J Am Chem Soc. 2009;131:14650–14651. doi: 10.1021/ja907088a. [DOI] [PMC free article] [PubMed] [Google Scholar]
- 78.de Vera IMS, Blackburn ME, Fanucci GE. Biochemistry. 2012;51:7813–7815. doi: 10.1021/bi301010z. [DOI] [PMC free article] [PubMed] [Google Scholar]
- 79.Hubbell WL, Gross A, Langen R, Lietzow MA. Curr. Op. Struc. Biol. 1998;8:649–656. doi: 10.1016/s0959-440x(98)80158-9. [DOI] [PubMed] [Google Scholar]
- 80.Hubbell WL, Cafiso DS, Altenbach C. Nat Struct Biol. 2000;7:735–739. doi: 10.1038/78956. [DOI] [PubMed] [Google Scholar]
- 81.Fanucci GE, Cafiso DS. Curr Opin Struct Biol. 2006;16:644–653. doi: 10.1016/j.sbi.2006.08.008. [DOI] [PubMed] [Google Scholar]
- 82.Columbus L, Hubbell WL. Trends Biochem Sci. 2002;27:288–295. doi: 10.1016/s0968-0004(02)02095-9. [DOI] [PubMed] [Google Scholar]
- 83.Dawidowski D, Cafiso DS. Biophys J. 2013;104:1585–1594. doi: 10.1016/j.bpj.2013.02.004. [DOI] [PMC free article] [PubMed] [Google Scholar]
- 84.Duss O, Yulikov M, Jeschke G, Allain FHT. Nature Communications. 2014;5 doi: 10.1038/ncomms4669. [DOI] [PubMed] [Google Scholar]
- 85.Yang ZY, Jimenez-Oses G, Lopez CJ, Bridges MD, Houk KN, Hubbell WL. J Am Chem Soc. 2014;136:15356–15365. doi: 10.1021/ja5083206. [DOI] [PMC free article] [PubMed] [Google Scholar]
- 86.Jeschke G, Chechik V, Ionita P, Godt A, Zimmermann H, Banham J, Timmel CR, Hilger D, Jung H. Appl. Mag. Reson. 2006;30:473–498. [Google Scholar]
- 87.Jeschke G, Polyhach Y. Phys Chem Chem Phys. 2007;9:1895–1910. doi: 10.1039/b614920k. [DOI] [PubMed] [Google Scholar]
- 88.Galiano L, Blackburn ME, Veloro AM, Bonora M, Fanucci GE. J Phys Chem B. 2009;113:1673–1680. doi: 10.1021/jp8057788. [DOI] [PubMed] [Google Scholar]
- 89.Altenbach C, Oh KJ, Trabanino RJ, Hideg K, Hubbell WL. Biochemistry-Us. 2001;40:15471–15482. doi: 10.1021/bi011544w. [DOI] [PubMed] [Google Scholar]
- 90.Rabenstein MD, Shin YK. Proc Natl Acad Sci U S A. 1995;92:8239–8243. doi: 10.1073/pnas.92.18.8239. [DOI] [PMC free article] [PubMed] [Google Scholar]
- 91.Jeschke G, Panek G, Godt A, Bender A, Paulsen H. Appl Magn Reson. 2004;26:223–244. [Google Scholar]
- 92.Pannier M, Veit S, Godt A, Jeschke G, Spiess HW. J Magn Reson. 2000;142:331–340. doi: 10.1006/jmre.1999.1944. [DOI] [PubMed] [Google Scholar]
- 93.Borbat PP, Davis JH, Butcher SE, Freed JH. J Am Chem Soc. 2004;126:7746–7747. doi: 10.1021/ja049372o. [DOI] [PubMed] [Google Scholar]
- 94.Borbat PP, Mchaourab H, Freed JH. Biophys J. 2002;82:360A–360A. [Google Scholar]
- 95.Xu Q, Ellena JF, Kim M, Cafiso DS. Biochemistry-Us. 2006;45:10847–10854. doi: 10.1021/bi061051x. [DOI] [PMC free article] [PubMed] [Google Scholar]
- 96.Xiao W, Poirier MA, Bennett MK, Shin YK. Nat Struct Biol. 2001;8:308–311. doi: 10.1038/86174. [DOI] [PubMed] [Google Scholar]
- 97.Jeschke G. Chemphyschem. 2002;3:927–932. doi: 10.1002/1439-7641(20021115)3:11<927::AID-CPHC927>3.0.CO;2-Q. [DOI] [PubMed] [Google Scholar]
- 98.Torbeev VY, Raghuraman H, Mandal K, Senapati S, Perozo E, Kent SB. J Am Chem Soc. 2009;131:884–885. doi: 10.1021/ja806526z. [DOI] [PubMed] [Google Scholar]
- 99.Kear JL, Galiano L, Veloro AM, Busenlehner LS, Fanucci GE. J. Biophys. Chem. 2011;2:137–146. [Google Scholar]
- 100.Huang X, de Vera IMS, Veloro AM, Blackburn ME, Kear JL, Carter JD, Rocca JR, Simmerling C, Dunn BM, Fanucci GE. J Phys Chem B. 2012;116:14235–14244. doi: 10.1021/jp308207h. [DOI] [PMC free article] [PubMed] [Google Scholar]
- 101.Chiang YW, Borbat PP, Freed JH. J Magn Reson. 2005;172:279–295. doi: 10.1016/j.jmr.2004.10.012. [DOI] [PubMed] [Google Scholar]
- 102.de Vera IMS, Blackburn ME, Galiano L, Fanucci GE. Current Protocols in Protein Science. John Wiley & Sons, Inc.; 2001. [Google Scholar]
- 103.Wlodawer A, Miller M, Jaskolski M, Sathyanarayana BK, Baldwin E, Weber IT, Selk LM, Clawson L, Schneider J, Kent SBH. Science. 1989;245:616–621. doi: 10.1126/science.2548279. [DOI] [PubMed] [Google Scholar]
- 104.Li DC, Ji BH, Hwang K, Huang YG. J Phys Chem B. 2010;114:3060–3069. doi: 10.1021/jp1005549. [DOI] [PubMed] [Google Scholar]
- 105.Li DC, Liu MS, Ji BH, Hwang K, Huang YG. J Chem Phys. 2009;130 doi: 10.1063/1.3148022. [DOI] [PubMed] [Google Scholar]
- 106.Li DC, Liu MS, Ji BH, Hwang KC, Huang YG. Chem Biol Drug Des. 2012;80:440–454. doi: 10.1111/j.1747-0285.2012.01417.x. [DOI] [PubMed] [Google Scholar]
- 107.Pietrucci F, Marinelli F, Carloni P, Laio A. J Am Chem Soc. 2009;131:11811–11818. doi: 10.1021/ja903045y. [DOI] [PubMed] [Google Scholar]
- 108.Sadiq SK, De Fabritiis G. Proteins. 2010;78:2873–2885. doi: 10.1002/prot.22806. [DOI] [PubMed] [Google Scholar]
- 109.Spinelli S, Liu QZ, Alzari PM, Hirel PH, Poljak RJ. Biochimie. 1991;73:1391–1396. doi: 10.1016/0300-9084(91)90169-2. [DOI] [PubMed] [Google Scholar]
- 110.Agniswamy J, Shen CH, Wang YF, Ghosh AK, Rao KV, Xu CX, Sayer JM, Louis JM, Weber IT. J Med Chem. 2013;56:4017–4027. doi: 10.1021/jm400231v. [DOI] [PMC free article] [PubMed] [Google Scholar]
- 111.Layten M, Hornak V, Simmerling C. J Am Chem Soc. 2006;128:13360–13361. doi: 10.1021/ja065133k. [DOI] [PMC free article] [PubMed] [Google Scholar]
- 112.Molla A, Korneyeva M, Gao Q, Vasavanonda S, Schipper PJ, Mo HM, Markowitz M, Chernyavskiy T, Niu P, Lyons N, Hsu A, Granneman GR, Ho DD, Boucher CAB, Leonard JM, Norbeck DW, Kempf DJ. Nature Medicine. 1996;2:760–766. doi: 10.1038/nm0796-760. [DOI] [PubMed] [Google Scholar]
- 113.Panchal SC, Pillai B, Hosur MV, Hosur RV. Curr Sci India. 2000;79:1684–1695. [Google Scholar]
- 114.Katoh E, Louis JM, Yamazaki T, Gronenborn AM, Torchia DA, Ishima R. Protein Sci. 2003;12:1376–1385. doi: 10.1110/ps.0300703. [DOI] [PMC free article] [PubMed] [Google Scholar]
- 115.Blackburn ME. Ph.D. dissertation. Gainesville, FL, 32611, USA: University of Florida; 2010. [Google Scholar]
Associated Data
This section collects any data citations, data availability statements, or supplementary materials included in this article.


