Abstract
Polyubiquitination is a critical protein post-translational modification involved in a variety of processes in eukaryotic cells. The molecular basis for selective recognition of the polyubiquitin signals by cellular receptors is determined by the conformations polyubiquitin chains adopt; this has been demonstrated for K48- and K63-linked chains. Recent studies of the so-called non-canonical chains (linked via K6, K11, K27, K29, or K33) suggest they play important regulatory roles in growth, development, and immune system pathways, but biophysical studies are needed to elucidate the physical/structural basis of their interactions with receptors. A first step towards this goal is characterization of the conformations these chains adopt in solution. We assembled diubiquitins (Ub2) comprised of every lysine linkage. Using solution NMR measurements, small-angle neutron scattering (SANS), and in silico ensemble generation, we determined population-weighted conformational ensembles that shed light on the structure and dynamics of the non-canonical polyubiquitin chains. We found that polyubiquitin is conformationally heterogeneous, and each chain type exhibits unique conformational ensembles. For example, K6-Ub2 and K11-Ub2 (at physiological salt concentration) are in dynamic equilibrium between at least two conformers, where one exhibits a unique Ub/Ub interface, distinct from that observed in K48-Ub2 but similar to crystal structures of these chains. Conformers for K29-Ub2 and K33-Ub2 resemble recent crystal structures in the ligand-bound state. Remarkably, a number of diubiquitins adopt conformers similar to K48-Ub2 or K63-Ub2, suggesting potential overlap of biological function among different lysine linkages. These studies highlight the potential power of determining function from elucidation of conformational states.
Keywords: non-canonical polyubiquitin chains, residual dipolar couplings, small-angle neutron scattering, sparse ensemble selection, conformational ensemble
Introduction
Polyubiquitination is arguably one of the most important post-translational modifications of proteins in eukaryotes.1 The diversity of polyubiquitin signals derives from the ability of ubiquitin (Ub) to form covalent linkages between the C-terminus of one Ub and the ɛ-amino group of any of the seven lysines (K6, K11, K27, K29, K33, K48, K63) of the other Ub. Due to the positions of the lysines in Ub, each of these different lysine linkages impart unique structural and dynamical properties on a polyUb chain.2–5 In the cell, polyUb chains consisting of every lysine linkage have been found, but all in varying amounts.6–8 Some polyUb chains are upregulated during particular phases in the cell cycle, e.g., K11-linkages during cell division. The complexity of polyUb signals expands exponentially with number of Ubs, as polyUb chains can be homogeneous (all of one linkage type) or heterogeneous (mixed linkages), either of linear topology or branched9,10. It is therefore of paramount importance to elucidate the biochemical and biophysical properties of polyUb chains consisting of every lysine linkage.
The canonical (and most well-characterized) polyubiquitin chains are those linked via K48 or K63, which target substrates for proteasomal degradation or function in various non-degradative pathways, respectively.2 The cellular functions of the other, so-called non-canonical polyUb chains (K6, K11, K27, K29, K33) are substantially less understood. K6-polyubiquitination is linked to DNA repair processes,11 while K11 is linked to development and other roles associated with cell division and ERAD.12,13 Very recent findings revealed mostly non-proteolytic roles for K27-, K29-, and K33-polyUbs, including innate immune system regulation for K27- and K33-polyUbs14–16, and regulation of mRNA stability for K29-polyUb, among others.17–19
Biochemical studies of non-canonical polyUb chains had been impeded due to the lack of linkage-specific ubiquitin-conjugating enzymes needed to make many of these non-canonical linkages. With recent advances in chemical biology techniques employing native isopeptide linkages (e.g. 20,21) and recent discoveries of several linkage-specific deubiquitinating enzymes5, crystal structures have been obtained for the unbound versions of some of these chains (Figure 1).4,5,22–26 At the time of this writing, K27 remains the only lysine linkage for which there is no crystal structure. Importantly, the crystal structures (Figure 1) reveal that polyUb chains exist in multiple conformations. PolyUb chains are indeed very flexible, and therefore crystal structures do not adequately describe the range of conformations these chains likely adopt in solution. For example, the crystal structure of K63-Ub4 is in striking disagreement with the small-angle X-ray scattering data, and an ensemble of at least three conformers is required to adequately reproduce the experimental data.27 As another example, closed forms of K48-Ub2 and K48-Ub4 found in crystals28,29, sequester the hydrophobic surface patch of Ub units, rendering these polyUb chains essentially binding-incompetent30; dynamic equilibrium with open conformers is required for ligand binding.31,32 Characterization of the structures and dynamics of each of these chains is therefore essential to understanding their underlying biological function.
Figure 1.
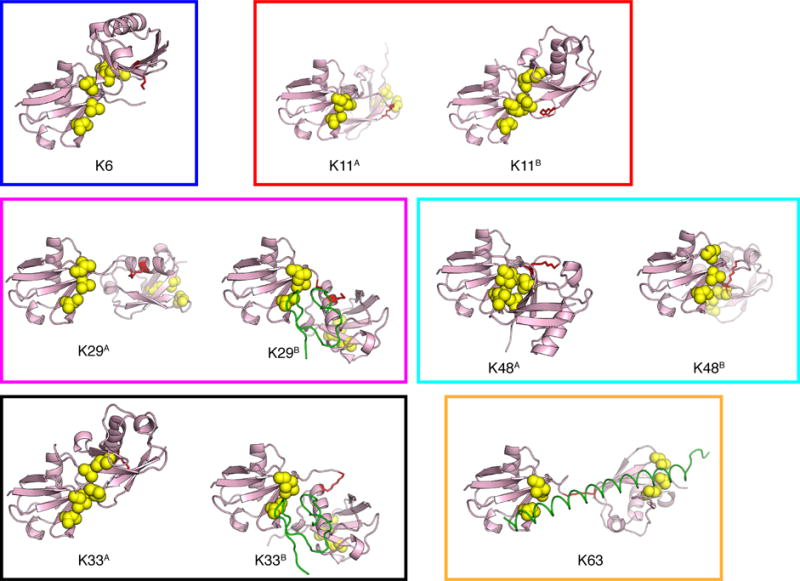
Crystal structures of Ub2 chains of various lysine linkages. PDB codes are 2XK5 (K6), 2XEW (K11A), 3NOB (K11B), 4S22 (K29A), 4S1Z (K29B), 5AF4 & 4XYZ (K33A), 5AF6 (K33B), 1AAR (K48A), 3NS8 (K48B), and 3A1Q (K63), see also Fig. S7. Each Ub is shown in ribbon representation, residues of the canonical hydrophobic patch (L8, I44, V70) are shown as yellow spheres, while the isopeptide-linked lysines are shown as red sticks. To distinguish between the two Ub units in Ub2, the one that contributes the lysine side chain to the isopeptide linkage is termed ‘proximal’, while Ub whose C-terminus participates in the linkage is termed ‘distal’. All structures are oriented here to have the distal Ub on the left and in the same orientation.
Recent advances in experimental and computational techniques are addressing how to construct biologically-meaningful conformational ensembles of multidomain proteins.33–37 Increasingly, these methods combine experimental data from various biophysical techniques such as small-angle scattering (SAS) and NMR (residual dipolar couplings and paramagnetic effects), together with powerful computational algorithms to generate macromolecular ensembles that recapitulate experimental measurements. In this work, we focused on diUb as it is the shortest Ub chain and is the basic linkage-dependent element in any longer polyUb chain. We measured residual dipolar couplings to determine long-range structural and orientational restraints for various diUb chains in solution. Using in silico ensemble generation (SASSIE38), we used sparse ensemble selection34 to construct population-weighted conformational ensembles that are in excellent agreement with RDC data. We then use small-angle neutron scattering (SANS) measurements to validate the conformational ensembles determined for each polyUb chain. Combining these results with NMR spectral perturbations and relaxation data, we find that each polyUb chain adopts unique conformations in solution with noted overlap among the chains.
Experimental
NMR Experiments
All NMR experiments were performed at 23°C on Avance III 600 MHz spectrometer (Bruker Biospin) equipped with a cryoprobe. Proteins were prepared at 125 μM – 200 μM concentration in 20 mmol/L (mM) sodium phosphate buffer (pH 6.8) containing 0.02% NaN3 and 5% D2O, unless indicated otherwise. Ub2 constructs used in NMR studies had a single Ub unit (either distal or proximal) enriched with 15N.
15N Relaxation Measurements
Longitudinal (R1) and transverse (R2) 15N relaxation rates, and {1H}-15N steady-state heteronuclear Overhauser enhancement (hnNOE) were measured and analyzed as described previously.4,39 For each residue, the ratio of relaxation rates, ρ, was determined using: ρ = (2R2′/R1′ – 1) −1, where R1′ and R2′ are modified R1 and R2 rates with the high-frequency component subtracted40,41.
Using only residues in secondary structure elements, the diffusion tensors were determined for each Ub separately using the program, ROTDIF40,41. To arrive at a Ub2 relaxation-based structure, the distal and proximal Ubs were optimally oriented and positioned using ELMDOCK42, such that the predicted ρ values for the overall Ub2 molecule were in best agreement with experimental ρ values. For ELMDOCK, a docking temperature of 308 K was used so that the Ub units did not overlap. The backbone order parameters were derived from the relaxation rates using program DYNAMICS.43
Residual Dipolar Coupling (RDC) Measurements
N-H couplings were measured in both anisotropic and isotropic media. For the anisotropic media, protein solutions consisted of 5% C12E5/hexanol in pH 6.8 20 mM sodium phosphate buffer containing 7% D2O. The degree of alignment was determined from the 2H splitting of the HDO signal. For K6-, K27-, K29-, and K33-Ub2, 2H splitting ranged between 28.5 and 30.4 Hz, for K63-Ub2 the range was 23.8 to 25.4 Hz. In prior K11- and K48-Ub2 measurements, 2H HDO splitting ranged between 24 and 26.2 Hz. Backbone amide 15N-1H dipolar couplings were measured using pseudo-3D IPAP-HSQC experiments with at least 256 complex t1 increments with 15N and 1H spectral widths of 2100 Hz and 8000 Hz, respectively. For each spectrum, only those peaks with well-defined contours were used for further analysis. Peak centers were determined using either Sparky’s44,45 peak-picking algorithm or in some cases, using an in-house contour-fitting program31. For alignment tensor determination, only residues in structured parts of the protein were considered, yielding on average 40 residues per Ub unit (Figure S2). Alignment tensors for each Ub unit were calculated via singular value decomposition (SVD) using program ALTENS.31 To arrive at a Ub2 RDC-based structure, the distal and proximal Ubs were optimally oriented and positioned using PATIDOCK46, assuming either 3 or 4% bicelle concentration, so that the Ub units did not overlap.
SASSIE Generation of Structural Ensembles
We employed SASSIE38 to generate structural ensembles for K6, K11, K27, K29, K33, K48, and K63-linked Ub2. For each Ub2, initial PSF and PDB structure files were constructed using the structures from ref.47 as templates. The initial structures were energy minimized and used as input for SASSIE. Using the monomer configuration generator module of SASSIE, 30,000 trial structures were generated for each Ub2. Monte Carlo moves about the ϕ/ψ backbone torsion angles were permitted only for residues 72–76 of the distal Ub (i.e., these residues were deemed flexible), and each move was restricted to a maximum dθ of 30–40°. A trial structure was rejected if any Cα-atom was within 3 Å of another (applicable to linker and overlap of Ub units). On average, between 70–77% of trial structures were accepted, yielding ~24,000 sterically-allowed structures. These structures were not energy minimized. To remove potential bias in NH-bond vector orientations originating from the input Ub structures used to generate the SASSIE ensembles, the solution structure of monomeric Ub (PDB ID 1D3Z) was superimposed with each Ub unit in each of the conformers, and the resulting NH-bond vectors were used for the subsequent RDC and relaxation data analyses.
Sparse Ensemble Selection Implementation for RDC analysis of Ub2 structures
Using the structural ensembles generated above, we calculated the sparse ensemble solutions using RDCs for both distal and proximal Ub units as the only experimental restraints. We used an improved version of the SES algorithm, originally described in 34. The new version33 uses a conjugate gradient least-squares algorithm48 to efficiently solve linear least-squares problems while using an order of magnitude less memory than the previous approach. It also includes upper bounds on the total sum of the population weights of the conformers (Σ wi = 1, see Eq.(3)) enforced using active-set constraints.48
The predicted RDCs for each member of the generated structural ensemble were obtained using PATI46 assuming 5% bicelle medium. The RDC error was assumed to be 1.0 Hz for all residues. The agreement between experiment and prediction was quantified as the relative error calculated as ||r||/||y||, where ||r|| represents the Euclidean norm of the residuals between experimental RDCs and those RDCs calculated from the population-weighted structural ensemble, and ||y|| represents the Euclidean norm of the experimental RDCs. For analysis purposes, all ensemble solutions whose relative error was within 5% of the relative error of the best solution were selected. In other words, if the best solution had a relative error of 0.10, all solutions with relative error up to 0.105 were analyzed.
SANS Data Collection and Analysis
Samples of each Ub2 (3–5 mg/mL to approximate NMR concentrations) in pD 6.8 20 mM sodium phosphate D2O buffer containing either 0 mM NaCl or 150 mM NaCl were collected as previously described.4 Data were reduced using the IGOR program with routines developed at the NCNR.49 A sample-to-detector distance of 1.5 m was used to cover the range 0.03 Å−1 ≤ q ≤ 0.4 Å−1, where q = 4π sin(θ)/λ, for scattering angle 2θ and neutron wavelength λ.
Initial data analysis was performed using the Guinier approximation,
| (1) |
to obtain values for the radius of gyration, (Rg), and the forward scattering intensity, I(0), of each sample. Proteins were determined to be monodisperse at the concentrations used. I(q) profiles were calculated for either crystal structures or structures from the SES conformational ensembles by using the Xtal2SAS module within SASSIE38, assuming 100% deuterated solvent and protonated protein with no hydration layer. For N-conformer ensembles, the SANS profiles were population weighted according to:
| (2) |
where I(q)i is the predicted SANS profile for conformer i from the ensemble and wi is its population weight determined by SES.
Results & Discussion
We assembled Ub2s of all possible lysine linkages. K6, K27, K29, and K33-linked chains that are free of any mutations were made using the nonenzymatic assembly approach.20 Ub2s containing K11, K48, and K63 linkages were made enzymatically employing chain-terminating mutations.4,31,50 We applied NMR spectroscopy to attain atomic-level resolution into structural and dynamical properties of each Ub2 in solution.
Most diubiquitin chains do not exhibit noncovalent Ub/Ub interactions
We employed NMR frequencies of 1H and 15N nuclei to monitor changes to the N-H group’s microenvironment upon formation of Ub2. By comparing 1H-15N NMR spectra of Ub2’s individual Ub units with monoUb, we quantitated differences in chemical shifts (CSPs) for each amide resonance (Figure 2A). For all Ub2s, the largest CSPs were observed for C-terminal residues 74–76 of the distal Ub, as expected since the C terminus of the distal Ub is covalently linked to a lysine of the proximal Ub.
Figure 2.
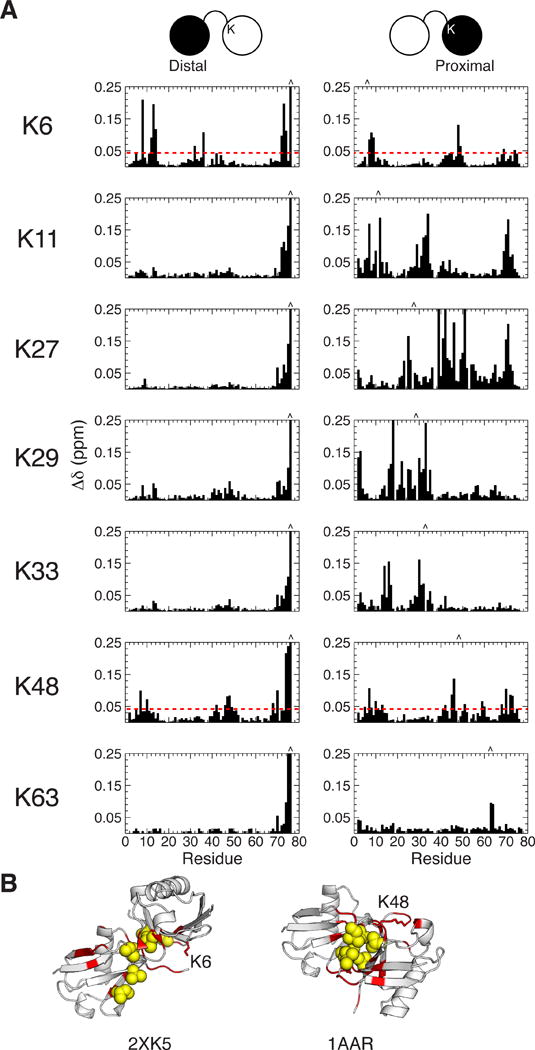
NMR characterization of all lysine-linked diubiquitins. (A) Chemical shift perturbations (CSPs) of Ub2s composed of every lysine linkage, at pH 6.8 in the absence of NaCl. CSPs were quantified as Δδ = [(ΔδH)2 + (ΔδN/5)2]1/2, where ΔδH and ΔδN are the differences in 1H and 15N chemical shifts for the same residue between Ub2 and monoUb. CSPs for K6-, K29-, and K33-Ub2s are in agreement with those recently published in 5,24–26. Left panels show data for the distal Ub, right panels for the proximal Ub. The linkage lysine is indicated on the left. The location of the linkage lysine in the proximal Ub and the C-terminal G76 in the distal Ub are marked by carets. (B) CSPs > 0.04 ppm for K6-Ub2 and K48-Ub2 were mapped onto the crystal structures of K6-Ub2 (PDB ID 2XK5) and K48-Ub2 (PDB ID 1AAR).
From Figure 2A it is apparent that only K6- and K48-Ub2s exhibit significant CSPs in both Ub units. As determined previously5,31, these CSPs map onto the Ub/Ub interface for each Ub2 (Figure 2B). The CSPs for both Ubs of K48-Ub2 (and the proximal Ub of K6-Ub2) center on residues L8, I44, and V70, which comprise the canonical hydrophobic patch of Ub, known to interact with Ub-binding partners.2 By contrast, the CSPs in the distal Ub of K6-Ub2 cluster around residues L8, D32, I36, and L73.
For the other Ub2s (linked via K11, K27, K29, K33, or K63), the distal Ub units exhibit very small CSPs (< 0.05 ppm) that also cluster around the hydrophobic patch residues L8, I44, and V70, suggesting that the distal Ub in these chains is only in transient contact with the proximal Ub.4,51 However, for four of these linkages (K11, K27, K29, and K33) the CSPs are widespread in the proximal Ub. Our previous studies have indicated that a significant fraction of the CSPs in the proximal Ub of K11-Ub2 stems from the isopeptide bond formation at the linkage lysine.4 To examine this for other linkages we made monoUb variants, where the target lysine is replaced with Lys(Boc), an unnatural amino acid in which the ionizable amino group is replaced with a neutral chemical mimic of the isopeptide bond (Figure S1). Remarkably, the CSP patterns of the Lys(Boc) monoUb variants match the CSPs observed in the proximal Ubs of these Ub2s. In general, these CSPs are localized to the site of substitution, except for K27 where the perturbations are larger and more broadly spread. These results emphasize that caution should be exercised when interpreting CSPs in polyUb chains and other multidomain systems. Taken together, the CSP data indicate that most Ub2s (except for K6 and K48 linked) do not exhibit significant non-covalent Ub/Ub interactions.
Crystal structures of Ub2s are inconsistent with Small-Angle Neutron Scattering data
To characterize the overall size and shape of the different Ub2s in solution, we employed small-angle neutron scattering (SANS) (Figure 3). Scattering profiles, I(q), for each Ub2 were normalized such that I(0) was set to 1. The experimental scattering profiles for different Ub2s are nearly indistinguishable (Figure 3A). This is in sharp contrast to the differences across the predicted scattering profiles from the various crystal structures of these chains (Figure 3C). Radius of gyration, Rg, was determined from Guinier plot analysis; the Rg values for different Ub2s range from 18 to 20 Å (Figure 3D). For reference, the Rg values calculated from the various crystal structures range from 15.5 Å for the most compact structures (K6- and K48-Ub2) to 23 Å for the extended conformation of K63-Ub2 (Table S1). These results directly illustrate that the crystal structures alone do not adequately represent the overall shape and size of the Ub2s in solution.
Figure 3.
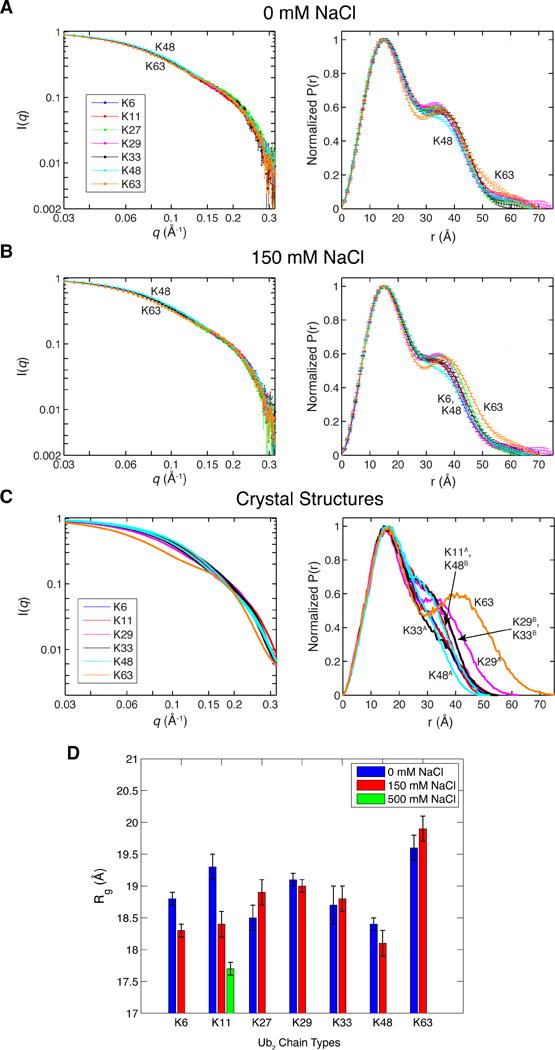
SANS data for Ub2 chains in pD 6.8 buffer with either (A) 0 mM NaCl or (B) 150 mM NaCl. Ub2s of different lysine linkages are color-coded according to the legend. I(q) profiles were normalized such that I(q=0) = 1. The error bars here and in other I(q) plots throughout this paper represent the standard errors based on counting statistics. Atom pairwise distance distribution, P(r), was calculated using GNOM.64 (C) Predicted I(q) and P(r) profiles for all crystal structures of Ub2 (using the Xtal2SAS module of SASSIE, see Experimental). Colors correspond to Ub2s of different lysine linkages (see Figure 1). For the crystal structures of a ligand-bound Ub2 the ligand was removed so that the I(q) and P(r) profiles represent the corresponding Ub2 conformations. (D) Radius of gyration (Rg) for each Ub2, determined by fitting low-q SANS data to the Guinier equation, Eq.(1). The error bars represent standard errors of the fit.
The differences between experimental SANS data and the crystal structures become more apparent when comparing the corresponding pair distributions, P(r), of atom-atom distances in Ub2. Notably, the experimental P(r) is bimodal for most Ub2s (Figures 3A, B, right), indicating pairwise distances within each Ub unit (first peak at r = 15 Å), and pairwise distances between Ub units (second peak at r ≈ 35 Å). The second peak is particularly pronounced when the two Ub units are not in close contact with each other. This is the case with K63-Ub2, which is known to adopt extended conformations, even when binding target proteins.52 K63-Ub2 has the most number of pairwise distances > 45 Å of all Ub2s. By contrast, K48-Ub2 is the most compact, as it exhibits the least number of pairwise distances > 30 Å, and its P(r) distribution does not appear bimodal. All other lysine-linked Ub2s vary in the degree of compactness between those of K48- and K63-linked chains. These observations are replicated in the presence of 150 mM NaCl (Figure 3B), which approximates physiological ionic strength. For most Ub2s, the addition of NaCl did not change their overall shape and size, as the I(q) and P(r) profiles remained unaffected (Figure S2). Only did K6-, K11-4, and K48-linked chains exhibit increased compactness (decreased Rg values) with the addition of NaCl (Figure 3D). Noteworthy, the actual Rg values at increased salt concentration begin to approach the calculated Rg values from those crystal structures that show compact Ub2 conformations (Table S1).
Most of the P(r) profiles computed from the crystal structures are not bimodal, suggesting that many of the Ub2 conformations seen in crystals are too compact compared to those in solution (compare Figure 3C with 3A). Interestingly, only the predicted SANS data from the crystal structure of the unbound conformation of K29-Ub2 appear in agreement with the experimental SANS data. The apparent bimodal distribution of P(r) profiles for many Ub2s suggests that Ub units do not form a close Ub/Ub interface for most of the time in solution. These results correlate well with the observed CSPs (Figure 2). Collectively, our data suggest that the crystal structures of Ub2 represent snapshots of the conformational space explored by the different Ub2s in solution.
Conformational heterogeneity of Ub2s revealed by RDCs and 15N relaxation data
Residual dipolar couplings (RDCs) and 15N relaxation rates (R1, R2, and {1H}-15N steady-state hnNOEs) were measured for K6-, K27-, K29-, and K33-linked Ub2s. (Data for K11-, K48-, and K63-Ub2 have been measured previously.4,31,50 Here we re-measured RDCs for K63-Ub2 using the same medium as for the other chains, in order to have comparable degree of alignment.) 15N-1H RDCs are sensitive to the orientation of the N-H bond with respect to the alignment tensor of the protein in anisotropic media, and therefore the RDCs are an important source of long-range structural information. 15N relaxation rates are complementary to RDCs as they inform on backbone dynamics, overall molecular tumbling, and the orientation of the N-H bond with respect to the rotational diffusion tensor of the protein.
The overall pattern and magnitude of RDCs for all distal Ubs are strikingly similar (Figure S2, Table S2). These data suggest that the distal Ub units all orient similarly in the alignment medium. By contrast, the RDCs for the proximal Ub units vary widely: little or no correlation is observed across all of the proximal Ubs, except between proximal-Ub RDCs for K29- and K48-Ub2 (Table S3). These results are indicative of differential Ub/Ub orientation across the different Ub2s. Furthermore, the disparity in the overall ranges of the RDC values for the distal and proximal Ubs in almost all Ub2s points to the presence of interdomain motions that average differently the RDCs for the distal and proximal Ubs.
Comparison of the 15N relaxation rates for the different Ub2s (Figure 4) revealed that the origin of Ub2’s conformational heterogeneity stems from the flexibility of the Ub-Ub linker. The untethered C-terminus of the proximal Ub exhibits near-zero or negative hnNOE values and close to zero squared order parameters S2, indicative of unrestricted backbone motions on the ns-ps timescale, similar to those in monoUb.53,54 On the other hand, residues 72–76 of the distal Ub (comprising the Ub-Ub linker) are significantly rigidified (hnNOE > 0.3) compared to the same residues in the proximal Ub. Motions of the distal Ub’s C-terminus are restricted as a consequence of the tethering to a target lysine on the proximal Ub. However, the Ub-Ub linker still possesses substantial flexibility, judging by the hnNOE and S2 values that are generally well below those for residues in the secondary structure (where hnNOE > 0.6, S2 > 0.75). In fact, the hnNOE and S2 values for the Ub-Ub linker indicate more flexibility than observed for residues 8–12 which form the flexible β1/β2 loop in Ub.55 This inherent flexibility of the Ub-Ub linker is the likely source of the conformational heterogeneity of Ub2s and longer chains.
Figure 4.
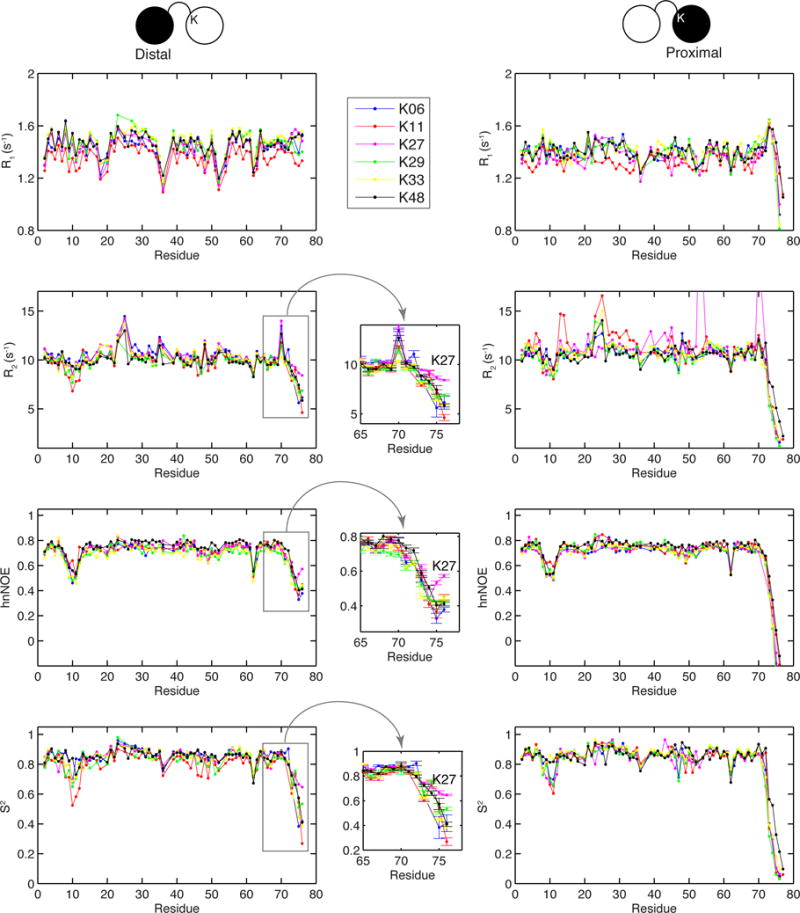
15N relaxation data (R1, R2, and heteronuclear NOE) and model-free squared order parameters (S2) for all Ub2 chains, except K63. Insets zoom on the indicated regions. The error bars represent standard errors of the corresponding parameters.
Given that Ub’s lysines reside in different microenvironments (edges of the secondary structure elements, middle of the α-helix, loops), we asked whether Ub attachment to any of these lysines on the proximal Ub affected backbone dynamics and/or structure of the individual Ub units within each Ub2. From our results (Figure 4) it is apparent that the overall ps-ns backbone dynamics are very similar across the different Ub2s; and the order parameters for each Ub unit are comparable to those of monoUb.54
Using the solution structure of monoUb (PDB ID 1D3Z) and only residues in the structured regions of Ub (Figure S4), we determined the alignment tensor (Table 1) of each Ub using a SVD approach.53,56 For every Ub unit in each Ub2, there was an excellent agreement between the RDCs measured experimentally and back-calculated from the alignment tensor, resulting in Pearson’s correlation coefficient r > 0.99 and quality factor values Q < 0.08 (Figure 5A). Quality factors57 report on the residuals between the experimental and back-calculated values, with low Q reflecting excellent agreement. Analogous to the alignment tensor analysis, rotational diffusion tensor for each Ub was determined from the ratio of relaxation rates, ρ, using program ROTDIF41 (Figure S4 and Table 1). As with the RDC data, we found strong agreement between the experimental and back-calculated ρ values obtained using the monoUb structure (Table 2). Collectively, all these results indicate that the overall structure and ps-ns backbone dynamics of Ub are unaffected by the various isopeptide linkages or by Ub’s conjugation to another Ub.
Table 1.
Alignment and diffusion tensor characteristics of diubiquitins.a
| Alignment tensor | Diffusion tensor | ||||||||||||||
|---|---|---|---|---|---|---|---|---|---|---|---|---|---|---|---|
| Linkage and Ub unit |
Sxx b | Syy b | Szz b | α c | β c | γ c | Dxx b | Dyy b | Dzz b | α c | β c | γ c | τc d | Aniso tropy e |
Rhom bicity f |
| K6-D | 12.68 (0.59) | 18.20 (0.69) | −30.88 (0.83) | 122 (2) | 150 (1) | 77 (5) | 1.64 (0.07) | 1.77 (0.06) | 2.61 (0.13) | 123 (7) | 157 (4) | 172 (19) | 8.28 (0.22) | 1.53 (0.09) | 0.22 (0.14) |
| K6-P | −14.78 (0.80) | −2.21 (0.68) | 16.99 (0.55) | 126 (2) | 108 (1) | 131 (3) | 1.82 (0.03) | 1.98 (0.03) | 2.12 (0.04) | 133 (10) | 105 (8) | 36 (7) | 8.44 (0.08) | 0.89 (0.12) | 0.86 (0.18) |
| K11-D g | 14.24 (0.54) | 16.29 (0.72) | −30.54 (0.83) | 104 (1) | 140 (1) | 66 (13) | 1.69 (0.09) | 1.80 (0.08) | 2.53 (0.13) | 109 (8) | 145 (5) | 152 (18) | 8.29 (0.24) | 1.45 (0.09) | 0.21 (0.20) |
| K11-P g | 0.71 (0.43) | 21.95 (0.58) | −22.66 (0.56) | 31 (1) | 46 (1) | 32 (2) | 1.64 (0.05) | 1.82 (0.05) | 2.35 (0.09) | 38 (4) | 44 (5) | 105 (15) | 8.61 (0.17) | 1.36 (0.06) | 0.42 (0.21) |
| K27-D | 16.48 (0.58) | 22.01 (0.82) | −38.49 (0.92) | 91 (1) | 143 (1) | 56 (7) | 1.63 (0.06) | 1.71 (0.07) | 2.69 (0.15) | 92 (5) | 146 (3) | 168 (21) | 8.27 (0.24) | 1.61 (0.10) | 0.12 (0.11) |
| K27-P | 12.06 (0.63) | 18.52 (0.75) | −30.58 (0.78) | 49 (1) | 122 (1) | 104 (5) | 1.76 (0.09) | 1.79 (0.08) | 2.30 (0.19) | 36 (6) | 116 (5) | 94 (57) | 8.55 (0.32) | 1.29 (0.11) | 0.09 (0.33) |
| K29-D | 20.62 (0.67) | 23.16 (0.97) | −43.77 (1.16) | 89 (1) | 138 (1) | 166 (20) | 1.73 (0.08) | 1.77 (0.07) | 2.82 (0.19) | 93 (5) | 141 (3) | 125 (32) | 7.93 (0.27) | 1.62 (0.12) | 0.06 (0.11) |
| K29-P | 0.74 (0.48) | 14.89 (0.59) | −15.63 (0.73) | 110 (1) | 106 (2) | 165 (2) | 1.71 (0.05) | 2.00 (0.04) | 2.28 (0.06) | 119 (4) | 108 (8) | 105 (7) | 8.35 (0.12) | 0.80 (0.22) | 0.98 (0.29) |
| K33-Dh | 17.35 (0.55) | 20.35 (0.84) | −37.70 (0.95) | 91 (1) | 141 (1) | 17 (12) | 1.73 (0.11) | 1.76 (0.12) | 2.72 (0.29) | 93 (7) | 144 (4) | 145 (47) | 8.07 (0.43) | 1.56 (0.18) | 0.04 (0.23) |
| K33-P | −16.91 (0.51) | −2.23 (0.69) | 19.14 (0.67) | 76 (1) | 63 (1) | 177 (2) | 1.78 (0.04) | 2.00 (0.04) | 2.27 (0.05) | 79 (4) | 69 (7) | 99 (11) | 8.27 (0.10) | 1.20 (0.03) | 0.85 (0.26) |
| K48-D g | 17.52 (0.78) | 19.56 (0.59) | −37.08 (0.90) | 116 (1) | 135 (1) | 117 (21) | 1.74 (0.07) | 1.87 (0.05) | 2.68 (0.11) | 112 (7) | 141 (4) | 150 (16) | 7.94 (0.18) | 1.49 (0.07) | 0.21 (0.14) |
| K48-P g | 3.42 (0.68) | 14.04 (0.81) | −17.47 (0.83) | 112 (1) | 112 (2) | 19 (2) | 1.70 (0.05) | 2.01 (0.05) | 2.33 (0.06) | 110 (8) | 117 (7) | 132 (8) | 8.28 (0.13) | 1.26 (0.04) | 1.00 (0.26) |
| K63-D i | 10.06 (0.51) | 14.71 (0.66) | −24.77 (0.66) | 93 (2) | 138 (1) | 43 (6) | 1.72 (0.15) | 1.73 (0.14) | 2.46 (0.35) | 98 (9) | 147(5) | 88 (88) | 8.46 (0.58) | 1.43 (0.20) | 0.02 (0.47) |
| K63-P i | 17.15 (0.54) | 20.29 (0.63) | −37.44 (0.76) | 55 (2) | 150 (1) | 124 (9) | 1.49 (0.08) | 1.58 (0.09) | 2.53 (0.20) | 68 (12) | 156 (4) | 161 (26) | 8.92 (0.37) | 1.65 (0.15) | 0.14 (0.14) |
Residues used for tensor determination are shown in Figure S2. ‘D’ and ‘P’ indicate data for the distal and proximal Ub, respectively, in the corresponding Ub2 chain. Numbers in the parentheses represent standard deviations estimated using 5000 and 500 Monte Carlo trials for alignment and diffusion tensors, respectively.
Principal values of the alignment tensor (Sxx, Syy, Szz, in Hz), ordered such that |Szz| ≥ |Syy| ≥ |Sxx|, and principal values of the rotational diffusion tensor (Dxx, Dyy, Dzz, in 107 s−1), ordered as Dzz ≥ Dyy ≥ Dxx. For K6- and K33-Ub2, the x and y axes of the proximal Ub’s alignment tensor were swapped, in order to have the corresponding eigenvalues sorted in the ascending order. A similar scenario was previously encountered for the proximal Ub of K11-Ub2 in 150 mM NaCl.4
Euler angles (α, β, γ, in degrees) according to the y-convention characterize orientation of the principal axes frame of the alignment or diffusion tensor with respect to the coordinate frame of monoUb (PDB 1D3Z). The values of α,β,γ were chosen such that all values fall between 0° and 180°.
Overall rotational correlation time, , in nanoseconds.
Anisotropy of the diffusion tensor calculated as .
Rhombicity of the diffusion tensor calculated as .
h15N R1 and R2 relaxation data were corrected to account for a 5% monoUb contamination.
Diffusion tensor characteristics for K63-Ub2 are from ref.50.
Figure 5.
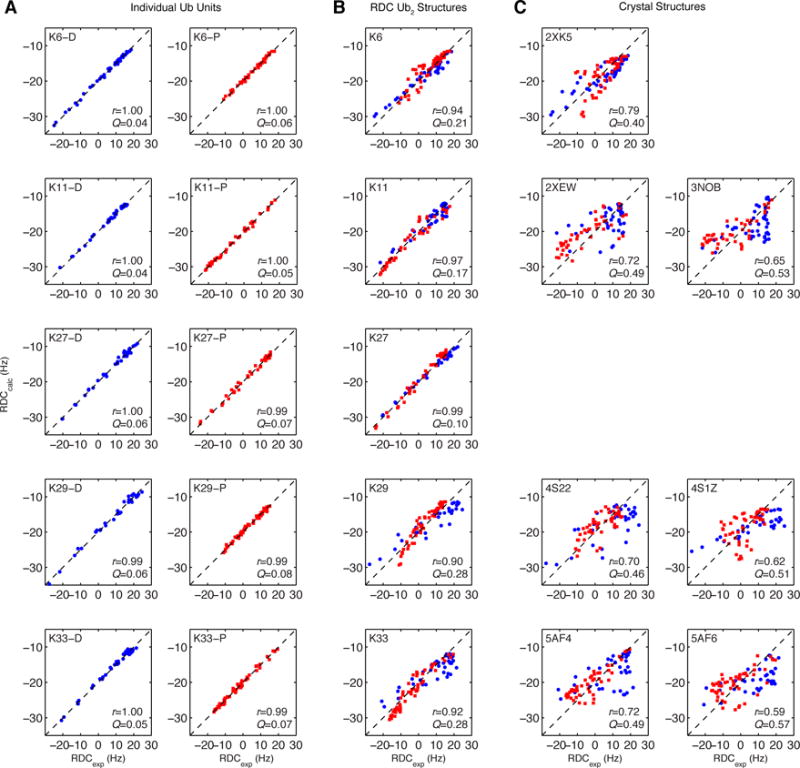
Agreement between experimental RDCs and RDCs back-calculated from the corresponding structures: (A) distal (blue) and proximal (red) Ub units in Ub2 taken separately, (B) both Ubs in Ub2, taken together, from the optimized single-structure representation determined from RDC data, (C) both Ubs in Ub2, taken together, from the indicated crystal structures (1D3Z representations, see Table 2). The dotted line represents absolute agreement. Pearson’s correlation coefficient (r) and quality factor (Q) values are shown inside each plot.
Table 2.
Agreement between Ub2 structures and NMR (RDC and 15N relaxation) data
| Ub2 | Structure Type | Data | ra | Qa |
|---|---|---|---|---|
| K6 | RDC-derived | RDC-SVD | 0.94 | 0.21 |
| K6 | 15N relaxation-derived | RDC-SVD | 0.92 | 0.25 |
| K6 | 15N relaxation-derived | 15N-relaxation | 0.79 | 0.44 |
| K6-D | monoUb 1D3Z b | 15N-relaxation | 0.94 | 0.24 |
| K6-P | monoUb 1D3Z b | 15N-relaxation | 0.91 | 0.30 |
| K6 | Crystal structure 2XK5 c | RDC-SVD | 0.79 | 0.40 |
| K11 | RDC-derived | RDC-SVD | 0.97 | 0.17 |
| K11 | Crystal structure 2XEW c | RDC-SVD | 0.72 | 0.49 |
| K11 | Crystal structure 3NOB c | RDC-SVD | 0.65 | 0.53 |
| K27 | RDC-derived | RDC-SVD | 0.99 | 0.10 |
| K27 | 15N relaxation | RDC-SVD | 0.94 | 0.22 |
| K27 | 15N relaxation | 15N relaxation | 0.91 | 0.29 |
| K29 | RDC-derived | RDC-SVD | 0.90 | 0.28 |
| K29 | Crystal structure 4S22 c | RDC-SVD | 0.70 | 0.46 |
| K29 | Crystal structure 4S1Z c | RDC-SVD | 0.62 | 0.51 |
| K29 | 15N relaxation-derived | RDC-SVD | 0.87 | 0.31 |
| K29 | 15N relaxation-derived | 15N relaxation | 0.82 | 0.41 |
| K33 | RDC-derived | RDC-SVD | 0.92 | 0.28 |
| K33 | 15N relaxation-derived | RDC-SVD | 0.92 | 0.29 |
| K33 | 15N relaxation-derived | 15N relaxation | 0.89 | 0.35 |
| K33 | Crystal structure 5AF4 c | RDC-SVD | 0.72 | 0.49 |
| K33 | Crystal structure 5AF6 c | RDC-SVD | 0.59 | 0.57 |
r are Pearson’s correlation coefficients. Quality factors (Q) were calculated for RDCs and 15N relaxation data as defined in 57 and 63, respectively.
The agreement with 15N relaxation data of each Ub unit treated separately is included for comparison.
To remove any potential bias in NH-bond vector orientations originating from the crystal structures, the solution structure of monomeric Ub (PDB ID 1D3Z) was superimposed with each Ub unit in each of the crystal structures, and the resulting bond vector orientations were used to compute the RDC values from the alignment tensor.
Single-structure representations are inadequate for diubiquitins
Using 15N relaxation and RDC data, we determined single-structure representations of each non-canonical polyUb chain. We employed PATIDOCK or ELMDOCK40,42,46, algorithms that find the Ub/Ub orientation that is in best agreement with RDC or 15N relaxation data, respectively (Figure 5, 6). It is clear from these single-structure representations that the different lysine-linked Ub2s exhibit different Ub/Ub orientations. At first glance, K6- and K27-Ub2s are the only ones where the hydrophobic patches of the two Ubs face each other, similar to K48-Ub2. The other Ub2s show different arrangements of the hydrophobic patches. Remarkably, many RDC-derived structures are similar to those obtained from the 15N relaxation data, indicating that RDC and 15N-relaxation data are consistent with each other, even though these characteristics reflect different physical properties (alignment vs. tumbling) and are sensitive to motions on different timescales: ps – ms for RDCs, and ps-ns for 15N relaxation. This suggests that the averaging of RDCs by interdomain motions by and large occurs on a time scale faster than or comparable with the overall tumbling of Ub2.32
Figure 6.
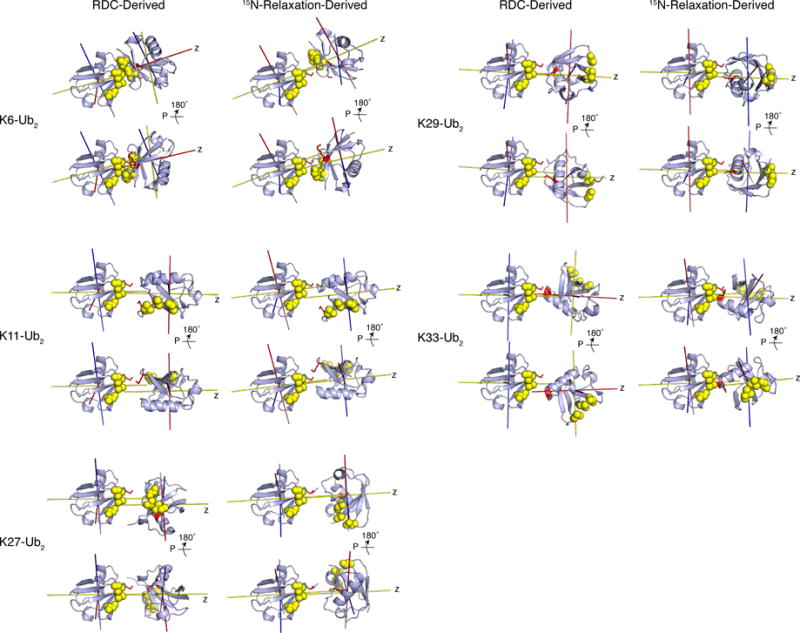
Single structure representations of non-canonical polyUb chains determined from RDC or 15N-relaxation NMR data. Due to orientational degeneracy of the data, two structures are shown for each Ub2, differing by a 180° rotation of the proximal Ub about the z axis of the corresponding tensor. The structure rendering is the same as in Figure 1. Principal axes of the alignment and diffusion tensors (from RDC and 15N relaxation data, respectively) are shown as sticks.
Comparison of the experimental RDCs with the RDCs back-calculated from the RDC-derived structures of K6-, K29-, and K33-Ub2 showed general agreement (r > 0.87) albeit with high values of the quality factor (Q > 0.23) (Table 2 and Figure 5). (K27-Ub2 is a notable exception and will be discussed in a later section.) These Q values are at least a factor of 2.5 higher than for individual Ub units, suggesting that a single-structure representation is not sufficient to explain the RDC data. As mentioned in the previous section, the range of RDC values for the proximal Ub is quite different from that for the distal Ub (Fig S3). This is best seen for K29-Ub2, where the proximal-Ub RDCs are between -15 and +15 Hz, whereas the distal-Ub RDCs are twice that range. A similar pattern has been observed in RDCs for K48-Ub2 at various pH conditions (Figure S3 and ref. 34), and was shown to reflect the chain’s dynamic equilibrium involving multiple conformations. 34
Furthermore, there is a disparity in the alignment tensor characteristics: the tensors “reported” by the distal Ub in K11-, K29-, and K33-Ub2 are axially symmetric (|Sxx| ≈ |Syy|), while the proximal-Ub tensors are highly rhombic (|Sxx| ≈ 0; |Syy| ≈ |Szz|). These observations extend to the diffusion tensors as well: most distal-Ub tensors are axially symmetric (Dxx ≈ Dyy), while the proximal-Ub tensors are anisotropic (Table 1). The significant differences in the alignment tensors and diffusion tensors between the distal and proximal Ubs imply the existence of interdomain mobility on both the RDC and 15N relaxation-relevant timescales. These observations suggest significant interdomain dynamics and further strengthen the need to consider multiple conformers to describe the conformational ensembles of each of these polyUb chain types.
To test whether the crystal structures of Ub2 are adequate representations of Ub2 in solution, we compared our experimental RDC data with the data back-calculated from the crystal structures. As shown in Figure 5C, the agreement is generally poor for all structures considered here. The K6-Ub2 crystal structure comes closest, with a r = 0.79, however the Q = 0.4 is substantially higher than for those structures determined directly from RDCs (Table 2). Together with the SANS data discussed above, these results indicate that the Ub2 conformations captured in crystals are insufficient to represent the conformations occurring in solution.
Diubiquitin’s Conformational Ensembles uncovered using Sparse Ensemble Selection
Previously, we successfully applied a new approach, the sparse ensemble selection (SES) method, to determine representative conformational ensembles for K48-Ub2 as a function of pH 34. Recently, the SES was employed to quantify and compare the informational content of diamagnetic and paramagnetic RDCs and pseudo-contact shifts.33 The SES takes advantage of the fact that experimental RDCs can be expressed as a weighted linear combination of individual RDCs from multiple conformers:
| (3) |
where di are predicted RDCs for conformer i and wi is its population weight (Σ wi = 1). RDCs caused by steric alignment (as used here) can be predicted for protein structures using PATI.46
For each Ub2, an ensemble of sterically-allowed structures (~24,000) was generated using SASSIE.37 Each of these ensembles explored substantial conformational space. We tested whether Ub2 conformations from crystal structures were represented within these ensembles; in all cases (except for one), a conformer was found to correspond to the crystal structure, i.e. Cα RMSD < 3 Å (Table S4). The SES algorithm then employs sparsity regularization to determine protein ensemble solutions with the lowest residuals (χ2), or relative error (see Experimental). This algorithm was applied here to determine conformational ensembles for all non-canonical chains: K6-, K11-, K27-, K29-, and K33-Ub2.
Using the l-curve analysis34 (Figure 7A), we determined the optimal number of conformers that produces the best agreement with experimental data. For all Ub2s, there is notable improvement in the agreement between experimental and predicted RDCs when a 2-conformer or 3-conformer ensemble is considered over a single conformer. Both correlation coefficients and Q values improve considerably as the number of conformers increases, and begin to approach the respective values for individual Ub units (Figure 7B). The conformational ensembles derived from the RDC data were then tested against SANS data. Using the population weights and conformers from the SES analysis, we predicted SANS curves for each of the ensembles and compared our results with experiment (see below). We then asked how the derived conformers compare with the existing structural information and whether these ensembles provide insights into biological function.
Figure 7.
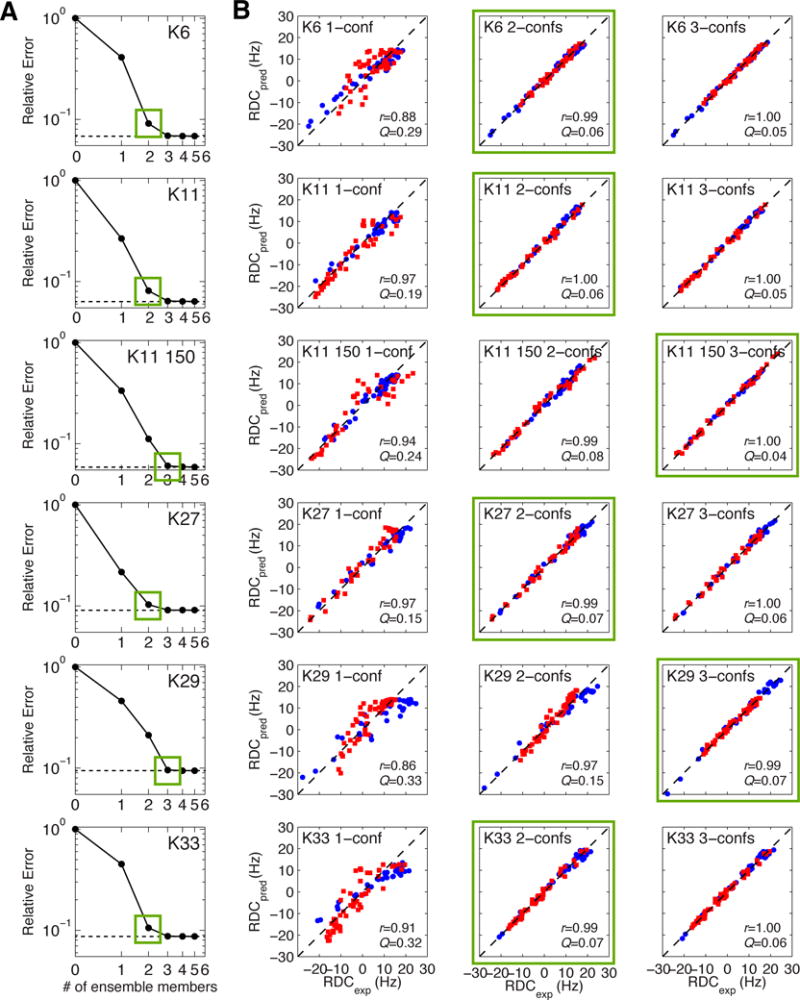
(A) l-curve analysis to determine the optimal number of conformers (indicated by green squares) for protein ensemble solutions. The dashed line represents the relative error for the best possible ensemble solution of size > 0. (B) Agreement between experimental RDCs for both Ubs taken together vs. RDCs predicted from 1-conformer, 2-conformer, and 3-conformer ensembles. Data for the distal and proximal Ubs are colored blue and red, respectively. Pearson’s correlation coefficient (r) and quality factor (Q) values are indicated inside each plot. Similar analysis for K63-Ub2 is shown in Figure S7.
a) Conformational ensembles of K6- and K11-linked diubuquitins include conformers with defined Ub/Ub interfaces
Significant CSPs in both Ubs of K6-Ub2 map onto a Ub/Ub interface in the crystal structure in Figure 2B. While the single-structure representations for K6-Ub2 derived from the RDC and 15N relaxation data are also similar to the crystal structure, the correlation coefficients, quality factors (Figure 5), and SANS data (Figure 2) all indicate that neither this single conformation nor the crystal structure alone are sufficient to recapitulate the solution data (high Q values). The results of the SES analysis suggest that already a two-conformer ensemble reproduces experimental RDC data extremely well (Q = 0.06) (Figure 7). For K6-Ub2, the results for 2- and 3-conformer ensembles are essentially indistinguishable in terms of correlation coefficients and Q values. Two sets of 2-conformer ensembles are in excellent agreement with experimental RDCs (Figure 8A). Remarkably, the major conformer (60% population weight) of the second (blue) ensemble is compact and strikingly similar to the crystal structure of K6-Ub2 (Figure 8C). The canonical hydrophobic patch of the proximal Ub and the so-called Ile-36 patch of the distal Ub5 form the Ub/Ub interface. Importantly, our analysis revealed that this compact Ub2 conformer is in equilibrium with an extended one; this scenario is analogous to the dynamic equilibrium observed for K48-Ub2.31,32,34 Interestingly, the extended conformer of K6-Ub2 appears capable of adopting a sandwich-like ligand-binding mode similar to that of K48-Ub2 (see Figure 13A). Furthermore, this extended conformer is the major conformer for the first (red) ensemble in Figure 8A, while the less populated conformer is more compact, but different in the Ub/Ub orientation from the crystal structure. It is noteworthy that this second conformer resembles the ligand-bound structure of K63-Ub2 (compare with Figures 1 and 13B). Both ensembles of K6-Ub2 are in reasonable agreement with the SANS data (Figure 8D), with the first (red) ensemble showing better agreement than the second (blue). These structural ensembles reflect the flexibility of K6-Ub2 and highlight the ability of the chain to adopt multiple Ub/Ub orientations that are competent to bind different ligands.
Figure 8.
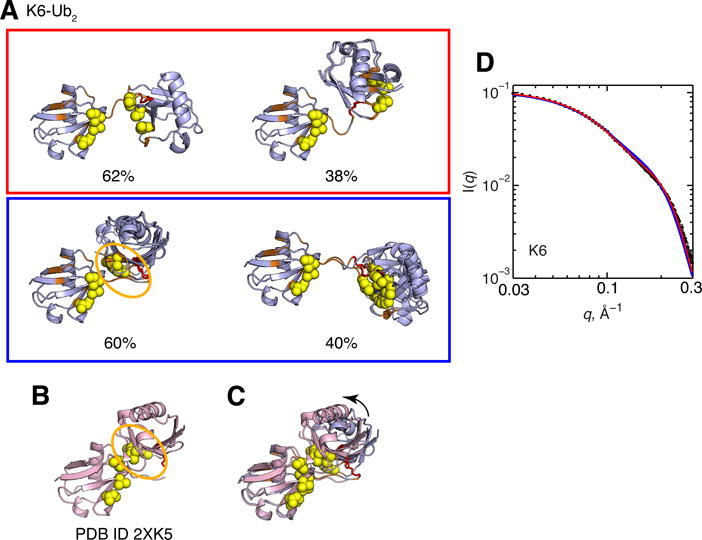
(A) Two-conformer ensembles of K6-Ub2. Structure rendering throughout this figure is as described in Figure 1, the side chain of K6 that forms the isopeptide linkage is shown in stick representation and colored red. For each conformer, residues with CSPs > 0.04 ppm are colored orange. Numbers below the structures indicate population weights of each conformer. For this and all other Ub2s, the population weights have a maximum standard deviation of 2%. (B) Crystal structure of K6-Ub2 (PDB ID 2XK5). (C) Overlay of the crystal structure of K6-Ub2 (pink) and the blue ensemble’s conformer of the highest population weight from panel A (light blue). The arrow represents orientational difference for the proximal Ub between the light blue and pink structures. (D) Agreement between experimental (black circles) and predicted SANS I(q) profiles from the conformational ensembles shown in panel A. The I(q) curve for each ensemble is color-coded according to panel A.
From prior studies on K11-Ub2, it is likely that not only does this Ub2 adopt multiple conformations in solution, but its conformational ensemble is likely responsive to changes in salt concentration.4 While there are two distinct crystal structures of K11-Ub2, we previously showed that neither structure independently is consistent with solution NMR and SANS data.4 Only by combining these crystal structures with a third, solution-averaged conformation we were able to reproduce the experimental RDC data. Furthermore, we previously observed a salt-dependent effect, namely, an increase in both Ub/Ub interactions (Figure 9F) and the overall compaction of the K11-Ub2 with increasing NaCl concentration.4 For these reasons, we applied SES to determine the conformational ensembles of K11-Ub2 at two different salt concentrations: 0 mM NaCl and 150 mM NaCl.
Figure 9.
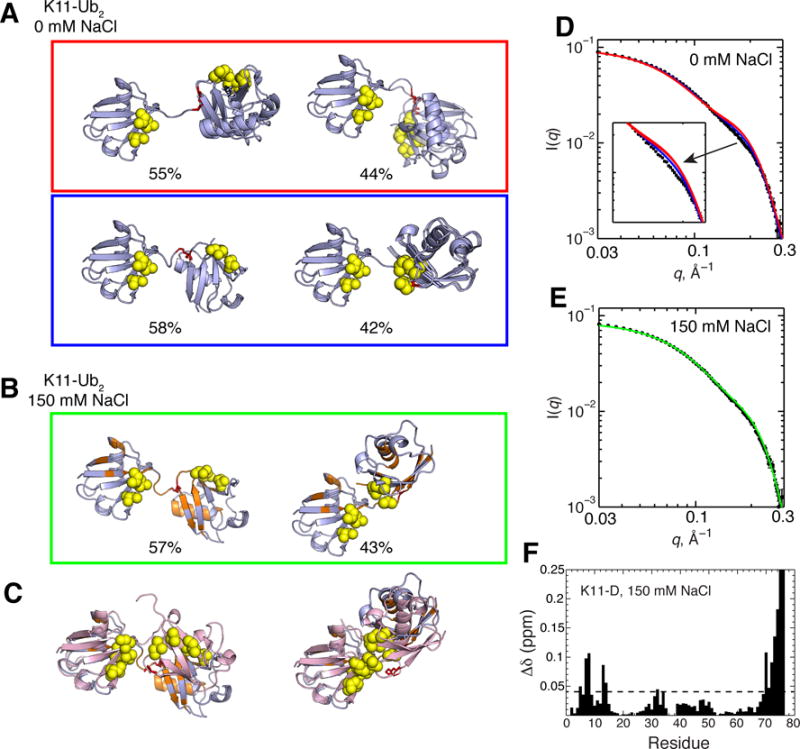
(A, B) Two-conformer ensembles for K11-Ub2 in the absence of NaCl (A), and in the presence of 150 mM NaCl (B). Structure rendering throughout this figure is as described in Figure 1, with red sticks representing isopeptide-linked K11. Residues with CSPs > 0.04 ppm (see panel F) in the presence of 150 mM NaCl are colored orange and mapped onto the conformers in panel B. Numbers below the structures indicate population weights of each conformer. In panel (C), the conformers (light blue) from (B) are superimposed with the solution structure of K11-Ub2 determined in the absence of NaCl (left, PDB ID 2MBO), and a crystal structure of K11-Ub2 (right, PDB ID 3NOB), both in pink. (D, E) Agreement between experimental (black circles) and predicted SANS I(q) profiles in the absence of NaCl (D) and in the presence of 150 mM NaCl (E). (F) CSPs in the distal Ub of K11-Ub2 vs. monoUb in 150 mM NaCl. Residues with CSPs above the dashed line are mapped onto structures in panels B and C. Data are from ref.4.
In the absence of salt, two sets of 2-conformer ensembles adequately recapitulate experimental RDC data for K11-Ub2 (Figure 7, 9). Interestingly, all conformers show extended Ub-Ub linkers, with the two Ubs sufficiently apart such that their hydrophobic patches do not interact. This observation is entirely consistent with the absence of CSPs in the distal Ub under these conditions (Figure 2A). The major conformer of these ensembles is consistent with the averaged solution structure that we described previously.4 Importantly, the two sets of ensembles are related by nearly a 180° rotation of the proximal Ub about the horizontal axis. This is likely a consequence of the degeneracy inherent in RDCs, i.e. the inability to distinguish the directionality of the alignment tensor (z vs. –z, etc.).53,58 However, the two ensembles are distinguishable by SANS data: the second (blue) ensemble is in better agreement with experiment.
In the presence of 150 mM NaCl, a 2-conformer ensemble substantially improves the agreement with experimental data (r = 0.99, Q = 0.08), while a 3-conformer ensemble improves even more so (r = 1.00, Q = 0.04) over a single-conformer solution (Figure 7). With these observations in mind, we present both 2-conformer ensemble (Figure 9) and 3-conformer ensemble solutions (Figure S5). Interestingly, the 2-conformer ensemble solution is in excellent agreement with experimental SANS data (Figure 9E). Remarkably, the second conformer (43% population weight) is very similar to one of the crystal structures (PDB ID 3NOB, Figure 9C). In fact, the CSPs in the presence of 150 mM NaCl map to this Ub/Ub interface (Figure 9F). The 2-conformer ensembles in the absence and presence of NaCl indeed support the experimental observations that increased Ub/Ub interactions and compaction occurs with the addition of salt. Notably, the compact conformer of K11-Ub2 is similar to the compact conformer for K6-Ub2, suggestive of overlap between conformational ensembles of different Ub2 linkages (compare Figure 9 with Figure 8).
A number of 3-conformer ensembles for K11-Ub2 are in good agreement with experimental SANS data (Figure S5). An important feature is that at least one of the conformers in each ensemble is compact. Secondly, the conformer with the highest population weight has a Ub/Ub orientation that generally resembles that of the crystal structure 3NOB, discussed above. The flexibility of K11-Ub2 chains is apparent with the different 3-conformer ensembles. To summarize, the results of our ensemble analysis are entirely consistent with the available experimental solution data for this chain. It is clear that the increase of NaCl modulates the conformational ensemble of K11-Ub2 toward more compact conformations and increased Ub/Ub interactions, in accord with NMR and SANS data.
b) K27-linked diubiquitin is unique among other non-canonical diubiquitins
K27-Ub2 remains the only polyUb chain type for which there is currently no structural information. K27-Ub2 is the only non-canonical Ub chain where a single structure representation already can recapitulate experimental RDC data (Figure 5). Strong correlation (r = 0.99) and low quality factors (Q = 0.10) indicate good agreement between experimental RDCs and those back-calculated from the single RDC-derived structure (Figure 5). This agreement stems from the similar alignment tensor characteristics for both the distal and proximal Ub units of K27-Ub2 (Table 1). From SES analysis (Figure 7A), RDCs predicted from a single-conformer representation already match well the experimental data (r = 0.97, Q = 0.15). However, consideration of a two-conformer ensemble further improves the agreement with experimental data (r = 0.99, Q = 0.07). Adding a third conformer gives only marginal improvement (r = 1.00, Q = 0.06, Figure 7B). Interestingly, the major conformers of the 2-conformer SES ensembles of K27-Ub2 are related by a 180° rotation about the z-axis of the alignment tensor, particularly between the red and blue ensembles shown in Figure 10A. Similarly, the minor conformers of these two ensembles are related by a 180° rotation about the vertical axis. Both cases are a consequence of the degeneracy inherent in RDCs (see above). All 2-conformer ensembles are in good agreement with experimental SANS data. Of note, the major conformer of K27-Ub2 resembles the UBA2-bound conformation of K48-Ub2 (Figure 10C).
Figure 10.
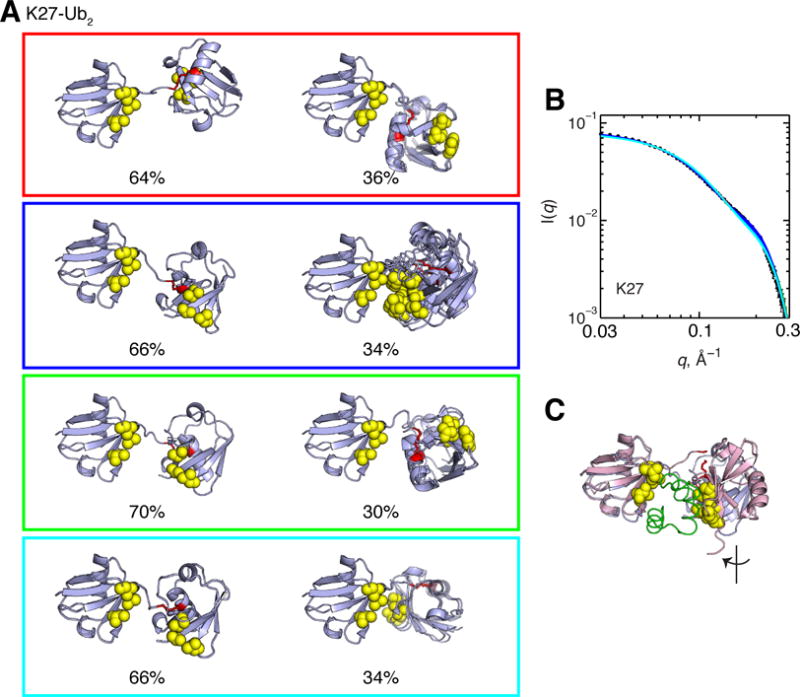
(A) Two-conformer ensembles for K27-Ub2. Numbers below the structures indicate the population weight of each conformer in the ensemble. Structure rendering throughout this figure is as described in Figure 1, and the isopeptide-linked K27 is shown in red sticks. (B) Agreement between experimental (black circles) and predicted SANS I(q) profiles from the conformational ensembles shown in panel A. Experimental data shown are in the presence of 150 mM NaCl. The I(q) curve for each ensemble is color-coded according to panel A. In panel (C), the major conformer (light blue) from the green ensemble in panel A is superimposed with the solution structure of K48-Ub2 bound to UBA2.65
We find it striking that, despite the absence of significant CSPs in the distal Ub, hence the lack of defined Ub/Ub contacts in K27-Ub2, the major conformer for K27-Ub2 is similar across the different ensembles, and the population weight for this conformer is surprisingly high (between 64% and 70%). The latter numbers are generally higher than for all non-canonical Ub2s and comparable to the population weight of the closed state of K48-Ub2 at pH 7.6.34 Note that no Ub/Ub contacts are present in this major conformer (Figure 10), which is consistent with the absence of CSPs in the distal Ub. A possible explanation for this apparent paradox is that interdomain motions in K27-Ub2 are more restricted than in the other chains. Indeed, our 15N relaxation data indicate that the Ub-Ub linker through K27 is the most rigid of all Ub2s, with hnNOE and order parameters approaching those found in secondary structure elements (Figure 4); this will restrict the interdomain motions in K27-Ub2. A close inspection of Ub’s structure shows that of all the lysines K27 is the most structurally-ordered and least solvent accessible. Restricted interdomain mobility in K27-Ub2 explains the observation that, in contrast to other Ub2s, both the distal and proximal Ub units of K27-Ub2 report remarkably similar characteristics of the alignment tensor (Table 1). Note also that, unlike other chains shown in Table 1, except for K63-Ub2, the diffusion tensors reported by both Ubs of K27-Ub2 are strongly axially symmetric. This suggests that the interdomain motions that average the apparent diffusion tensor (as well as the alignment tensor) primarily involve reorientations about the z axis of the diffusion tensor (which is also consistent with the absence of Ub/Ub interactions).
c) Conformational ensembles of K29-linked diubiquitin are highly heterogeneous
Of all Ub2s analyzed, the conformational ensembles for K29-Ub2 are most heterogeneous. Qualitatively, structural heterogeneity of K29-Ub2 is apparent from the disparity in the overall ranges of RDCs between the distal and proximal Ubs; the proximal Ub RDC range is half of the distal Ub’s range (Figure S3). This is reminiscent of the RDC data for K48-Ub2.34 For K29-Ub2, ensembles of at least three conformers are necessary to achieve the best agreement between the experimental and predicted RDCs (Figure 7A). After clustering these ensembles, at least eight of them are consistent with the SANS data (Figures 11 and S6). For brevity, we highlight a few of these ensembles here and show the others in Supplementary Information (or ESI) for completeness.
Figure 11.
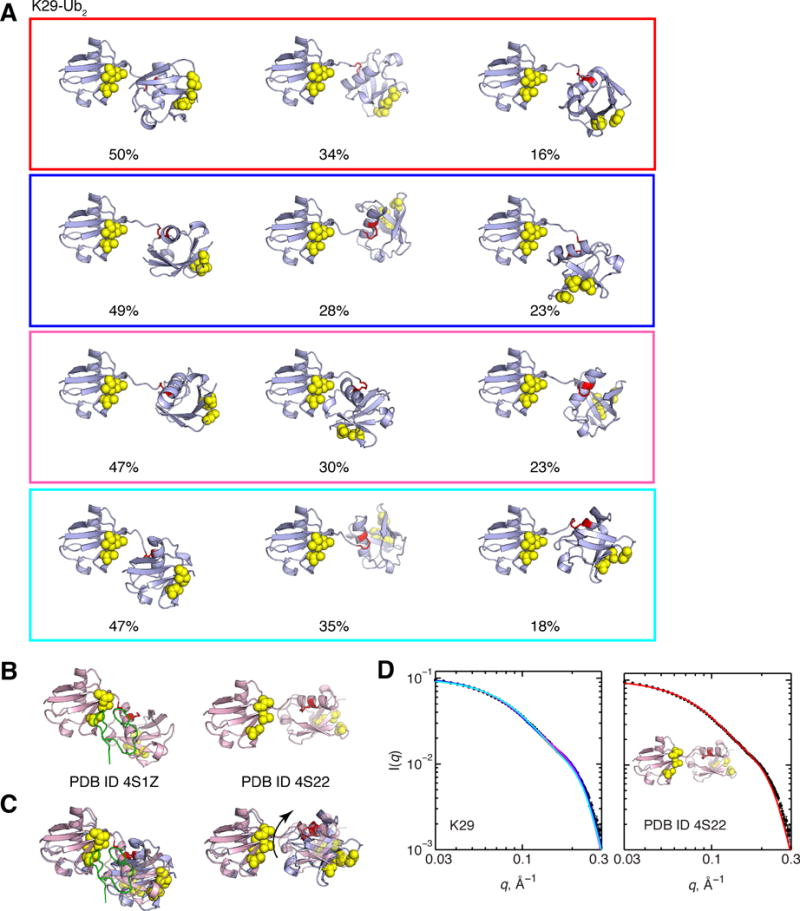
(A) Three-conformer ensembles for K29-Ub2 (continued in ESI). Numbers below the structures indicate the population weight of each conformer in the ensemble. Structure rendering throughout this figure is as described in Figure 1, the isopeptide-linked K29 is shown in red sticks. (B) Crystal structures of K29-Ub2, unbound (right) and in complex with TRABID NZF1 (left, NZF1 is shown as green ribbon) (C) Overlay of the crystal structures (pink) from B with the major conformer of the cyan ensemble (left), and with the minor conformer of the cyan ensemble (right). The arrow shows the rotation of the proximal Ub that superimposes it with the crystal structure. (D) Agreement between experimental (black circles) and predicted SANS profiles for the 3-conformer ensembles (left, lines color coded as in panel A) and for the crystal structure PDB 4S22 (right).
Despite the heterogeneity across these different K29-Ub2 ensembles, two common features are apparent. First, none of the conformers exhibits Ub/Ub interfaces where the hydrophobic patches of both Ub units interact with each other. This agrees with the previous computational modeling that showed that the isopeptide linkage at K29 sterically hinders this possibility.47 With this in mind, it is noteworthy that K29-Ub2 does exhibit some CSPs centered at the hydrophobic patch residues (L8, I44, V70) in the distal Ub unit (Figure 2), but none are evident in the proximal Ub (Figure S1). Second, the most populated conformers across all K29-Ub2 ensembles are related to each other, as well as to the RDC-derived and relaxation-derived structures for K29-Ub2, and the K29-Ub2 structure modeled in47, all by rotations about the Ub-Ub linker. Notably, some of these conformers resemble the structures of K29-Ub2 found in crystals (Figure 11B, 11C). Remarkably, the crystal structure of unbound K29-Ub2 (PDB ID 4S22) is in good agreement with the SANS data (Figure 11D), although it agrees poorly with the RDC data (Figure 5C). This is the only crystal structure of a Ub2 that is in good agreement with experimental SANS data.
d) Conformational ensembles of K33-linked diubiquitin
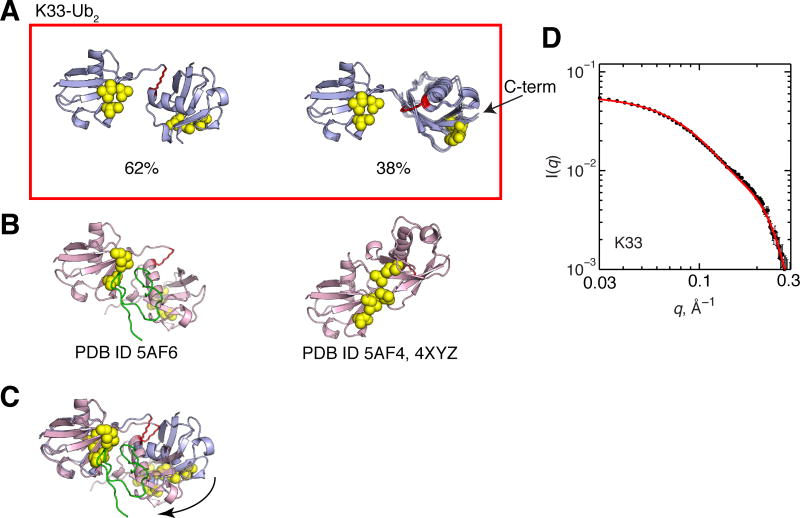
Given that K33 is located only one helical turn away from K29 and is on the same face of Ub’s α-helix, one could expect K33-Ub2’s conformational ensemble to parallel that of K29-Ub2. Indeed there are similarities between the conformational ensembles of the two chains. Just as for K29-Ub2, there is little Ub/Ub interaction, as evidenced from the absence of CSPs in the distal Ub (Figure 2). Remarkably, however, the SES analysis showed that a single 2-conformer ensemble is consistent with the experimental RDC data (Figure 12A). SANS data predicted from this ensemble are also in good agreement with experimental data (Figure 12D). As shown in Figure 12C, the major conformer of K33-Ub2 bears resemblance to the structure of K33-Ub2 in complex with TRABID NZF1 (PDB ID 5AF6), which is also nearly identical to the TRABID NZF1-bound structure of K29-Ub2 (PDB ID 4S1Z). The major conformer of K33-Ub2 also resembles the single-structure representations derived from RDCs and 15N relaxation data; these structures are all related by rotations about the z-axis of the alignment and diffusion tensors (Figure 6). The minor conformer of K33-Ub2 (~38% weight) exhibits striking similarity with several of the major conformers of K29-Ub2’s 3-conformer ensembles. Furthermore, the location of the C-terminus in the proximal Ub in this conformer (Figure 12A) could enable extended structures of longer K33-linked polyUb chains in solution. As discussed above (and refs.24,25) there is likely substantial conformational space overlap between K29-Ub2 and K33-Ub2, and this might have significant implications for the recognition of these chain types by receptor proteins in the cell.
Figure 12.
(A) Two-conformer ensemble for K33-Ub2. See legend to Figure 8 for general description of structures and numbers. (B) Crystal structures of K33-Ub2, unbound (right) and in complex with TRABID NZF1 (left, NZF1 is shown as green ribbon) (C) Overlay of the crystal structure 5AF6 (pink) and the major conformer (light blue) of the K33-Ub2 ensemble from panel A. The arrow shows the rotation of the proximal Ub that superimposes it with the crystal structure. (D) Agreement between experimental (black circles) and predicted (red line) SANS profiles for K33-Ub2.
Of note, the crystal structure of the unbound form of K33-Ub2 (PDB ID 4XYZ, 5AF4) was not present in the SES-derived ensembles for K33-Ub2 even when extending them to 3-conformer ensembles (data not shown). To test whether consideration of this structure was important, we constructed a 4-member ensemble consisting of the two crystal structures (5AF4 and 5AF6) and the two conformers shown in Figure 12A, but the results indicate that the inclusion of the crystal structures did not change the SES results.
e) Conformational ensembles of K63-linked diubiquitin
To complete the analysis of all lysine-linked Ub2s, we also determined conformational ensembles for K63-Ub2 (Figure S7). This chain linkage is known to adopt mainly extended conformations in solution.27,50 The results of our ensemble analysis are generally consistent with this characteristic feature of K63-Ub2. From SES analysis, we selected three representative ensembles (out of 7, data not shown) that are in best agreement with SANS data. In each of these ensembles, both major and minor conformers adopt extended structures. However, in each ensemble, there is a minor population of a more compact conformer. Of note, one conformer of K63-Ub2 (see Figure S7E) exhibited similarity to a K6-Ub2 conformer.
Polyubiquitin chain flexibility
Our experimental NMR and SANS data presented here show that polyUb chains are conformationally heterogeneous, and this heterogeneity likely originates from the flexibility of the Ub-Ub linker. The linker flexibility allows these chains to adopt both compact and extended conformations, all in dynamic equilibrium in solution.56. As such, our ensemble analyses identified several compact Ub2 conformations that are in agreement with some crystal structures (particularly for K6-Ub2 and K11-Ub2). However, the compact conformers alone are not sufficient to explain solution NMR and SANS data; this emphasizes the need to consider Ub2 as an ensemble of multiple conformers in dynamic equilibrium with each other. Flexibility is critical for polyUb’s biological function, as it enables polyUb recognition by different binding partners. Furthermore, each polyUb chain explores a unique conformational space as a result of the different lysines through which the Ub monomers are tethered. Therefore, each polyUb adopts different, linkage-specific conformations, which allows the ligand-binding surfaces (in many cases, the hydrophobic surface patch(es)) to interact via different binding modes with the receptor proteins. For example, it is tempting to speculate that the observed heterogeneity of the K29-Ub2 ensembles could be related to many roles that K29-linked chains play in cells17,18
Able to accommodate different binding partners, polyUb chains can serve as scaffolds for regulating many different simultaneous interactions with proteins.59 Given this possibility, one can imagine that conformational ensembles of longer polyUb chains will be even more complex than the Ub2 ensembles characterized here. Although this study is focused on Ub2 chains, it sets the stage for learning how to model and characterize longer polyUb chains, and not just homogeneous ones, consisting of a single Lys linkage, but heterogeneous ones as well. A further extension of this work envisions applying the conformational ensemble analyses to model the structure and dynamics of branched polyUb chains (ubiquitin chains built on several different lysines on the same Ub). From a more general perspective, the ensemble analysis method demonstrated here is broadly applicable to other multidomain systems composed of well-folded domains connected via flexible linkers.
Biological implications of conformer similarity across different diubiquitin ensembles
Inside cells, there is underlying redundancy of Ub chain signaling. For example, K48-linked polyUbs are not the only Ub conjugates that target substrate proteins for proteasomal degradation.9 Secondly, many ubiquitin-conjugating enzymes are capable of making Ub chains containing more than just a single type of lysine linkage. Also, polyUb-receptor proteins often interact with more than a single type of polyUb chain.24,60,61 Furthermore, replacing Ub lysines with arginines does not affect yeast cell viability, except for K48.7,62 Collectively, these observations suggest redundancy in the (poly)ubiquitin-signaling system. Therefore, it is perhaps not surprising to find conformers with similar Ub/Ub arrangements across different Ub2 conformational ensembles, as we found for K6-Ub2 and K11-Ub2 ensembles, and again for K29-Ub2 and K33-Ub2 ensembles. Notably, several conformations of K6-Ub2, K11-Ub2, and K27-Ub2 resemble the UBA2-bound conformation of K48-Ub2 (Figure 13A). It should be pointed out that the population weights obtained here reflect conformational equilibrium at 23°C. We expect that at physiological temperatures, as the relative weights of the lesser populated states increase, additional conformations might become important.
Figure 13.

Conformer similarity across different Ub2 conformational ensembles. (A) Comparison of the UBA2-bound structure of K48-Ub265 (PDB ID 1ZO6) with structurally similar conformers from K6-, K11-, and K27-Ub2 ensembles. The code underneath each conformer refers to ensemble number, E, and conformer number, C (in the order of their appearance in Figures 8–12). Note the striking similarity between K27- and K48-Ub2 conformations. The proximal-Ub orientations of K6 and K11 conformers are a 180° flip of the K48-Ub2 proximal Ub. (B) Analogous comparison with the K63-Ub2 structures from PDB IDs 2JF5 (top) and 3A1Q (bottom). (C) Structurally similar conformers from K29-Ub2 and K33-Ub2 conformational ensembles attest to ensemble overlap of these different Ub2s. In all the panels, structure rendering is as described in Figure 1. The bound ligands (UBA2 in A and tandem-UIM of Rap80 in B) are shown as green ribbon.
Some diubiquitins, such as K27-Ub2, K29-Ub2, and K33-Ub2 appear to have Ub/Ub orientations similar to K63-Ub2; these chains may bind multiple Ub-binding proteins in an avid manner. Interestingly, the Ub/Ub orientation in the major conformer of K29-Ub2 ensembles is similar to that of K63-Ub2 in complex with the tandem-UIM motif of Rap80 (Figure 13B). Moreover, as has been shown recently24–26, K29- and K33-Ub2 can accommodate other binding partners, such as zinc-finger domain, by forming a sandwich-like complex that involves different residues on Ub beside the canonical hydrophobic patch. Other binding modes – yet to be determined – are also possible for any of the diubiquitins studied here.
Conclusions
This work is fundamentally an example of an integrative approach that combines experimental and computational techniques to elucidate biologically-relevant conformational ensembles of polyubiquitin chains. We find that polyubiquitin chains are dynamic multidomain systems which in solution exist in dynamic equilibrium among many conformers. The conformational heterogeneity of polyubiquitin chains revealed by our analysis suggests unique as well as overlapping functions. The data presented here can potentially be used to aid design of linkage-specific binding-competent polyUb conformers and to engineer linkage-specific receptors and antibodies. With these goals in mind, the analysis of conformational ensembles of Ub2 and longer chains will improve our understanding of polyUb chain recognition and function inside cells.
Supplementary Material
Acknowledgments
This work was supported in part by a NSF postdoctoral award to C.A.C. and NIH R01 grant GM065334 to D.F., utilized neutron-scattering facilities supported by the NSF under Agreement No. DMR-0944772, and benefitted from CCP-SAS software developed through a joint EPSRC (EP/K039121/1) and NSF (CHE-1265821) grant. We thank Emma Dixon for assistance in assembly and purification of some Ub2 proteins, and Konstantin Berlin for helpful discussions regarding SES.
Footnotes
Certain commercial equipment, instruments, or materials are identified in this paper to foster understanding. Such identification does not imply recommendation or endorsement by the National Institute of Standards and Technology, nor does it imply that the materials or equipment identified are necessarily the best available for the purpose.
References
- 1.Ciechanover A, Iwai K. IUBMB Life. 2004;56:193–201. doi: 10.1080/1521654042000223616. [DOI] [PubMed] [Google Scholar]
- 2.Pickart CM, Fushman D. Curr Opin Chem Biol. 2004;8:610–616. doi: 10.1016/j.cbpa.2004.09.009. [DOI] [PubMed] [Google Scholar]
- 3.Fushman D, Wilkinson K. F1000 Biol Rep. 2011;3:1–10. doi: 10.3410/B3-26. [DOI] [PMC free article] [PubMed] [Google Scholar]
- 4.Castañeda CA, Kashyap TR, Nakasone MA, Krueger S, Fushman D. Structure. 2013;21:1168–1181. doi: 10.1016/j.str.2013.04.029. [DOI] [PMC free article] [PubMed] [Google Scholar]
- 5.Hospenthal MK, Freund SMV, Komander D. Nat Struct Mol Biol. 2013;20:555–565. doi: 10.1038/nsmb.2547. [DOI] [PMC free article] [PubMed] [Google Scholar]
- 6.Dammer EB, Na CH, Xu P, Seyfried NT, Duong DM, Cheng D, Gearing M, Rees H, Lah JJ, Levey AI, Rush J, Peng J. J Biol Chem. 2011;286:10457–10465. doi: 10.1074/jbc.M110.149633. [DOI] [PMC free article] [PubMed] [Google Scholar]
- 7.Xu P, Duong DM, Seyfried NT, Cheng D, Xie Y, Robert J, Rush J, Hochstrasser M, Finley D, Peng J. Cell. 2009;137:133–145. doi: 10.1016/j.cell.2009.01.041. [DOI] [PMC free article] [PubMed] [Google Scholar]
- 8.Ziv I, Matiuhin Y, Kirkpatrick DS, Erpapazoglou Z, Leon S, Pantazopoulou M, Kim W, Gygi SP, Haguenauer-Tsapis R, Reis N, Glickman MH, Kleifeld O. Mol Cell Proteomics MCP. 2011;10 doi: 10.1074/mcp.M111.009753. M111.009753. [DOI] [PMC free article] [PubMed] [Google Scholar]
- 9.Meyer HJ, Rape M. Cell. 2014;157:910–921. doi: 10.1016/j.cell.2014.03.037. [DOI] [PMC free article] [PubMed] [Google Scholar]
- 10.Nakasone MA, Livnat-Levanon N, Glickman MH, Cohen RE, Fushman D. Structure. 2013;21:727–740. doi: 10.1016/j.str.2013.02.019. [DOI] [PMC free article] [PubMed] [Google Scholar]
- 11.Wu-Baer F, Ludwig T, Baer R. Mol Cell Biol. 2010;30:2787–2798. doi: 10.1128/MCB.01056-09. [DOI] [PMC free article] [PubMed] [Google Scholar]
- 12.Zhang Z, Lv X, Yin W, Zhang X, Feng J, Wu W, Hui C, Zhang L, Zhao Y. Dev Cell. 2013;25:636–644. doi: 10.1016/j.devcel.2013.05.006. [DOI] [PubMed] [Google Scholar]
- 13.Bremm A, Komander D. Trends Biochem Sci. 2011;36:355–363. doi: 10.1016/j.tibs.2011.04.004. [DOI] [PubMed] [Google Scholar]
- 14.Arimoto K, Funami K, Saeki Y, Tanaka K, Okawa K, Takeuchi O, Akira S, Murakami Y, Shimotohno K. Proc Natl Acad Sci U S A. 2010;107:15856–15861. doi: 10.1073/pnas.1004621107. [DOI] [PMC free article] [PubMed] [Google Scholar]
- 15.Liu J, Han C, Xie B, Wu Y, Liu S, Chen K, Xia M, Zhang Y, Song L, Li Z, Zhang T, Ma F, Wang Q, Wang J, Deng K, Zhuang Y, Wu X, Yu Y, Xu T, Cao X. Nat Immunol. 2014;15:612–622. doi: 10.1038/ni.2898. [DOI] [PubMed] [Google Scholar]
- 16.Birsa N, Norkett R, Wauer T, Mevissen TET, Wu HC, Foltynie T, Bhatia K, Hirst WD, Komander D, Plun-Favreau H, Kittler JT. J Biol Chem. 2014;289:14569–14582. doi: 10.1074/jbc.M114.563031. [DOI] [PMC free article] [PubMed] [Google Scholar]
- 17.Fei C, Li Z, Li C, Chen Y, Chen Z, He X, Mao L, Wang X, Zeng R, Li L. Mol Cell Biol. 2013;33:4095–4105. doi: 10.1128/MCB.00418-13. [DOI] [PMC free article] [PubMed] [Google Scholar]
- 18.Zhou HL, Geng C, Luo G, Lou H. Genes Dev. 2013;27:1046–1058. doi: 10.1101/gad.215681.113. [DOI] [PMC free article] [PubMed] [Google Scholar]
- 19.Yuan WC, Lee YR, Lin SY, Chang LY, Tan YP, Hung CC, Kuo JC, Liu CH, Lin MY, Xu M, Chen ZJ, Chen RH. Mol Cell. 2014;54:586–600. doi: 10.1016/j.molcel.2014.03.035. [DOI] [PubMed] [Google Scholar]
- 20.Castañeda CA, Liu J, Chaturvedi A, Nowicka U, Cropp TA, Fushman D. J Am Chem Soc. 2011;133:17855–68. doi: 10.1021/ja207220g. [DOI] [PMC free article] [PubMed] [Google Scholar]
- 21.Virdee S, Ye Y, Nguyen DP, Komander D, Chin JW. Nat Chem Biol. 2010;6:750–757. doi: 10.1038/nchembio.426. [DOI] [PubMed] [Google Scholar]
- 22.Matsumoto ML, Wickliffe KE, Dong KC, Yu C, Bosanac I, Bustos D, Phu L, Kirkpatrick DS, Hymowitz SG, Rape M, Kelley RF, Dixit VM. Mol Cell. 2010;39:477–484. doi: 10.1016/j.molcel.2010.07.001. [DOI] [PubMed] [Google Scholar]
- 23.Bremm A, Freund SMV, Komander D. Nat Struct Mol Biol. 2010;17:939–947. doi: 10.1038/nsmb.1873. [DOI] [PMC free article] [PubMed] [Google Scholar]
- 24.Michel MA, Elliott PR, Swatek KN, Simicek M, Pruneda JN, Wagstaff JL, Freund SMV, Komander D. Mol Cell. 2015;58:95–109. doi: 10.1016/j.molcel.2015.01.042. [DOI] [PMC free article] [PubMed] [Google Scholar]
- 25.Kristariyanto YA, Abdul Rehman SA, Campbell DG, Morrice NA, Johnson C, Toth R, Kulathu Y. Mol Cell. 2015;58:83–94. doi: 10.1016/j.molcel.2015.01.041. [DOI] [PMC free article] [PubMed] [Google Scholar]
- 26.Kristariyanto YA, Choi SY, Rehman SAA, Ritorto MS, Campbell DG, Morrice NA, Toth R, Kulathu Y. Biochem J. 2015;467:345–352. doi: 10.1042/BJ20141502. [DOI] [PMC free article] [PubMed] [Google Scholar]
- 27.Datta AB, Hura GL, Wolberger C. J Mol Biol. 2009;392:1117–1124. doi: 10.1016/j.jmb.2009.07.090. [DOI] [PMC free article] [PubMed] [Google Scholar]
- 28.Cook WJ, Jeffrey LC, Carson M, Chen Z, Pickart CM. J Biol Chem. 1992;267:16467–16471. doi: 10.2210/pdb1aar/pdb. [DOI] [PubMed] [Google Scholar]
- 29.Eddins MJ, Varadan R, Flushman D, Pickart CM, Wolberger C. J Mol Biol. 2007;367:204–211. doi: 10.1016/j.jmb.2006.12.065. [DOI] [PubMed] [Google Scholar]
- 30.Dickinson BC, Varadan R, Fushman D. Protein Sci. 2007;16:369–378. doi: 10.1110/ps.062508007. [DOI] [PMC free article] [PubMed] [Google Scholar]
- 31.Varadan R, Walker O, Pickart C, Fushman D. J Mol Biol. 2002;324:637–647. doi: 10.1016/s0022-2836(02)01198-1. [DOI] [PubMed] [Google Scholar]
- 32.Ryabov Y, Fushman D. Proteins-Struct Funct Bioinforma. 2006;63:787–796. doi: 10.1002/prot.20917. [DOI] [PubMed] [Google Scholar]
- 33.Andrałojć W, Berlin K, Fushman D, Luchinat C, Parigi G, Ravera E, Sgheri L. J Biomol NMR. 2015;62:353–371. doi: 10.1007/s10858-015-9951-6. [DOI] [PMC free article] [PubMed] [Google Scholar]
- 34.Berlin K, Castañeda CA, Schneidman-Duhovny D, Sali A, Nava-Tudela A, Fushman D. J Am Chem Soc. 2013;135:16595–16609. doi: 10.1021/ja4083717. [DOI] [PMC free article] [PubMed] [Google Scholar]
- 35.van den Bedem H, Fraser JS. Nat Methods. 2015;12:307–318. doi: 10.1038/nmeth.3324. [DOI] [PMC free article] [PubMed] [Google Scholar]
- 36.Motlagh HN, Wrabl JO, Li J, Hilser VJ. Nature. 2014;508:331–339. doi: 10.1038/nature13001. [DOI] [PMC free article] [PubMed] [Google Scholar]
- 37.Jensen MR, Ruigrok RWH, Blackledge M. Curr Opin Struct Biol. 2013;23:426–435. doi: 10.1016/j.sbi.2013.02.007. [DOI] [PubMed] [Google Scholar]
- 38.Curtis JE, Raghunandan S, Nanda H, Krueger S. Comput Phys Commun. 2012;183:382–389. [Google Scholar]
- 39.Hall JB, Fushman D. J Biomol NMR. 2003;27:261–275. doi: 10.1023/a:1025467918856. [DOI] [PubMed] [Google Scholar]
- 40.Berlin K, Longhini A, Dayie TK, Fushman D. J Biomol NMR. 2013;57:333–352. doi: 10.1007/s10858-013-9791-1. [DOI] [PMC free article] [PubMed] [Google Scholar]
- 41.Walker O, Varadan R, Fushman D. J Magn Reson. 2004;168:336–345. doi: 10.1016/j.jmr.2004.03.019. [DOI] [PubMed] [Google Scholar]
- 42.Berlin K, O’Leary DP, Fushman D. Proteins Struct Funct Bioinforma. 2011;79:2268–2281. doi: 10.1002/prot.23053. [DOI] [PMC free article] [PubMed] [Google Scholar]
- 43.Fushman D, Cahill S, Cowburn D. J Mol Biol. 1997;266:173–194. doi: 10.1006/jmbi.1996.0771. [DOI] [PubMed] [Google Scholar]
- 44.Goddard TD, Kneller DG. SPARKY 3. University of California; San Francisco: [Google Scholar]
- 45.Lee W, Tonelli M, Markley JL. Bioinformatics. 2015;31:1325–1327. doi: 10.1093/bioinformatics/btu830. [DOI] [PMC free article] [PubMed] [Google Scholar]
- 46.Berlin K, O’Leary DP, Fushman D. J Magn Reson. 2009;201:25–33. doi: 10.1016/j.jmr.2009.07.028. [DOI] [PMC free article] [PubMed] [Google Scholar]
- 47.Fushman D, Walker O. J Mol Biol. 2010;395:803–814. doi: 10.1016/j.jmb.2009.10.039. [DOI] [PMC free article] [PubMed] [Google Scholar]
- 48.O’Leary DP. Scientific Computing with Case Studies, SIAM. 2009 [Google Scholar]
- 49.Kline SR. J Appl Crystallogr. 2006;39:895–900. [Google Scholar]
- 50.Varadan R, Assfalg N, Haririnia A, Raasi S, Pickart C, Fushman D. J Biol Chem. 2004;279:7055–7063. doi: 10.1074/jbc.M309184200. [DOI] [PubMed] [Google Scholar]
- 51.Dixon EK, Castañeda CA, Kashyap TR, Wang Y, Fushman D. Bioorg Med Chem. 2013;21:3421–3429. doi: 10.1016/j.bmc.2013.02.052. [DOI] [PMC free article] [PubMed] [Google Scholar]
- 52.Sims JJ, Cohen RE. Mol Cell. 2009;33:775–83. doi: 10.1016/j.molcel.2009.02.011. [DOI] [PMC free article] [PubMed] [Google Scholar]
- 53.Fushman D, Varadan R, Assfalg M, Walker O. Prog Nucl Magn Reson Spectrosc. 2004;44:189–214. [Google Scholar]
- 54.Tjandra N, Feller SE, Pastor RW, Bax A. J Am Chem Soc. 1995;117:12562–12566. [Google Scholar]
- 55.Zhang Y, Zhou L, Rouge L, Phillips AH, Lam C, Liu P, Sandoval W, Helgason E, Murray JM, Wertz IE, Corn JE. Nat Chem Biol. 2013;9:51–58. doi: 10.1038/nchembio.1134. [DOI] [PubMed] [Google Scholar]
- 56.Losonczi JA, Andrec M, Fischer MWF, Prestegard JH. J Magn Reson. 1999;138:334–342. doi: 10.1006/jmre.1999.1754. [DOI] [PubMed] [Google Scholar]
- 57.Clore GM, Garrett DS. J Am Chem Soc. 1999;121:9008–9012. [Google Scholar]
- 58.Brüschweiler R, Liao X, Wright PE. Science. 1995;268:886–889. doi: 10.1126/science.7754375. [DOI] [PubMed] [Google Scholar]
- 59.Zhang D, Chen T, Ziv I, Rosenzweig R, Matiuhin Y, Bronner V, Glickman MH, Fushman D. Mol Cell. 2009;36:1018–1033. doi: 10.1016/j.molcel.2009.11.012. [DOI] [PMC free article] [PubMed] [Google Scholar]
- 60.Raasi S, Varadan R, Fushman D, Pickart CM. Nat Struct Mol Biol. 2005;12:708–714. doi: 10.1038/nsmb962. [DOI] [PubMed] [Google Scholar]
- 61.Castañeda CA, Spasser L, Bavikar SN, Brik A, Fushman D. Angew Chem Int Ed. 2011;50:11210–11214. doi: 10.1002/anie.201104649. [DOI] [PMC free article] [PubMed] [Google Scholar]
- 62.Roscoe BP, Thayer KM, Zeldovich KB, Fushman D, Bolon DNA. J Mol Biol. 2013;425:1363–1377. doi: 10.1016/j.jmb.2013.01.032. [DOI] [PMC free article] [PubMed] [Google Scholar]
- 63.Ghose R, Fushman D, Cowburn D. J Magn Reson. 2001;149:204–217. doi: 10.1006/jmre.2001.2295. [DOI] [PubMed] [Google Scholar]
- 64.Semenyuk AV, Svergun DI. J Appl Crystallogr. 1991;24:537–540. [Google Scholar]
- 65.Varadan R, Assfalg M, Raasi S, Pickart C, Fushman D. Mol Cell. 2005;18:687–698. doi: 10.1016/j.molcel.2005.05.013. [DOI] [PubMed] [Google Scholar]
Associated Data
This section collects any data citations, data availability statements, or supplementary materials included in this article.


