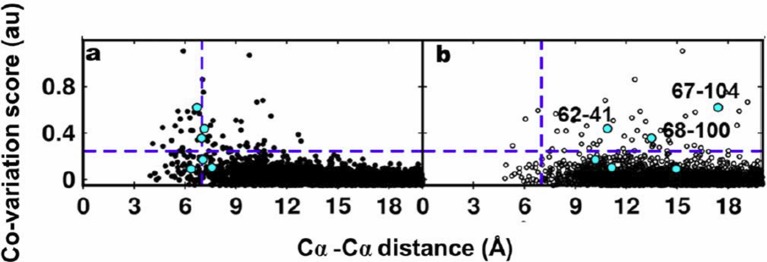
Author response image 4. Residue coupling score obtained from EVfold is plotted against the Cα-Cα distances calculated from a) the X-ray and b) the NMR structures.
Blue lines parallel to the X-axis indicate the co-variation score of the L/2th residue pair (when arranged in descending order of the score), where L is the length of the protein (L=121 for DgkA). Blue lines parallel to the Y- axis indicate the distance of 7Å which was used as the cutoff to define residue contacts. Experimentally determined spatially proximal (PIM, suppressor) contact pairs are shown in cyan.

