Abstract
Pgp is functional on the plasma membrane and lysosomal membrane. Lysosomal-Pgp can pump substrates into the organelle, thereby trapping certain chemotherapeutics (e.g. doxorubicin; DOX). This mechanism serves as a “safe house” to protect cells against cytotoxic drugs. Interestingly, in contrast to DOX, lysosomal sequestration of the novel anti-tumor agent and P-glycoprotein (Pgp) substrate, di-2-pyridylketone-4,4-dimethyl-3-thiosemicarbazone (Dp44mT), induces lysosomal membrane permeabilization. This mechanism of lysosomal-Pgp utilization enhances cytotoxicity to multidrug-resistant cells. Consequently, Dp44mT has greater anti-tumor activity in drug-resistant relative to non-Pgp-expressing tumors. Interestingly, stressors in the tumor microenvironment trigger endocytosis for cell signaling to assist cell survival. Hence, this investigation examined how glucose variation-induced stress regulated early endosome and lysosome formation via endocytosis of the plasma membrane. Furthermore, the impact of glucose variation-induced stress on resistance to DOX was compared with Dp44mT and its structurally related analogue, di-2-pyridylketone 4-cyclohexyl-4-methyl-3-thiosemicarbazone (DpC). These studies showed that glucose variation-induced stress-stimulated formation of early endosomes and lysosomes. In fact, through the process of fluid-phase endocytosis, Pgp was redistributed from the plasma membrane to the lysosomal membrane via early endosome formation. This lysosomal-Pgp actively transported the Pgp substrate, DOX, into the lysosome where it became trapped as a result of protonation at pH 5. Due to increased lysosomal DOX trapping, Pgp-expressing cells became more resistant to DOX. In contrast, cytotoxicity of Dp44mT and DpC was potentiated due to more lysosomes containing functional Pgp under glucose-induced stress. These thiosemicarbazones increased lysosomal membrane permeabilization and cell death. This mechanism has critical implications for drug-targeting in multidrug-resistant tumors where a stressful micro-environment exists.
Keywords: drug delivery, drug resistance, drug transport, endocytosis, glucose, lysosome, glucose-induced stress
Introduction
Multidrug resistance (MDR)5 is the principal cause of cancer cell resistance to chemotherapeutic drug treatment (1, 2). The most characterized mechanism of MDR involves increased drug efflux through the up-regulation of trans-membrane pumps (3). These transporters actively transport chemotherapeutic drugs out of the cell, resulting in a drug-resistant phenotype (4). Notably, P-glycoprotein (Pgp) is the most consistently overexpressed and the most studied ATP binding cassette (ABC) transporter protein involved in the development of MDR cancers (5, 6).
It has been demonstrated that Pgp not only functions to efflux drugs out of the cell when present on the plasma membrane but also serves a functional intracellular role in the lysosomal membrane to induce resistance (7). In this case, lysosomal membrane Pgp transports substrates into the organelle, which then acts as a “safe house” to prevent cytotoxic chemotherapeutics, such as doxorubicin (DOX; Fig. 1Ai), reaching their intracellular targets, e.g. the nucleus (7). Due to the ionization properties of DOX, the agent becomes trapped in this organelle as a result of its protonation at lysosomal pH (i.e. pH 5) (7).
FIGURE 1.
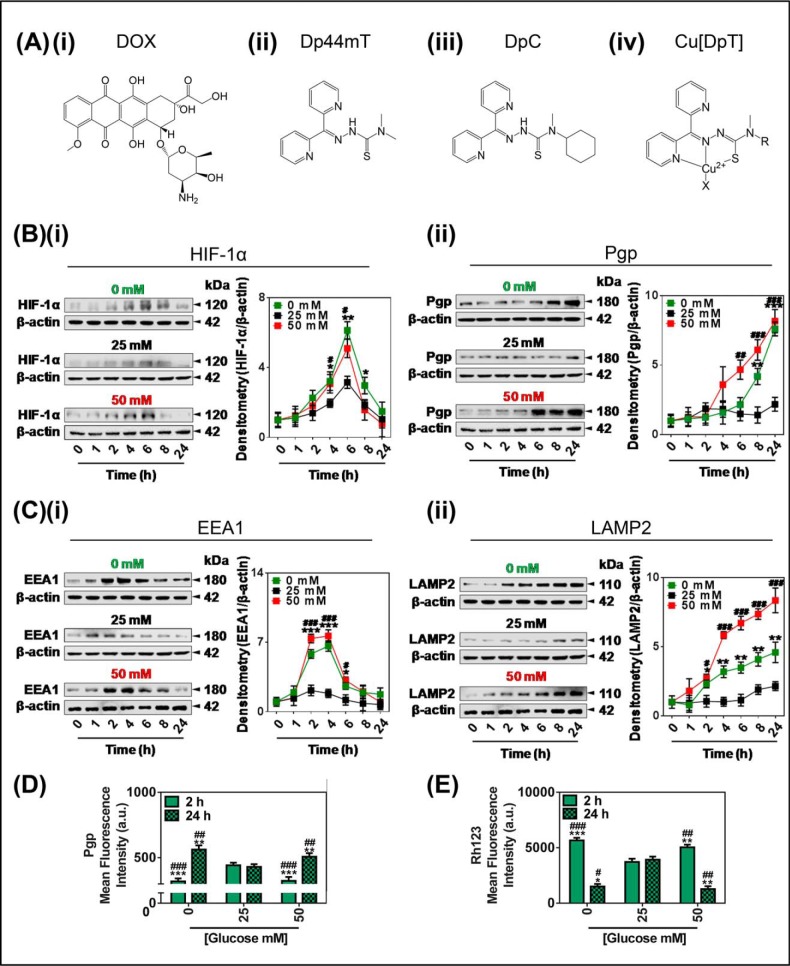
Glucose variation-induced stress increased the protein expression of Pgp, HIF-1α, EEA1, and LAMP2. A, line drawings of the chemical structures of the agents used in the investigation: i, DOX; ii, Dp44mT; iii, DpC; iv, the generalized structure for a copper-bound dipyridylthiosemicarbazone (DpT); Cu[DpT]. B and C, KBV1 (+Pgp) cells incubated for 0–24 h at 37 °C of low (0 mm; green), control (25 mm; black), or high (50 mm; red) glucose have modulated protein levels of HIF-1α (i) and Pgp (ii) (B) and EEA1 (i) and LAMP2 (lysosome marker) (ii) (C). D and E, glucose variation-induced stress either decreases or increases surface Pgp and activity over a 2- or 24-h incubation, respectively. Flow cytometric analysis of plasma membrane-Pgp measured at 4 °C (D) and retention of the Pgp-substrate Rh123 (E) after a change from the control (25 mm) glucose levels to low (0 mm) or high (50 mm) glucose after 2 or 24 h at 37 °C incubation. The results in (B and C) are typical of three experiments; densitometry is the mean ± S.D. (n = 3). *, p < 0.05; **, p < 0.01; ***, p < 0.001 is 0 mm glucose-treated cells relative to the respective 25 mm glucose-treated cells at the same time point (e.g. 0 mm glucose versus 25 mm glucose at 1 h). #, p < 0.05; ##, p < 0.01; ###, p < 0.001 is 50 mm glucose-treated cells relative to the respective 25 mm glucose-treated cells at the same time point (e.g. 50 mm glucose versus 25 mm glucose at 1 h). The results in D and E are presented as arbitrary units (a.u.) and are the mean ± S.D. (n = 3). *, p < 0.05; **, p < 0.01, and ***, p < 0.001 are relative to 2 h control (25 mm) glucose. #, p < 0.05; ##, p < 0.01, and ###, p < 0.001 are relative to the 24-h glucose control (25 mm).
Interestingly, there have been reports of several drugs that are more effective against MDR cells than their drug-sensitive counterparts (8–11). One such agent, namely the thiosemicarbazone, di-2-pyridylketone 4,4-dimethyl-3-thiosemicarbazone (Dp44mT; Fig. 1Aii), a Pgp substrate, has been shown to utilize Pgp on the lysosomal membrane to increase its transport and accumulation in this organelle, resulting in enhanced cytotoxicity (12). In contrast to other Pgp substrates, such as DOX, Dp44mT is transported by Pgp into the lysosome and, instead of being safely stored, potently reacts with copper to generate reactive oxygen species (ROS) that, in turn, cause lysosomal membrane permeabilization (LMP) and apoptosis (12–14). Hence, in the case of Dp44mT, cells overexpressing Pgp, i.e. MDR cells, become more sensitive to its cytotoxic activity, leading to the ability of this agent to overcome resistance (12). Furthermore, Dp44mT and the structurally similar thiosemicarbazone, di-2-pyridylketone 4-cyclohexyl-4-methyl-3-thiosemicarbazone (DpC; Fig. 1Aiii), have demonstrated marked anti-tumor and anti-metastatic activity in vitro and in vivo (15–20). Notably, DpC is expected to enter clinical trials by the end of 2016.
Recent studies have demonstrated that tumor cell stress stimuli, such as glucose starvation, increase the expression of plasma membrane Pgp through both mitochondrial electron transport chain-derived and NADPH oxidase-4 (NOX4)-induced oxidative signaling (21). Significantly, it has also been shown that redox-related stress can lead to increased receptor-mediated endocytosis for initiation of signaling pathways (22). In fact, endocytosis is a major physiological routing pathway that is known to facilitate the internalization of multiple membrane-bound proteins e.g. receptor-tyrosine kinases, transferrin receptors, and growth factor receptors, into endosomes and lysosomes (23–26). For example, stress-induced heat shock protein 70 has been linked to increased endocytosis of the plasma membrane in order to accelerate uptake of proteins through internalization of their ligand-receptor complex, such as the transferrin-transferrin receptor 1 complex (27). Hence, endocytosis is important to consider as a mediator of protein redistribution from the cell surface to intracellular organelles that occurs as a protective response under stress stimuli.
Understanding the effects of stress on processes such as endocytosis-induced drug resistance is important as tumor cells exist in a stressful micro-environment, where vital nutrients, such as glucose and oxygen, are under considerable flux leading to stress and cell death (28–30). As a consequence of these stress stimuli, cancer cells are constantly adapting their metabolism to the tumor micro-environment (31).
Herein, we report for the first time that glucose variation-induced stress, due to high or low levels of this nutrient, can cause Pgp redistribution from the plasma membrane to the lysosome. This event results in increased formation of lysosomes with active membrane-bound Pgp that can sequester drug substrates to regulate intracellular drug resistance. Indeed, glucose-induced stress imparted via low or high glucose levels was found to increase the number of lysosomes by a process consistent with fluid-phase endocytosis of the plasma membrane. It was established that these newly formed lysosomes had active Pgp that pumped cytosolic substrates into the organelle. This led to decreased cellular cytotoxicity of DOX due to safe house storage of this drug within the lysosome. In contrast, this mechanism potentiates the activity of redox active thiosemicarbazones through LMP in Pgp-expressing cells via the ability of these latter agents to utilize Pgp for lysosomal sequestration. Therefore, translocation of Pgp to the lysosome in the stressful tumor micro-environment is an important consideration for cancer treatment and in particular for new cytotoxic drugs targeting the lysosomal compartment.
Materials and Methods
Cell Treatments
All cell lines were routinely maintained in DMEM ([d-glucose] = 25 mm; herein referred to as “normal glucose”; Life Technologies) (21). At the time of treatment, media were replaced with glucose-free DMEM (-d-glucose, 0 mm; herein referred to as “low glucose”; Life Technologies) or this medium supplemented with d-glucose (final [glucose] = 50 mm; herein referred to as “high glucose”; Life Technologies). Medium for growing KBV1 cells was supplemented with vinblastine (1 μg/ml) for maintenance of a full MDR-phenotype (32).
Preliminary studies demonstrated that due to the fact that the cells used in this study were routinely cultured using standard growth medium containing glucose at 25 mm, they had become adapted to these conditions. Indeed, the higher and lower concentrations of glucose implemented (i.e. 50 mm and 0 mm, respectively) were essential in order to observe the glucose-induced stress response. Hence, this culture model simulates the relative hypo- and hyperglycemic conditions experienced in vivo. Studies were also performed in an attempt to adapt the cells to lower glucose concentrations (<20 mm) by prolonged incubations at these levels. However, these experiments were unsuccessful and led to a significant decrease in cellular viability (not shown).
Proliferation Assay
Cellular proliferation was assessed using MTT (3-(4,5-dimethylthiazol-2-yl)-2,5-diphenyltetrazolium bromide) assays, which were validated by viable cell counts using standard procedures (33). Cells were treated with glucose (0, 25, or 50 mm) for 2 h at 37 °C before and for the duration of the experiment. Cells were incubated with serial dilutions of DOX for 72 h at 37 °C or thiosemicarbazones (i.e. Dp44mT or DpC) for 24 h at 37 °C. Studies were performed in the presence or absence of the Pgp inhibitor, Elacridar (Ela; 0.2 μm), which was added 30 min before the drug treatments and was present for the duration of the experiment.
Protein Extraction and Western Blotting
Membrane and whole cell protein extractions as well as Western blotting were performed using standard procedures (34). Membranes were probed using mouse anti-Pgp (catalog #P7965, 1:5000, Sigma), mouse anti-HIF-1α (catalog #610958; 1:400, BD Biosciences), rabbit anti-EEA1 (catalog #ab2900; 1:1000, Abcam, Cambridge, UK), or rabbit anti-lysosomal-associated membrane protein 2 (LAMP2; catalog #ab37024; 1:1000, Abcam). Incubations were performed overnight at 4 °C followed by an appropriate secondary antibody (horseradish peroxidase-conjugated goat anti-mouse (catalog #A4416, 1:10,000, Sigma) or goat anti-rabbit (catalog #A6154, 1:10,000) from Sigma) for 1 h at room temperature. Mouse anti-β-actin (catalog #A5441; 1:5000, Sigma) was used as a protein-loading control.
Preparation of Fe-125I-transferrin
Human apotransferrin (Sigma) was labeled with iron nitrilotriacetate in the presence of excess bicarbonate to produce holotransferrin (35). Holo-transferrin was then covalently labeled with 125I (Na125I, catalog #NEZ033A; PerkinElmer Life Sciences) by the iodine monochloride method, as previously described (36, 37).
Uptake of 125I-Transferrin
To measure the uptake of transferrin by KBV1 cells, cells were treated for 2 h with 0, 25, or 50 mm glucose in DMEM media. This was then replaced with new media of the same respective glucose concentration, with the radiolabel added. At the end of the radiolabel incubation time points, the plates were placed on ice, the medium aspirated, and the cells washed four times with ice-cold PBS. The amount of radioactivity internalized by the cells was assessed with a gamma counter after incubation of cells with Pronase (1 mg/ml; Sigma) for 30 min at 4 °C to separate membrane-bound and internalized 125I-transferrin (35, 36).
Immunofluorescence of Dextran and Transferrin Uptake
Cells were co-incubated for 2 h with Alex Fluor® 488-holo-transferrin (catalog #T-13342, 25 μm, Life Technologies) or Alex Fluor® 488-Dextran (catalog #D22910, 10 μm, Life Technologies) and the glucose treatment (0, 25, or 50 mm). At the end of the incubation, cells were washed twice with ice-cold PBS followed by fixation with paraformaldehyde. Pro-gold anti-fade DAPI (Life Technologies) was used to mount coverslips. Images were captured with a Plan-APOCHROMT 63×/0.4 oil differential interference contrast objective using a fluorescence microscope equipped with an AxioCam camera (Zeiss, Oberkochen, Germany) using green (495-nm excitation/516-nm emission) and red (577-nm excitation/592-nm emission) fluorescence. The DAPI-stained nucleus was captured using blue (358-nm excitation/461-nm emission) fluorescence.
Immunofluorescence for Co-localization
Immunofluorescence was performed using a 16-h/4 °C incubation with anti-EEA1 (catalog #ab2900, 1:100, Abcam), anti-LAMP2 (catalog #ab37024, 1:100, Abcam), anti-cathepsin D (catalog #ab6313, 1:500, Abcam), FITC-conjugated Pgp antibody (catalog #557002, 1:5, BD Biosciences), and/or with DOX (catalog #09040050, 100 μm, Pfizer) followed by an incubation of 16 h at 4 °C with an Alexa Fluor® 594- or Alexa Fluor® 488-conjugated secondary antibody (catalog #11012/11008, 1:1000, Life Technologies). Notably, DOX is inherently fluorescent and as such does not require detection using a secondary antibody (7). Pro-gold anti-fade DAPI was used to mount coverslips (Life Technologies). Z-stack images were captured with a 63× objective using a fluorescence microscope equipped with an AxioCam camera (Zeiss) or a Zeiss LSM 510 Meta confocal microscope using green (488-nm excitation/516-nm emission) and red (577-nm excitation/592-nm emission) fluorescence. The DAPI-stained nucleus was captured using blue (405-nm excitation/461-nm emission) fluorescence. Deconvolution analysis was performed on z-stacked images to allow for Manders co-localization analysis (n > 4) (38).
Live Cell Fluorescence Imaging
The lysosomal stain, LysoTracker® Green (Life Technologies), was used to determine if DOX localizes to lysosomes. Cells were incubated with glucose treatments for 2 h at 37 °C. For the final 40 min, DOX (100 μm), LysoTracker® Green (75 nm), and Hoechst 33342 nuclear stain (10 μm; BD Biosciences) were added. Cells were then washed three times with ice-cold PBS. Staining of the cells was detected using the microscope/software above with a LD Plan-NEOFLUAR 40×/0.6 Ph2 Korr objective.
Assessment of Lysosomal Membrane Permeability
The lysosomotropic agent acridine orange (AO; Sigma) dye has a high specificity for lysosomes (39) and was used to determine LMP as previously reported (40, 41). Notably, AO is well known to cross into the acidic compartment of intact lysosomes, becoming protonated to emit in the red fluorescence range (39). Cells were treated with glucose (0, 25, or 50 mm) for 2 h at 37 °C before and for the duration of the experiment. Cells were subsequently incubated with AO (2.5 μg/ml) for 12 min at 37 °C, then washed twice with media and incubated with Cu[Dp44mT] (25 μm) or Cu[DpC] (10 μm) for 30 min at 37 °C. Treatments were also performed in the presence or absence of the Pgp inhibitor, Ela (0.2 μm), added for 30 min at 37 °C before AO treatment and also during thiosemicarbazone treatment. Cells were then washed twice with media and visualized at 40× for green (495-nm excitation/516-nm emission) and red (577-nm excitation/592-nm emission) fluorescence using a fluorescence microscope equipped with an AxioCam camera (Zeiss).
Flow Cytometry: Surface Pgp Detection
Cells were incubated with a FITC-conjugated mouse anti-Pgp antibody (catalog #557002, 1:5, BD Biosciences) for 30 min at 4 °C (at 4 °C endocytosis is inhibited; Refs. 35 and 36) and were then assessed using flow cytometry (FACSCantoTM II, BD Biosciences) at 488-nm excitation/530-nm emission. Data were collected from 10,000 cells/sample.
Flow Cytometry: Rh123 Accumulation Assay
Pgp functionality was assessed by measuring intracellular accumulation of the fluorescent Pgp substrate, rhodamine 123 (Rh123) (42). Cells were incubated with Rh123 (10 μm) for 30 min/37 °C and analyzed by flow cytometry (FACSCantoTM II, BD Biosciences) at 510-nm excitation/595-nm emission. Data were collected from 10,000 cells/sample.
Data and Image Analysis
Results were expressed as mean ± S.D., n ≥ 3 experiments. Statistical analysis was performed using one-way analysis of variance. Data were considered statistically significant when p < 0.05. In all figures: * or # is p < 0.05, ** or ## is p < 0.01, and *** or ### is p < 0.001. Concentration-response curves were fitted in Prism 6.0 (Graphpad Software, San Diego, CA) to obtain IC50 values. Fluorescence intensity and the Mander's overlap marker for image co-localization were measured using ImageJ 4.7v software (National Institutes of Health, Baltimore, MD). Analysis was performed on images taken where the gain and offset were established using the control conditions. These values were used as a constant for all images within an experiment. Only when an image reached saturation after a treatment was this value adjusted in all conditions. Flow cytometry data analysis was performed using FlowJo software (FlowJo LLC, Ashland, OR). Western blot densitometry was performed using ImageLab Software (Bio-Rad).
Results
Glucose Variation-induced Stress Increased the Expression of HIF-1α and Pgp in MDR Cells
Recently we reported that glucose variation-induced stress, mediated by low or high levels of glucose, increases total tumor cell Pgp expression and thus, MDR (21). Considering this, we hypothesized that increased Pgp expression could also result in an increase of this transporter in the lysosomal compartment that may contribute to lysosomal sequestration of cytotoxic chemotherapeutics and consequently MDR. This was important to elucidate considering that glucose variation-induced stress is evident within the tumor microenvironment (28–30) and could lead to increased lysosome formation, potentially by enhanced endocytosis. Hence, initial studies investigated the effect of glucose variation-induced stress on the expression of 1) HIF-1α, which is a transcription factor that induces Pgp expression (21, 43, 44) and is up-regulated by glucose variation-induced stress (21), 2) Pgp, and 3) classical markers of the endosome and lysosome, namely, early endosomal antigen 1 (EEA1) and LAMP2, respectively (45, 46).
Initial investigations were performed using human cervical carcinoma KBV1 cells (8, 32), as they express readily detectable Pgp levels that are functionally active (7, 21). For all experiments, to study glucose variation-induced stress, cells were exposed to: 1) glucose-deprivation (0 mm; herein referred to as low glucose), 2) the glucose concentration used in DMEM (from the manufacturer) to routinely culture cells (namely 25 mm; herein referred to as normal glucose), or 3) high glucose (50 mm) for 1–24 h at 37 °C. Previous studies demonstrated that because these cells were routinely cultured with this standard growth medium using glucose at 25 mm, they had become adapted to these conditions (21). Indeed, the higher and lower concentrations of glucose implemented were crucial in order to observe the glucose variation-induced stress response (21). Hence, this cell culture model simulates the relative hypo- and hyper-glycemic conditions that occur within the dynamic tumor micro-environment (21).
A time course of 1, 2, 4, 6, 8, and 24 h at 37 °C was first assessed to examine the effect of low (0 mm), normal (25 mm), or high (50 mm) glucose concentrations on the protein levels of HIF-1α (Fig. 1Bi) and Pgp (Fig. 1Bii). Importantly, the cells tolerated all stress conditions, with >90% viability after a 24-h incubation (data not shown). Compared with normal glucose, HIF-1α expression was markedly and significantly (p < 0.01–0.05) increased after incubations of 4–8 h with low glucose (Fig. 1Bi), with peak HIF-1α levels occurring at 6 h (Fig. 1Bi). Similarly, relative to normal glucose, HIF-1α expression was significantly (p < 0.05) increased after a 4–6-h incubation with high glucose, also peaking at 6 h (Fig. 1Bi). However, HIF-1α expression was no longer significantly (p > 0.05) higher compared with normal glucose after a 24-h incubation with high glucose (Fig. 1Bi). It can be speculated that this overall response of HIF-1α expression to glucose levels could indicate there is a homeostatic feedback mechanism after 6 h. This feedback may occur in response to the affect of HIF-1 target genes that resolve the stress to subsequently suppress the initial stimulation via HIF-1α. Relative to low and high glucose, HIF-1α expression after incubation with normal glucose also showed the same type of response as a function of time, but it was markedly less pronounced than that with low or high glucose (Fig. 1Bi).
Moreover, Pgp expression was significantly (p < 0.001–0.01) increased after an 8–24-h incubation with low glucose, compared with normal glucose (Fig. 1Bii). Similarly, Pgp expression was significantly (p < 0.001–0.01) elevated with high glucose treatment after incubations of 6–24 h compared with normal glucose (Fig. 1Bii). In comparison to low and high glucose, normal glucose (25 mm), showed only a slight (p > 0.05) stimulatory response after 24 h relative to the 0-h time point, but this effect was far less than that observed after low or high glucose levels (Fig. 1Bii).
Glucose Variation-induced Stress Increased Expression of Protein Markers of Early Endosomes and Lysosomes in MDR Cells
As previous studies have shown that the presence of Pgp on the lysosomal membrane causes selective MDR cell-associated drug sensitivity to thiosemicarbazones (12), we next assessed the implications of glucose variation-induced stress on the expression of the formation of lysosomes via the well characterized endocytosis pathway (47, 48). To initially study this, the changes in expression of EEA1 (Fig. 1Ci) and LAMP2 (Fig. 1Cii) were measured by Western blotting, as these proteins are well characterized markers of early endosomes and lysosomes, respectively (49, 50). The expression of EEA1 was significantly (p < 0.001–0.05) increased after incubation with low (0 mm) glucose after 2–6 h, peaking between 2–4 h compared with normal glucose (25 mm; Fig. 1Ci). After an 8–24-h incubation with low glucose, the protein expression of EEA1 was no longer significantly (p > 0.05) different from the normal glucose. Similarly, after a high (50 mm) glucose treatment, a significant (p < 0.001–0.05) increase in EEA1 was observed between 2 and 6 h compared with normal glucose (Fig. 1Ci). At 8–24 h, EEA1 expression induced by high glucose was no longer significantly (p > 0.05) greater than normal glucose (Fig. 1Ci). When compared with low and high glucose, normal glucose demonstrated only a minor (p > 0.05) stimulatory response between 2–4 h relative to the 0-h time point, which was far less than that observed after low or high glucose levels (Fig. 1Ci).
Expression of the lysosomal marker (LAMP2) was significantly (p < 0.001–0.05) increased at 2–24 h after an incubation with low and high glucose media compared with normal glucose (Fig. 1Cii). On the other hand, cells that were treated with normal glucose demonstrated only a minor (p > 0.05) increase in LAMP2 expression between 8 and 24 h relative to the 0-h time point. This latter response was far less than that observed after low and high glucose levels (Fig. 1Cii).
It is notable that the kinetics of EEA1 and LAMP2 expression in response to 0 or 50 mm glucose are markedly different (cf. Fig. 1C, i and ii), which may reflect the turnover (i.e. half-life) of these proteins and the response to the initial stimulus. Indeed, like the response of HIF-1α to glucose variation-induced stress (Fig. 1Bi), the effect on EEA1 levels (Fig. 1Ci) appears as a transient response to this stimulus that then recovers after 8–24 h. In contrast, the response of LAMP2 (Fig. 1Cii) to the alteration in glucose levels appears more similar to Pgp (Fig. 1Bii), with the elevated expression remaining high for the entire incubation of 24 h. Considering this, it is known that early endosomes cycle rapidly and have a short half-life, whereas the lysosome is a much longer lived organelle (51–53).
Collectively, these results indicate that low (0 mm) and high (50 mm) glucose treatments induce significantly increased expression of protein markers of early endosomes and lysosomes. This occurred before significantly increased Pgp expression possibly via the HIF-1α pathway that is known to target and up-regulate Pgp under these same conditions of glucose-induced stress (21).
Glucose Variation-induced Stress Decreased Cell Surface Pgp Expression and Function after 2 h but Increased Cell Surface Pgp and Function after 24 h
Interestingly, flow cytometry demonstrated that after a 2-h incubation, the low (0 mm) and high (50 mm) glucose treatments significantly (p < 0.001) lowered surface Pgp expression compared with normal glucose (25 mm; Fig. 1D). This observation of altered subcellular distribution of Pgp was notable considering that no significant (p > 0.05) change in total cellular Pgp protein levels was observed after a 2-h incubation using Western blotting under these glucose conditions (Fig. 1Bii). This finding could suggest that surface Pgp had been internalized within the cell, leading to a decrease in plasma membrane Pgp levels. Such alterations in distribution are known to occur via a process of endocytosis for this protein and others (23–26). In contrast, after a 24-h incubation, the low and high glucose treatments led to significantly (p < 0.01) increased surface Pgp expression (Fig. 1D). This finding is consistent with the increase in whole cell Pgp expression observed after a 24-h incubation under these glucose concentrations using Western blotting (Fig. 1Bii).
To assess functional Pgp activity under these conditions, Rh123 was used, as it is a well known substrate of Pgp that is a reliable indicator of Pgp substrate transport efficacy out of cells (54). In this case it is well known that when cell surface Pgp expression is low, intracellular Rh123 retention is increased due to its reduced transport out of the cell (55). In these studies the decrease in cell surface Pgp levels observed after a 2-h incubation with low or high glucose (Fig. 1D) was reflected under these conditions by a significant (p < 0.001–0.01) increase in the cellular retention of Rh123 (Fig. 1E). In contrast, after a 24-h incubation the low and high glucose treatments led to significantly (p < 0.01–0.05) decreased cellular retention of Rh123 (Fig. 1E). This finding is consistent with the increase in whole cell Pgp expression (Fig. 1Bii) and also the increase in cell surface Pgp (Fig. 1D) observed after a 24-h incubation under these glucose concentrations, which led to increased Pgp transport activity (Fig. 1E).
Glucose Variation-induced Stress Increased Endocytosis of the Plasma Membrane
As described above, low or high glucose treatment rapidly increased the markers for early endosomes and lysosomes (Fig. 1C, i and ii), and this effect corresponded with a decrease in cell surface Pgp expression (Fig. 1D) and activity (Fig. 1E). Considering this, we next examined if these newly formed organelles were a result of endocytosis of the plasma membrane. To examine this, a classical marker for fluid-phase endocytosis, dextran uptake (56, 57), and a marker for receptor-mediated endocytosis, holo-transferrin uptake (58), were assessed.
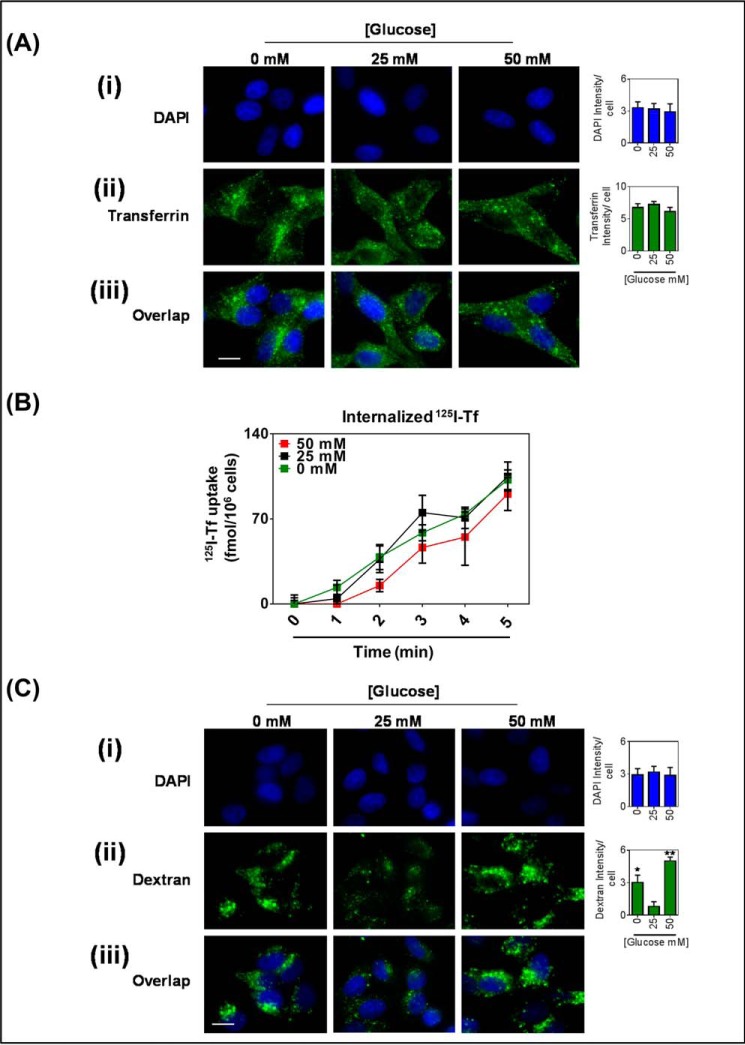
After incubating KBV1 (+Pgp) cells for 2 h with transferrin during low (0 mm) or high (50 mm) glucose levels, there was no significant (p > 0.05) change in total intensity of internal transferrin staining (Fig. 2, Aii). The punctate pattern of the transferrin staining indicates endosome formation (59, 60). In addition to this, the uptake of transferrin was also measured by internalization of 125I-transferrin. Similarly, after a 2-h treatment with low or high glucose, there was no significant (p > 0.05) change in the rate of uptake of transferrin over a 5-min time course (Fig. 2B) between all glucose treatments. Notably, the initial transferrin uptake was found to be linear over 5 min, as has previously been shown (23, 61). Collectively, our transferrin uptake studies indicate that glucose variation-induced stress does not stimulate transferrin receptor-mediated endocytosis.
FIGURE 2.
Glucose variation-induced stress increased fluid-phase endocytosis of the plasma membrane. KBV1 (+Pgp) cells incubated with low (0 mm), normal (25 mm), or high (50 mm) glucose for 2 h at 37 °C. A, immunofluorescence microscopy images of cells co-incubated with transferrin (25 μm). i, DAPI (blue); ii, transferrin (green); iii, merged image. B, internalized human iodine-125 labeled transferrin over a 5-min time course. C, immunofluorescence microscopy images of cells co-incubated with Alexa Fluor 488®-dextran (10 μm). i, DAPI (blue); ii, dextran (green); iii, merged image. DAPI, transferrin, and dextran were quantified as fluorescence intensity/cell using ImageJ software. *, p < 0.05 and **, p < 0.01, are relative to 25 mm glucose treated cells. Scale bar = 10 μm.
Next, Alexa Fluor 488®-dextran, a fluorescent marker of fluid-phase endocytosis, was assessed. In contrast to transferrin uptake, a 2-h incubation with low and high glucose significantly (p < 0.001–0.05) increased total cellular dextran intensity (Fig. 2C). Dextran staining also appeared granular, indicating the formation of endosomes and lysosomes (59). Therefore, these results suggest that glucose variation-induced stress stimulates fluid-phase endocytosis of the plasma membrane.
Glucose Variation-induced Stress Causes an Increase in Association of Pgp with the Early Endosomal Marker, EEA1, in Intracellular Vesicles
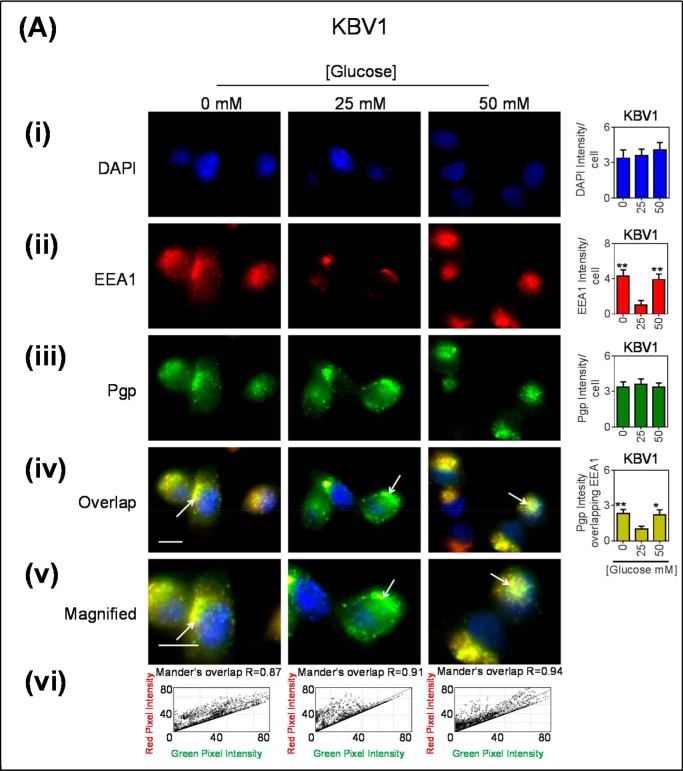
As the levels of the marker for early endosomes (EEA1) is rapidly increased after a 2-h incubation with low or high glucose levels (Fig. 1Ci) and this effect corresponds with increased fluid-phase endocytosis-mediated uptake of Dextran, we next examined if these potentially newly formed early endosomes contained Pgp. To examine this, the co-localization between EEA1 and Pgp was assessed by fluorescent microscopy (Fig. 3).
FIGURE 3.
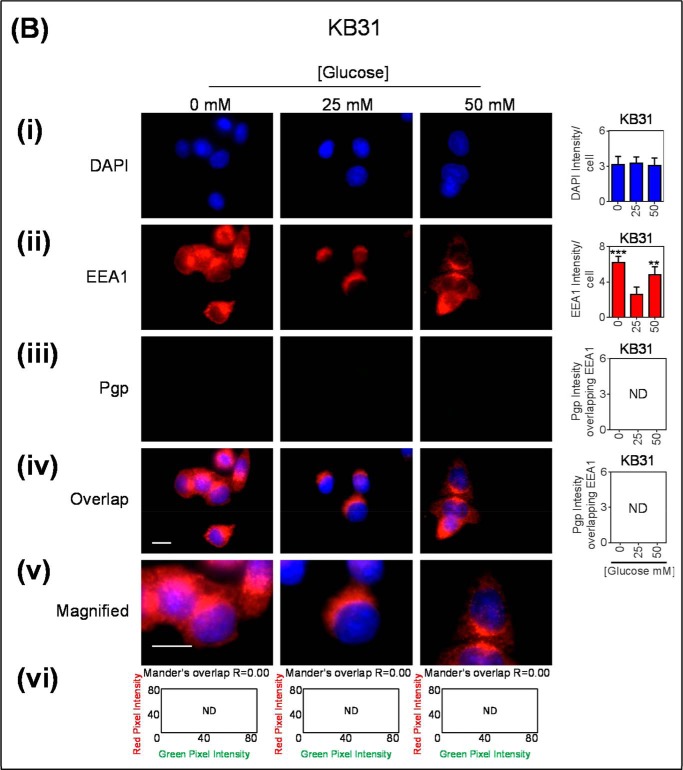
Co-localization of Pgp with EEA1-stained early endosomes increased after glucose variation-induced stress. Immunofluorescence microscopy images of KBV1 (+Pgp) (A) and KB31 (−Pgp) (B) cells incubated with low (0 mm), normal (25 mm), or high (50 mm) glucose for 2 h at 37 °C before staining with DAPI (blue) (i), EEA1 (red) (ii), and Pgp (green) (iii). Shown is overlay image of all three stains (iv) and a magnified image of the overlap (v). The overlap between EEA1 and Pgp is indicated by Mander's overlap co-efficient, R. DAPI, EEA1, and Pgp were quantified as fluorescence intensity/cell (vi). Pgp was also quantified as total Pgp fluorescence intensity co-localization with EEA1 using ImageJ software. *, p < 0.05; **, p < 0.01, and ***, p < 0.001 are relative to the respective 25 mm treated control glucose (e.g. 0 mm glucose KBV1 versus 25 mm glucose KBV1). Arrows indicate the co-localization of EEA1 with Pgp. Scale bar = 10 μm. ND stands for not detected.
After incubating KBV1 (+Pgp) cells for 2 h at 37 °C with low (0 mm) or high (50 mm) glucose levels, there was a pronounced and significant (p < 0.01) increase in total cellular EEA1 intensity relative to normal glucose (25 mm glucose; Fig. 3Aii). The EEA1 staining appeared granular, which is consistent with that of the intracellular vesicles of early endosomes (62, 63). This observation suggested a rapid increase in EEA1 expression, as described in Fig. 1Ci after a 2-h incubation. Moreover, these results are consistent with increased early endosome formation under glucose variation-induced stress. On the other hand, after a 2-h incubation, total cellular Pgp intensity did not markedly or significantly (p > 0.05) alter after glucose variation-induced stress relative to normal glucose (Fig. 3Aiii). This observation was also consistent with total cell Pgp expression after a 2-h incubation under the same conditions (Fig. 1Bii). To assess Pgp co-localization with the EEA1 marker, studies were performed to quantify the amount of Pgp (green) and EEA1 marker (red) merging within a cell, resulting in yellow fluorescence (Fig. 3Aiv). It was demonstrated that there was a significant (p < 0.01–0.05) increase in Pgp associated with EEA1 under glucose variation-induced stress (low or high glucose) as denoted by the yellow staining (Fig. 3Aiv). This appeared to be present within intracellular vesicles (Fig. 3Av), consistent with early endosomes (62). Notably, under all incubation conditions (0, 25, and 50 mm glucose), there was a high Mander's overlap co-efficient (R = 0.87–0.94) between EEA1 (red) and Pgp (green; Fig. 3Avi). Collectively, these results suggest that glucose variation-induced stress increases the formation of Pgp-bound within early endosomes.
These immunofluorescence studies above were also performed using the very low Pgp expressing counterpart of KBV1 (+Pgp) cells, namely KB31 (−Pgp) cells (21), to assess the effect of glucose variation-induced stress on EEA1 in the absence of high Pgp expression. As observed for KBV1 cells, EEA1 intensity was significantly (p < 0.001–0.01) increased with low and high glucose relative to normal glucose (Fig. 3Bii). In contrast, there was no Pgp detected under any incubation conditions in KB31 (−Pgp) cells (Fig. 3Biii) and, thus, no observed overlap with EEA1 (Fig. 3B, iv–vi).
Glucose Variation-induced Stress Caused an Increase in Association of Pgp with the Lysosomal Markers, LAMP2 and Cathepsin D, in Intracellular Vesicles
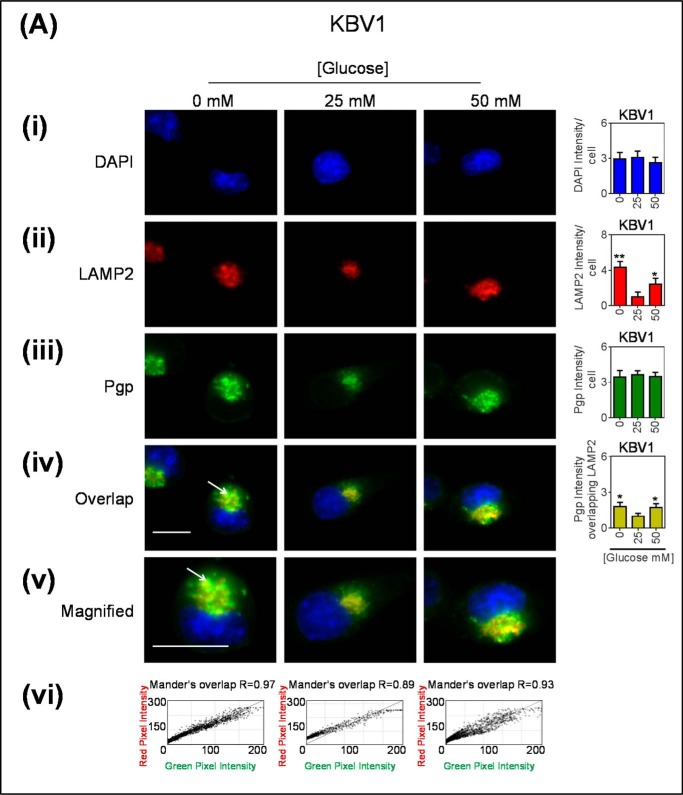
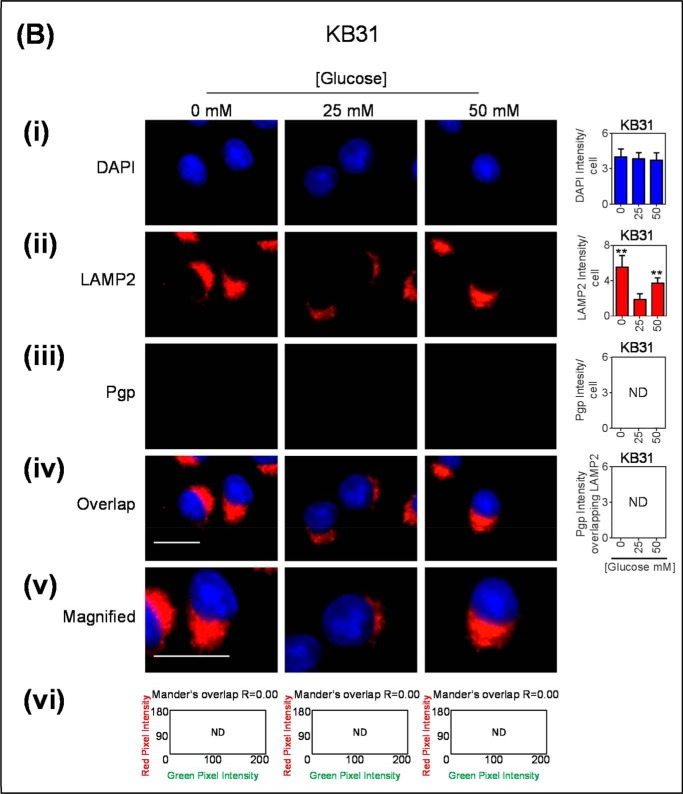
Considering that a certain proportion of early endosomes can mature into lysosomes (64), we next assessed if low or high glucose levels after a 2-h incubation could increase the number of lysosomes in the cell and if these lysosomes had Pgp (Fig. 4). As demonstrated with the EEA1 marker (Fig. 3Aii), a significant (p < 0.01–0.05) increase in total cellular LAMP2 intensity occurred with glucose variation-induced stress (Fig. 4Aii), whereas no change occurred in Pgp staining (Fig. 4Aiii). The LAMP2 staining appeared granular and was consistent with intracellular vesicles, which are indicative of late endosomes or lysosomes (7, 65). The observations demonstrating increased intracellular LAMP2 (Fig. 4Aii) are consistent with the total LAMP2 expression measured by Western analysis observed after a 2-h incubation under the same conditions (Fig. 1Cii). It was demonstrated that there was a significant (p < 0.05) increase in co-localization of Pgp associated with LAMP2 under glucose variation-induced stress relative to normal glucose (Fig. 4Aiv), and this Pgp appeared to be present within intracellular vesicles (Fig. 4Av). Notably, under all incubation conditions (0, 25, and 50 mm glucose), there was a high Mander's overlap co-efficient (R = 0.89–0.97) between LAMP2 (red) and Pgp (green; Fig. 4Avi).
FIGURE 4.
Glucose variation-induced stress increased the number of LAMP2-stained lysosomes that are co-localized with Pgp. Immunofluorescence microscopy images of KBV1 (+Pgp) (A) and KB31 (−Pgp) (B) cells incubated with low (0 mm), normal (25 mm), or high (50 mm) glucose for 2 h at 37 °C. Cells were stained for DAPI (blue) (i), LAMP2 (Red) (ii), and Pgp (green) (iii). iv, the merge of all three stains (overlap); v, a magnified image of the overlap. The overlap between Pgp and LAMP2 is indicated by Mander's overlap co-efficient, R. DAPI, LAMP2, and Pgp were quantified as fluorescence intensity/cell (vi). Pgp was also quantified as Pgp fluorescence intensity co-localizing with LAMP2 using ImageJ software. *, p < 0.05 and **, p < 0.01 are relative to the respective 25 mm treated control glucose (e.g. 0 mm glucose KBV1 versus 25 mm glucose KBV1). Arrows indicate the co-localization of LAMP2 with Pgp. Scale bar = 10 μm. ND stands for not detected.
As a relevant control, these immunofluorescence investigations were also performed using KB31 (−Pgp) cells to assess the effect of glucose variation-induced stress on LAMP2 in the absence of high Pgp expression (Fig. 4, B, i–vi). As described for KBV1 cells, LAMP2 intensity was markedly and significantly (p < 0.01) increased with glucose variation-induced stress in KB31 cells (Fig. 4Bii), whereas there was no Pgp detected in KB31 cells under any incubation conditions (Fig. 4Biii). Thus, there was no overlap between Pgp and LAMP2 in KB31 cells (Fig. 4B, iv and v).
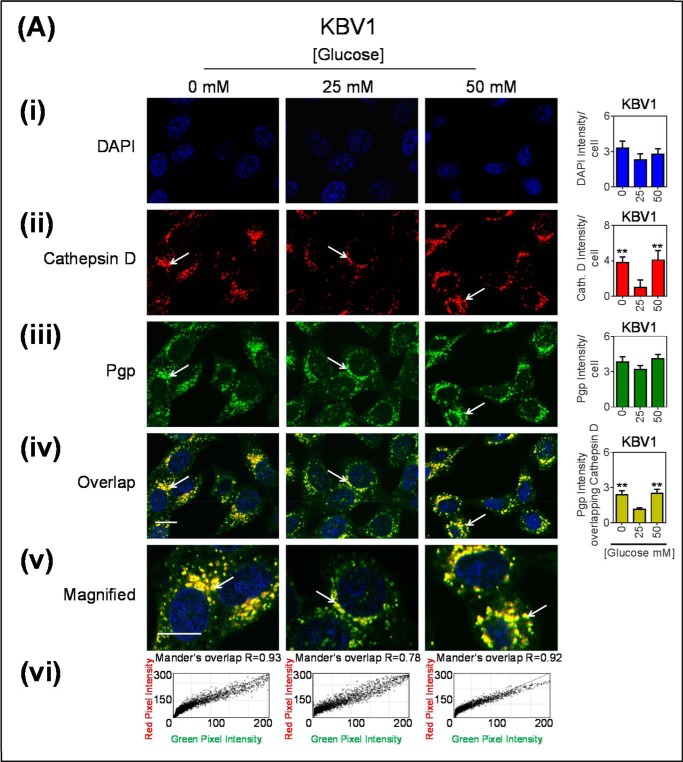
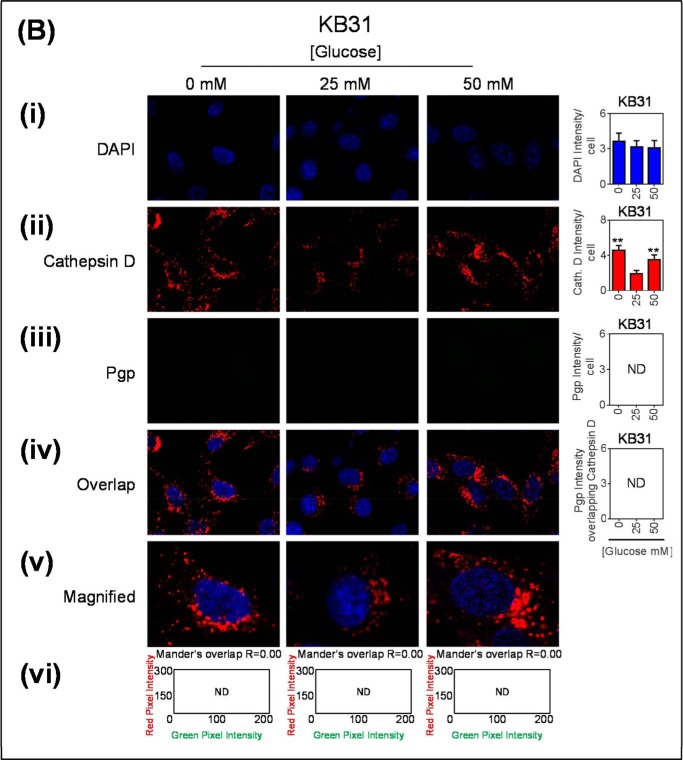
As LAMP2 is also present on late endosomes (65), and because this LAMP2 antibody can also detect both LAMP2a and LAMP2b, another marker for lysosomes, the lysosomal enzyme, cathepsin D (66), was used to validate lysosomal localization of Pgp (Fig. 5). To further support our findings of co-localization, these images were acquired using confocal microscopy. The arrows indicate areas of punctate staining suggesting co-localization between Pgp- and cathepsin D-stained lysosomes (Fig. 5A). As observed for both EEA1 and LAMP2 (Figs. 3 and 4), there was a significant (p < 0.01) increase in cathepsin D intensity during low and high glucose concentrations compared with normal glucose in KBV1 cells (Fig. 5Aii). This finding indicates an increase in the number of lysosomes. Again, there was no significant (p > 0.05) alteration in Pgp expression under this range of glucose concentrations (Fig. 5Aiii) after only a 2-h incubation (Fig. 5Aiii). This is in agreement with Fig. 1Bii.
FIGURE 5.
Glucose variation-induced stress increased the number of cathepsin D-stained lysosomes that are co-localized with Pgp. Confocal immunofluorescence microscopy images of KBV1 (+Pgp) (A) and KB31 (−Pgp) (B) cells incubated with low (0 mm), normal (25 mm), or high (50 mm) glucose for 2 h at 37 °C. Cells were stained for DAPI (blue) (i), cathepsin D (red) (ii), and Pgp (green) (iii). Shown is overlay image of all three stains (iv) and a magnified image of the overlap (v). The overlap between Pgp and cathepsin D is indicated by Mander's overlap co-efficient, R. DAPI, cathepsin D, and Pgp were quantified as fluorescence intensity/cell (vi). Pgp was also quantified as Pgp fluorescence intensity co-localizing with Cathepsin D using ImageJ software. **, p < 0.01 is relative to respective 25 mm treated control glucose (e.g. 0 mm glucose KBV1 versus 25 mm glucose KBV1). Arrows indicate the co-localization of cathepsin D with Pgp. Scale bar = 10 μm. ND stands for not detected.
As for EEA1 and LAMP2 (Figs. 2 and 3), it was demonstrated that there was also a significant (p < 0.01) increase in Pgp associated with cathepsin D under low and high glucose and that this appeared to be present within intracellular vesicles (Fig. 5, A, iv–v), consistent with lysosomes. Notably, under all incubation conditions (0, 25, and 50 mm glucose), there was a high Mander's overlap co-efficient (R = 0.78–0.93) between cathepsin D (red) and Pgp (green; Fig. 5Avi).
Together, these results suggest that glucose variation-induced stress increases the formation of lysosomes expressing Pgp. Again, analogous control studies using KB31 cells that express very low Pgp levels also demonstrated a significant increase (p < 0.01) in the cathepsin D intensity with low and high glucose (Fig. 5Bii) without any co-localization with Pgp (Fig. 5, B, iv–vi). This was due to the extremely low levels of Pgp in KB31 cells (Fig. 5Biii).
Glucose Variation-induced Stress Increased Accumulation of DOX in Lysosomes via the Active Lysosomal, Membrane-bound, Pgp Transporter
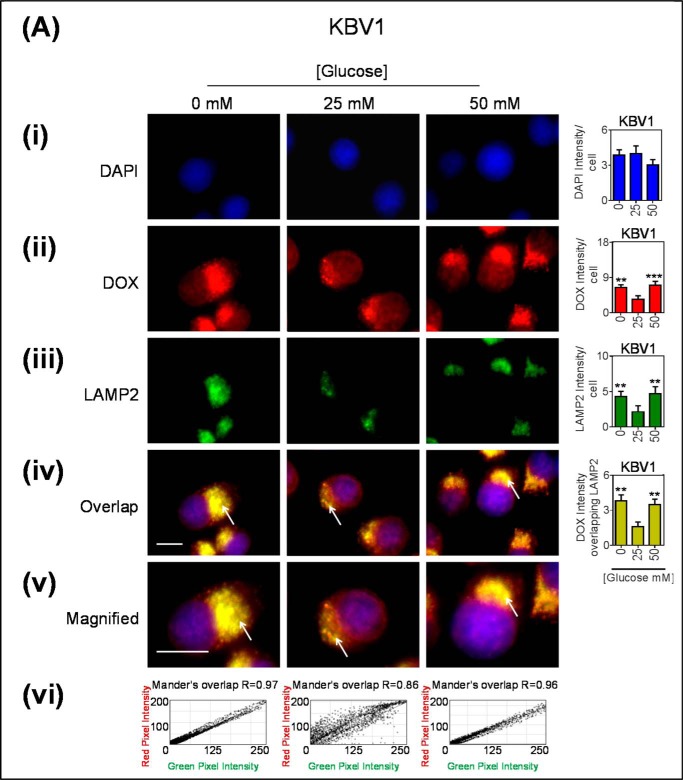
Considering that glucose variation-induced stress increased the formation of lysosomes containing Pgp (Figs. 3 and 4), we next examined if this lysosomal-bound Pgp was functional in terms of substrate transport. Immunofluorescence studies were performed with the classical Pgp-substrate and red fluorescent chemotherapeutic agent, DOX (7, 67). During endocytosis, the topology of Pgp will be inverted, as shown for other membrane proteins (68), leading to the transport of Pgp substrates into the lysosomal lumen (7, 12). Therefore, if Pgp is active it will transport substrates such as DOX (69) into the lysosomes from the cytosol. To observe the subcellular localization of DOX (which itself is fluorescent), cells were co-stained for both lysosomes (LAMP2) and a major intracellular target of DOX, namely the nucleus (DAPI; Fig. 6, A and B).
FIGURE 6.
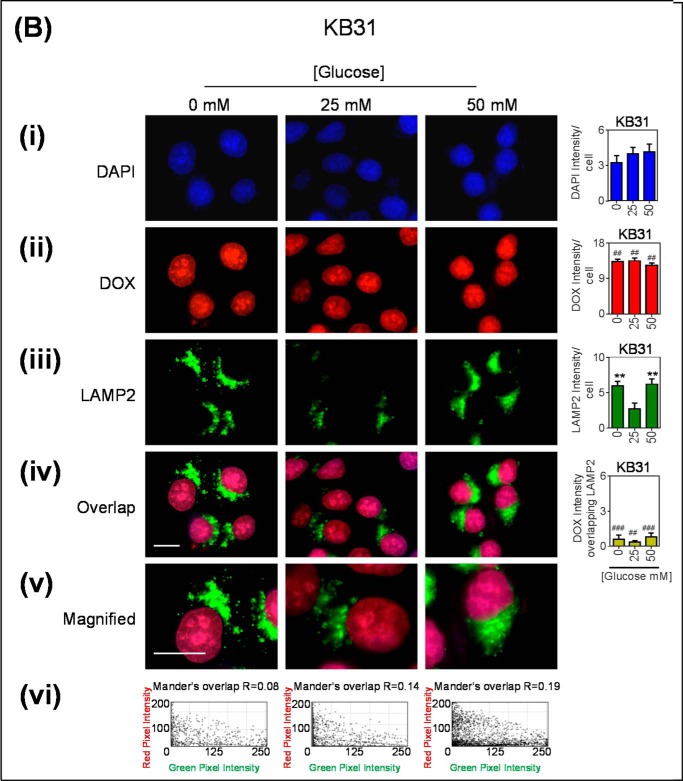
Glucose variation-induced stress increases DOX accumulation within lysosomes that possess functional Pgp. A, KBV1 (+Pgp) and (B) KB31 (−Pgp) cells were incubated for 2 h at 37 °C with low (0 mm), normal (25 mm), or high (50 mm) glucose before and during 40 min at 37 °C incubation with fluorescent DOX (100 μm). In all treatments cells were stained with DAPI (blue) (i), DOX (red) (ii), and LAMP2 (green) (iii). iv, the merge of all three stains (overlap); v, a magnified image of the overlap. The overlap between DOX and LAMP2 is indicated by Mander's overlap co-efficient, R. DAPI, DOX, and LAMP2 were quantified as fluorescence intensity/cell (vi). DOX was also quantified as intensity co-localizing with LAMP2 using ImageJ software. **, p < 0.01, and ***, p < 0.001 are relative to the respective 25 mm treated control glucose (e.g. 0 mm glucose KBV1 versus 25 mm glucose KBV1). ##, p < 0.01, and ###, p < 0.001 are relative to the respective glucose treatment (e.g. 0 mm glucose KBV1 versus 0 mm glucose KB31). The arrow indicates co-localization of DOX with LAMP2. Scale bar = 10 μm.
After incubating KBV1 (+Pgp) cells with either low (0 mm) or high (50 mm) glucose, there was a significant (p < 0.001–0.01) increase in the intensity of DOX (Fig. 6Aii) and LAMP2 (Fig. 6Aiii) compared with the respective glucose controls (25 mm). Moreover, it was demonstrated that there was a significant (p < 0.001) increase in the co-localization of DOX associated with LAMP2 under low or high glucose (Fig. 6Aiv). This co-localization appeared to be present within intracellular vesicles, namely LAMP2-stained lysosomes (see arrows; Fig. 6Av). Notably, under all incubation conditions (0, 25, and 50 mm glucose), there was a high Mander's overlap co-efficient (R = 0.86–0.97) between DOX (red) and LAMP2 (green; Fig. 6Avi). These results indicate that DOX accumulation within lysosomes is increased during glucose variation-induced stress. Notably, there was also some accumulation of DOX in the nucleus in KBV1 cells as indicated by the co-localization of DOX (red) and nuclear DAPI (blue), leading to purple nuclei in the overlap (Fig. 6A, iv and v).
To identify the extent to which Pgp activity is required for increasing lysosomal accumulation of DOX during glucose variation-induced stress, KB31 (−Pgp) cells were also assessed (Fig. 6B). In contrast to the increased intracellular DOX intensity during low and high glucose observed for KBV1 (+Pgp) cells (Fig. 6Aii), there was no significant (p > 0.05) difference observed in DOX intensity between all glucose treatments in KB31 (−Pgp) cells (Fig. 6Bii). However, notably, for all glucose treatments, the DOX intensity per cell was significantly (p < 0.01) higher in KB31 cells (Fig. 6Bii) relative to the respective glucose treatment in the KBV1 cells (Fig. 6Aii). This observation may be expected, as without Pgp, the efflux of DOX out of KB31 cells via plasma membrane-bound Pgp cannot occur (7).
Similar to the results shown in Fig. 4Bii for LAMP2, glucose variation-induced stress resulted in a significant (p < 0.001) increase in the intensity of LAMP2 compared with normal glucose for KB31 cells (Fig. 6Biii). This observation is consistent with an increase in lysosomal number. Contrary to the marked co-localization of DOX and LAMP2 that occurred in the KBV1 (+Pgp) cells under glucose variation-induced stress (Fig. 6A, iv–vi), this did not occur in KB31 (−Pgp) cells (Fig. 6B, iv–vi; Mander's overlap: R = 0.08–0.19; Fig. 6Bvi).
Interestingly, assessment of DOX localization in KB31 (−Pgp) cells indicated that it closely correlated with the nuclear DAPI staining (cf. Fig. 6, Bi to Bii). In contrast, in KBV1 (+Pgp) cells, DOX not only was present in the nuclei, but was also found in the cytoplasm, being closely correlated with lysosomal LAMP2 staining (Fig. 6A, i–vi). Hence, this observation was consistent with lysosomal-Pgp transporting DOX into this organelle in KBV1 (+Pgp) cells with some nuclear staining also, whereas in KB31 (−Pgp) cells DOX localized to the nucleus only.
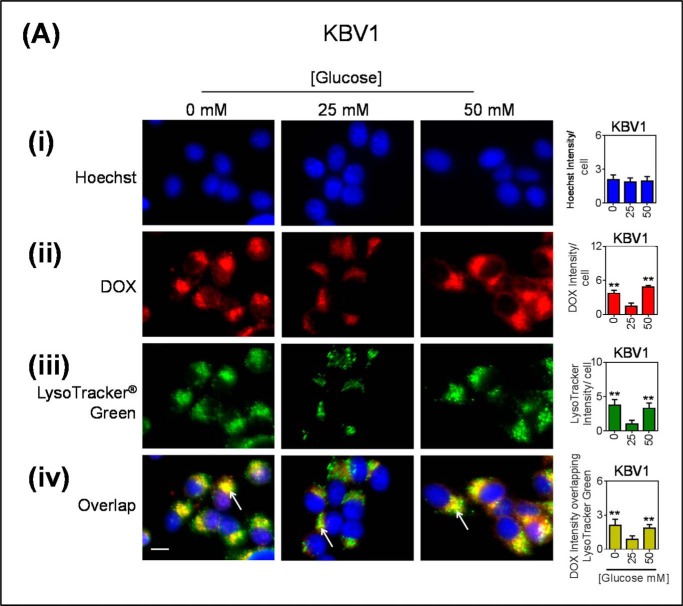
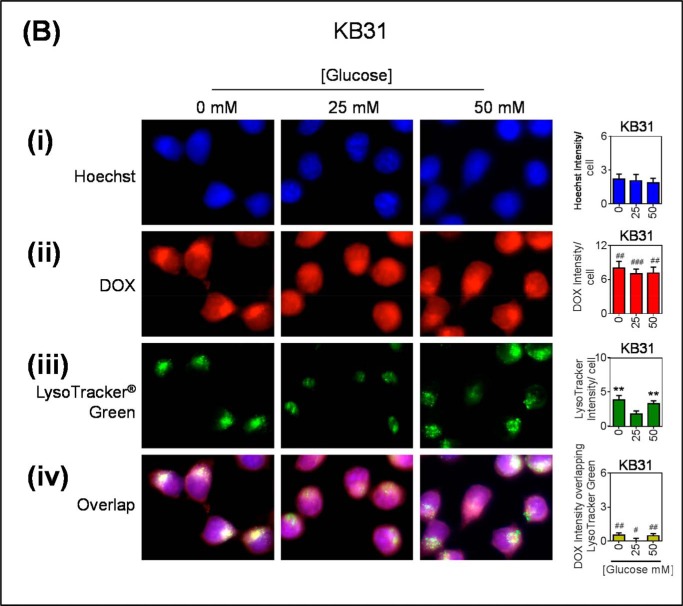
As the LAMP2 antibody can recognize two LAMP2 forms, including LAMP2a, which is involved in chaperone-mediated autophagy and is not a specific marker of generic lysosomes, the well established lysosomal marker, LysoTracker® Green, was also used. In these studies, DOX was again seen to co-localize to LysoTracker® Green-stained puncta, and this was greater in low and high glucose-treated cells (Fig. 7A). In KB31 cells, DOX appears to be distributed throughout both the nucleus and the cytoplasm (Fig. 7B). This is possibly a consequence of DOX competing with the Hoechst stain for the intercalation of DNA within the nucleus.
FIGURE 7.
Glucose variation-induced stress increases DOX accumulation within LysoTracker® green-stained lysosomes. KBV1 (+Pgp) (A) and KB31 (−Pgp) (B) cells were incubated for 2 h at 37 °C with low (0 mm), normal (25 mm), or high (50 mm) glucose before and during 40 min at 37 °C incubation with fluorescent DOX (100 μm), Hoechst (10 μm), and LysoTracker® Green (75 nm). In all treatments cells were visualized for the nucleus (blue; Hoechst stain) (i), DOX (red) (ii), lysosomes (LysoTracker® Green) (iii), and the merge of all three stains (overlap) (iv). Hoechst, DOX, and LysoTracker® Green were quantified as fluorescence intensity/cell. DOX was also quantified as intensity overlapping with LysoTracker® Green using ImageJ software. **, p < 0.01 is relative to the respective 25 mm treated control glucose (e.g. 0 mm glucose KBV1 versus 25 mm glucose KBV1). #, p < 0.05, ##, p < 0.01, and ###, p < 0.001 are relative to the respective glucose treatment (e.g. 0 mm glucose KBV1 versus 0 mm glucose KB31). The arrow indicates co-distribution of DOX with LysoTracker® Green. Scale bar = 10 μm.
Collectively, the results from Fig. 6 and Fig. 7 indicate the glucose variation-induced stress response results in functional Pgp in the LAMP2 lysosomal compartment of KBV1 cells (+Pgp) that can transport DOX into this organelle, whereas this effect was not observed for KB31 (−Pgp) cells.
Glucose Variation-induced Stress Enhanced the Pgp-dependent Thiosemicarbazone-mediated Permeabilization of Lysosomal Membranes
The thiosemicarbazone, Dp44mT, has been shown to cause selective cellular toxicity to Pgp-expressing MDR cells. Briefly, this mechanism involves the active transport of Dp44mT by Pgp found on the lysosomal membrane into the lysosomal lumen, where it will become protonated and trapped by the acidic pH (12, 13). Once trapped, Dp44mT will bind intra-lysosomal copper and redox cycle to form ROS, which damage and permeabilize the lysosome membrane, leading to apoptotic cell death (12, 13). Considering that glucose variation-induced stress was observed to increase the number of lysosomes with functional Pgp (Figs. 3–6), it was investigated if thiosemicarbazone-induced lysosomal damage can be enhanced by a change in glucose availability in KBV1 (+Pgp) cells.
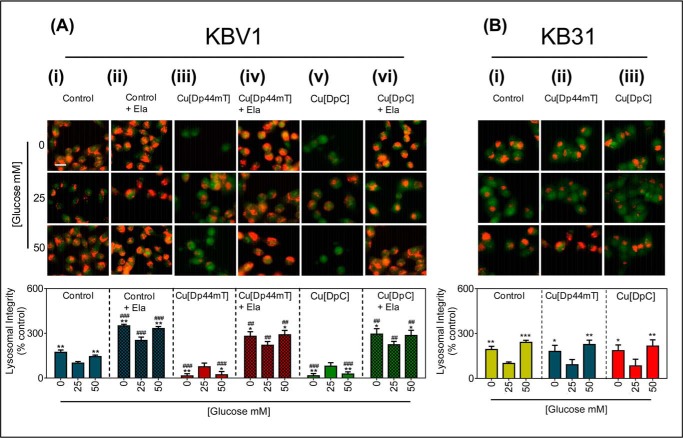
In these studies, the copper complexes of the thiosemicarbazones were used as they cause more rapid LMP than the ligand alone while still following the same mechanism of action as the ligands (12, 13). Lysosomal integrity was assessed using a classical lysosomal marker, AO (13, 70, 71). A decrease in AO red intensity is consistent with a loss of lysosomal integrity (13, 72). For the purpose of demonstrating if LMP can be enhanced by the treatment conditions in these studies, concentrations of Cu[DpC] and Cu[Dp44mT] with cells were especially selected (namely 10 and 20 μm, respectively) to ensure they were not toxic under the control (25 mm) glucose conditions over a 30-min incubation (Fig. 8).
FIGURE 8.
Glucose variation-induced stress potentiates LMP by Cu[Dp44mT] and Cu[DpC] via lysosomal-Pgp. A, KBV1 (+Pgp) cells were preincubated for 2 h at 37 °C with low (0 mm), normal (25 mm), or high (50 mm) glucose media and also during the final 30 min/37 °C treatment with media with 0, 25, or 50 mm glucose alone (i), Ela (0.2 μm) (ii), Cu[Dp44mT] (20 μm) (iii), Cu[Dp44mT] (20 μm) and Ela (0.2 μm) (iv), Cu[DpC] (10 μm) (v), or Cu[DpC] (10 μm) and Ela (0.2 μm) (vi). Cells were then stained with AO (5 μm, 12 min/37 °C). B, KB31 (−Pgp) cells were preincubated under the glucose conditions as in A and then incubated for the final 30 min/37 °C treatment with media with 0, 25, or 50 mm glucose alone(i), Cu[Dp44mT] (20 μm) (ii), or Cu[DpC] (10 μm) (iii). Cells were then stained with AO as in A. Lysosomal integrity was quantified as AO (red) fluorescence intensity (as a percentage of control (25 mm) glucose) using ImageJ software. Data are the mean ± S.D. of four independent experiments. *, p < 0.05; **, p < 0.01, and ***, p < 0.001 are relative to the respective normal (25 mm) glucose (e.g. KBV1 control 0 mm glucose versus KBV1 control 25 mm glucose). ##, p < 0.01, and ###, p < 0.001 are relative to respective control glucose treatments (e.g. KBV1 control + Ela 0 mm glucose versus KBV1 control 0 mm glucose). Scale bar = 10 μm.
Low (0 mm) and high (50 mm) glucose treatments caused a significant (p < 0.01) increase in the intensity of AO red staining compared with normal (25 mm) glucose (Fig. 8Ai) in KBV1 cells. This finding was consistent with the increase in lysosomal LAMP2 and cathepsin D staining (Fig. 3Aii and 4Aii, respectively), and collectively this evidence is indicative of an increase in the total number of lysosomes. After 2 h of glucose variation-induced stress, Cu[Dp44mT] (20 μm/30 min) or Cu[DpC] (10 μm/30 min) caused a significant (p < 0.01–0.05) decrease in AO red staining, indicating lysosomal membranes destabilization.
Next, to examine the role of Pgp in Cu[Dp44mT] or Cu[DpC] transport into lysosomes that is required for LMP and subsequent cell death, the specific Pgp inhibitor, Ela (0.2 μm), was utilized. The addition of Ela proportionally and significantly (p < 0.001) increased the AO red staining in all glucose treatments (Fig. 8Aii). Considering that AO has been reported to be transported by Pgp (73), the more intense overall AO staining in the presence of the Pgp inhibitor, Ela, may be explained by inhibition of AO efflux via Pgp. Ela markedly and significantly (p < 0.01) prevented the Cu[Dp44mT] or Cu[DpC]-induced lysosomal damage caused by low and high glucose conditions (cf. Fig. 8A, iii to iv). Therefore, these results indicate that Ela inhibited Pgp-mediated transport of Cu[Dp44mT] or Cu[DpC] into lysosomes, which in turn prevents damage and permeabilization of the lysosomal membrane.
The AO staining of cells preincubated with low or high glucose and treated with Cu[DpC] was also significantly (p < 0.01) decreased relative to cells preincubated with normal glucose and treated with Cu[DpC] (Fig. 8Av). This indicates Cu[DpC] also causes LMP at low and high glucose. There was no significant (p > 0.05) change in AO staining in Cu[DpC]-incubated control glucose cells (25 mm; Fig. 8Av) compared with the respective control glucose treatment (25 mm; Fig. 8Ai) under these conditions. Again, this lack of effect is because the concentration of Cu[DpC] (10 μm) has been specifically chosen under these incubation conditions not to result in LMP. Incubation of cells with Ela (0.2 μm) significantly (p < 0.01) prevented the Cu[DpC]-induced lysosomal damage at low and high glucose conditions (Fig. 8Avi), there being no significant (p > 0.05) change in AO red staining compared with the Ela-only respective control (Fig. 8Aii).
As a relevant control to KBV1 (+Pgp) cells, these investigations were also performed using the very low Pgp expressing counterpart, namely KB31 cells (Fig. 8B). This was done to assess if glucose variation-induced lysosome formation increases lysosomal damage (i.e. LMP) caused by Cu[Dp44mT] and Cu[DpC] irrespective of Pgp activity (Fig. 8B). Even though lysosomal formation was increased with glucose variation-induced stress in KB31 cells (Fig. 8Bi), no lysosomal damage (i.e. LMP) was observed with Cu[Dp44mT] or Cu[DpC] under all conditions (Fig. 8B, ii and iii). Collectively, these results (Fig. 8, A and B) demonstrate that glucose variation-induced lysosome formation increases the lysosomal damage (i.e. LMP) caused by Cu[Dp44mT] and Cu[DpC], and this effect is dependent on Pgp activity.
Glucose Variation-induced Stress Increased Pgp-mediated Resistance to DOX While Sensitizing MDR Cells to Thiosemicarbazones
The investigations above demonstrate for the first time that altering glucose levels to induce cellular stress results in both 1) the increased overall expression of Pgp (Fig. 1Bii) and 2) the increased expression of endosomal and lysosomal markers (Fig. 1C, i and ii) and the formation of lysosomes (Figs. 4–7) with functional Pgp (Figs. 6 and 7). Hence, it was next examined how these potential mechanisms of Pgp-mediated resistance affect the cellular toxicity of the chemotherapeutic agent and Pgp-substrate, DOX, under glucose-induced stress.
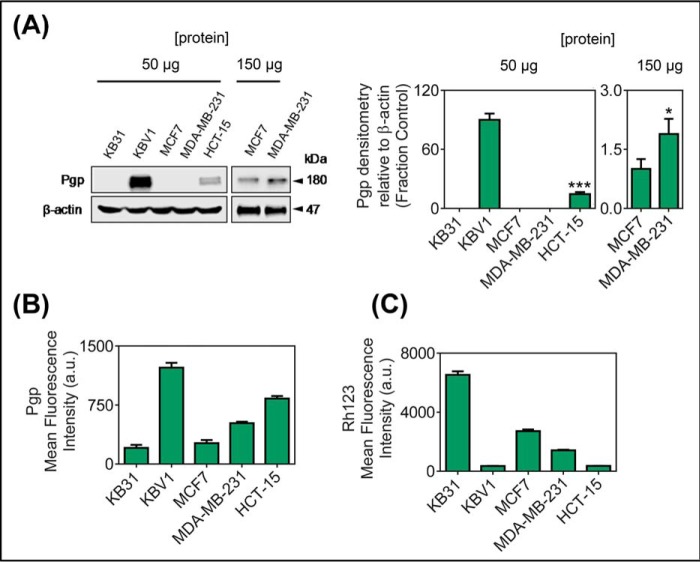
Initial studies examined the membrane Pgp levels and efflux function in a range of cell lines including the cervical carcinoma cell types KB31 (−Pgp) and KBV1 (+Pgp), breast cancer cell lines (MCF7 and MDA-MB-231), and the colon colorectal carcinoma cell line HCT-15 (Fig. 9). As shown previously (7, 12), Western blotting (at 50 μg of protein/lane) utilizing a membrane fraction from whole cells demonstrated that Pgp expression was only detected in KBV1 and HCT-15 cells, with the Pgp expression in HCT-15 cells being significantly (p < 0.001) less than that of KBV1 cells (Fig. 9A). On the other hand, and in agreement with our previous studies (7, 12), no Pgp expression in KB31 cells was observed using a protein load of 50 μg/lane (Fig. 9A) even when the protein loading was increased to 500 μg/lane (21). Furthermore, both MCF7 and MDA-MB-231 cells also showed no Pgp expression using protein loading of 50 μg/lane (Fig. 9A). However, using protein loading of 150 μg/lane, Pgp expression was observed in these later cell types and was significantly (p < 0.05) higher in MDA-MB-231 cells than MCF7 cells (Fig. 9A).
FIGURE 9.
Pgp protein expression (A and B) and function (C) in a panel of cervical, breast, and colorectal carcinoma cell lines. The cervical carcinoma cell lines KB31 (−Pgp) and KBV1 (+Pgp; 1 μg/ml vinblastine), the breast cancer cell lines, MCF7 and MDA-MB-231, and the colorectal carcinoma cell line, HCT-15, were assessed for Pgp protein expression by Western blotting (A), cell plasma membrane-Pgp expression measured by flow cytometry at 4 °C (B), and Pgp function analysis by flow cytometric measurement of the intracellular retention of Rh123 for 30 min/37 °C (C). Data are the mean ± S.D. of three independent experiments. ***, p < 0.001 is relative to KBV1 cells; *, p < 0.05, relative to MCF-7 cells. a.u., arbitrary units.
More sensitive flow cytometric detection of cell surface Pgp levels (Fig. 9B) confirmed the general trend in Pgp levels observed using Western blotting (Fig. 9A). However, the flow cytometric measurement also demonstrated the presence of very low but detectable levels of Pgp in KB31 cells (Fig. 9B). The transport activity of this Pgp was confirmed in all cell lines by measuring retention of the Pgp-substrate, Rh123 (Fig. 9C). Retention of Rh123 was marked in the cell types with the lowest Pgp levels (i.e. KB31 cells), as these cells cannot effectively transport this substrate out of the cell (Fig. 9C). In contrast, Rh123 retention was lowest in cells that express high levels of Pgp (i.e. KBV1 and HCT-15; Fig. 9C).
Next, cytotoxicity assays were performed to assess the effect of glucose variation-induced stress on the anti-tumor activity of the Pgp substrate, DOX (Fig. 10). Cells were preincubated for 2 h at 37 °C with low (0 mm) or high (50 mm) glucose, and these levels were maintained for the duration of the experiment. As deduced from our studies herein (Figs. 1–5), this protocol was performed to allow for pre-induction of endocytosis and lysosome formation and to initiate the up-regulation of Pgp expression. This preincubation was then followed by a 24-h incubation with Dp44mT or DpC. Due to the lower cytotoxic activity of DOX relative to Dp44mT or DpC and the very high Pgp expression in KBV1 cells (Fig. 9A), DOX treatment of all cell types was conducted over a 72-h incubation period to allow an IC50 value (i.e. the concentration required for 50% inhibition of cellular proliferation) to be calculated.
FIGURE 10.
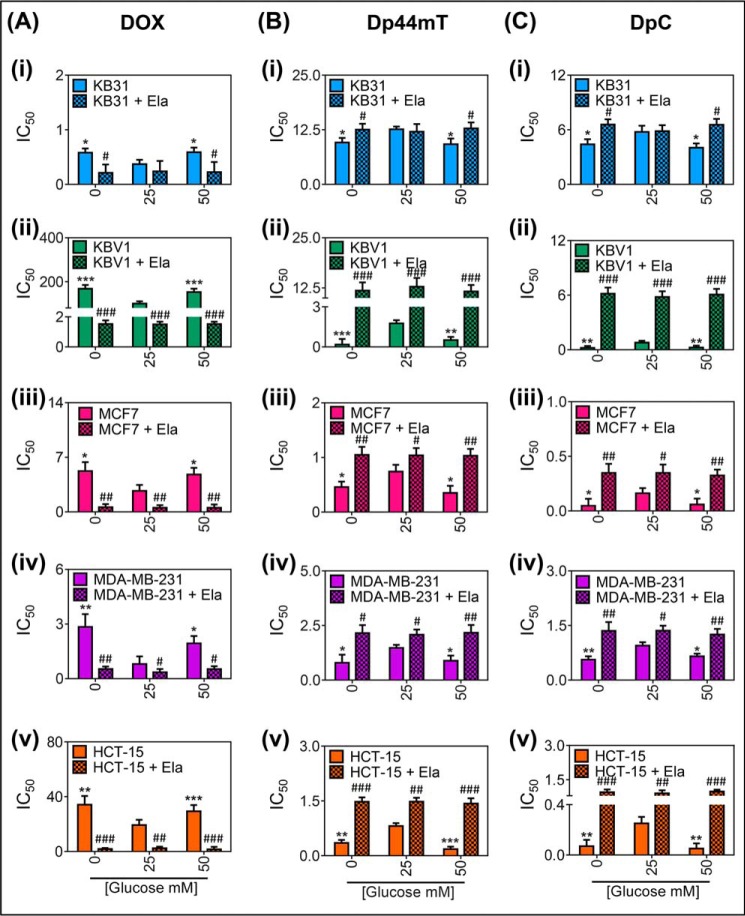
Glucose variation-induced stress increases Pgp-mediated cell resistance to DOX (A) while increasing cell sensitivity to Dp44mT (B) and DpC (C). MTT (3-(4,5-dimethylthiazol-2-yl)-2,5-diphenyltetrazolium bromide) assays measuring cellular toxicity of DOX (72 h at 37 °C) (A), Dp44mT (24 h at 37 °C) (B), or DpC (24 h at 37 °C) (C) in KB31 (i), KBV1 (ii), MCF7 (iii), MDA-MB-231 (iv), and HCT-15 cells (v) supplemented with low (0 mm), normal (25 mm), or high (50 mm) glucose medium for 2 h at 37 °C before and during drug treatment in the presence or absence of the Pgp inhibitor, Ela (0.2 μm), 30 min before and for the duration of DOX treatment. Results in A--C are the mean ± S.D. (n = 4). *, p < 0.05; **, p < 0.01, and ***, p < 0.001 are relative to normal glucose (25 mm); #, p < 0.05; ##, p < 0.01, and ###, p < 0.001 are relative to the respective control glucose treatments (e.g. KBV1 0 mm glucose versus KBV1 0 mm glucose + Ela).
In KB31 cells (which express very low Pgp levels), low and high glucose treatment caused a significant (p < 0.05) increase in the IC50 of DOX (i.e. the concentration required for 50% inhibition of cellular proliferation) compared with the control (25 mm) glucose levels (Fig. 10Ai). The role of Pgp was assessed by the Pgp inhibitor, Ela, which significantly (p < 0.05) reduced the IC50 of DOX at the low and high glucose treatment conditions to levels comparable with the control (i.e. 25 mm glucose; Fig. 10Ai). These results are consistent with the ability of these very low Pgp-expressing KB31 cells to induce increased Pgp expression under glucose stress and the efficacy of Ela in inhibiting Pgp activity (21). Importantly, incubation of KB31 cells with Ela under high and low glucose levels resulted in no significant (p > 0.05) difference in IC50 relative to the glucose control (i.e. 25 mm glucose; Fig. 10Ai). Hence, these results indicate the importance of increased Pgp expression in inhibiting DOX cytotoxicity in KB31 cells.
In KBV1 cells that possess high levels of Pgp expression and activity, low (0 mm) and high (50 mm) glucose treatments significantly (p < 0.001) increased the IC50 of DOX compared with the control glucose (25 mm; Fig. 10Aii). Moreover, Ela significantly (p < 0.001) reduced the DOX IC50 for all glucose treatments in KBV1 cells to similar levels as observed in the non Pgp-expressing KB31 cells (cf. Fig. 10A, i to ii). Notably, a significant (p < 0.001–0.05) increase in glucose stress-dependent DOX resistance was also observed in the MCF7, MDA-MB-231, and HCT-15 cell lines (Fig. 10A, iii–v). Glucose variation-induced DOX resistance was also found to be dependent on Pgp in these cell lines, as Ela significantly (p < 0.001–0.05) sensitized these cells to DOX treatment under all glucose concentrations (Fig. 10A, iii–v). Collectively, these data indicate that glucose levels regulate sensitivity of cancer cells to DOX via the activity of Pgp. This was most pronounced in KBV1 cells that expressed the highest Pgp levels and activity followed by HCT-15, MDA-MB-231, MCF7, and then KB31 cells (Figs. 9, A–C, 10A, i–v).
The mechanism of Dp44mT in overcoming MDR has been attributed to Pgp-mediated lysosomal accumulation whereby copper binding and redox cycling are responsible for inducing LMP and cell death (13, 74). Considering that glucose variation-induced stress increased lysosomal marker expression (Fig. 1Cii) and the formation of lysosomes with active Pgp (Figs. 4–7), we next assessed the anti-proliferative activity of Dp44mT and DpC after glucose variation treatment.
In clear contrast to the DOX results using KB31 cells (Fig. 10Ai), low and high glucose treatment caused a slight, but significant (p < 0.05) decrease in the IC50 of Dp44mT compared with the control (25 mm) glucose levels in KB31 cells (Fig. 10Bi). This was reversible in the presence of Ela, which significantly (p < 0.05) increased the IC50 of Dp44mT in the low and high glucose conditions to levels comparable with the control (Fig. 10Bi). These results indicate that by increasing Pgp expression and lysosome formation, glucose variation-induced stress increases cell sensitivity to Dp44mT.
Furthermore, using KBV1 cells, low and high glucose treatments markedly and significantly (p < 0.001–0.01) increased the sensitivity of cells to Dp44mT compared with the control (25 mm) glucose (Fig. 10Bii). Moreover, the effect of Pgp inhibition with Ela was significant (p < 0.001) for all glucose treatment conditions, reducing the toxicity of Dp44mTto similar levels as non-Pgp-expressing KB31 cells (Fig. 10B, i and ii). A significant (p < 0.001–0.05) glucose concentration-dependent increase in Dp44mT toxicity was also observed in MCF7, MDA-MB-231, and HCT-15 cells (Fig. 10B, iii–v). Furthermore, glucose-induced Dp44mT toxicity was also found to be dependent on Pgp expression in these cell lines, as Ela significantly (p < 0.001–0.05) increased resistance of these cells to Dp44mT (Fig. 10B, iii–v). The thiosemicarbazone, DpC, showed similar results to Dp44mT in all cell lines (Fig. 10C, i–v) both in the presence or absence of Ela. The effects of glucose variation-induced stress on potentiating the activity of both Dp44mT and DpC were most pronounced in KBV1 cells that highly express Pgp, but could also be detected in MCF7, MDA-MB-231, and HCT-15 cells, which express lower Pgp levels (Fig. 9, A–C), and also in the KB31 cells that endogenously express only very low Pgp levels.
Collectively, these data indicate glucose-variation increases the sensitivity of cancer cells to Dp44mT and DpC via the activity of Pgp. This effect was most pronounced for KBV1 cells that expressed the highest levels of Pgp.
Discussion
Tumor cells exist in a stressful microenvironment where crucial nutrients such as glucose and oxygen are heterogeneous (12, 28, 29). As a consequence of these stress stimuli, cancer cells are constantly adapting their metabolism to the tumor microenvironment (31). Endocytosis pathways have been described to play an important role in the internalization of nutrients, signal transduction regulation, and modulation of plasma membrane composition (25). Interestingly, stressors such as hydrogen peroxide have been shown to stimulate endocytosis (75, 76). For the first time, this investigation demonstrates that glucose variation-induced stress affects drug resistance through a mechanism consistent with subcellular redistribution of drug-resistant Pgp pumps from the cell surface to the lysosomal membrane by endocytosis.
It was demonstrated that as tumor cells become glucose-deprived or exposed to high glucose levels, there was an increase in expression of classical endosomal and lysosomal markers (i.e. EEA1 and LAMP2, respectively; Fig. 1C, i an ii) and also endosomes and lysosomes that co-localize with Pgp (Figs. 3 and 4). Lysosomal membrane Pgp likely serves to locally protect cells against intracellular insult from chemotherapeutics (7, 12, 68) and endogenous toxins. The glucose-induced intracellular Pgp resistance mechanism can also be utilized to overcome MDR by thiosemicarbazones such as Dp44mT and DpC that can utilize Pgp in the lysosomal compartment to increase lysosomal damage (12).
We previously demonstrated, under the same experimental conditions, that the generation of ROS by the mitochondria and NOX4 are important in up-regulating Pgp expression after glucose variation (21). Interestingly, the observed increase in HIF-1α in cells incubated with control media suggest that a low level of stress may be caused by the change in media alone. Herein, we observed that glucose-induced stress resulted in increased lysosome formation using a number of well characterized markers of this organelle, including LAMP2, cathepsin D, LysoTracker® Green, and AO (49, 50). Indeed, we observed an increase in dextran uptake, a marker for fluid-phase endocytosis (56, 57, 59). However, in marked contrast, the specific uptake of transferrin by receptor-mediated endocytosis was not affected, demonstrating a difference in the uptake mechanism. It is noteworthy that ROS have been shown to play a role in stimulating both fluid-phase (77) and receptor-mediated (22) endocytosis in a NOX-dependent manner.
As early endosomes are formed from the “budding off” from the plasma membrane into the cytoplasm of the cell (78), this process results in a topological inversion of the membrane and, as such, proteins that face the extracellular side of the plasma membrane ultimately end up facing the inside of endosomes and lysosomes (7, 12, 68). In Pgp-expressing cells, the lysosome markers, LAMP2 and cathepsin D, were shown to co-localize withPgp, indicating that the Pgp is bound to the lysosomal membrane (Figs. 4 and 5). The Pgp was shown to be important for the accumulation of the chemotherapeutic agent and Pgp-substrate, DOX, inside the acidic organelle, as the very low Pgp-expressing KB31 cells demonstrated no lysosomal uptake and trapping of DOX, and this increased its targeting of the nucleus (Fig. 6, A and B).
The increase in endosome and lysosome formation after glucose variation-induced stress led to even greater lysosomal DOX accumulation (Fig. 6A). This was also found to be Pgp-dependent, as the non-P-gp expressing KB31 cells had no lysosomal DOX accumulation (Fig. 6B). This increase in DOX trapping within lysosomes by glucose variation-induced stress translated into greater cell resistance to DOX (Fig. 10A). This effect was again confirmed to be Pgp-dependent, as Pgp inhibition by Ela increased the cytotoxicity of DOX in four different cell-types with the response being greatest in cells expressing the highest Pgp levels (Fig. 10A).
Interestingly, in contrast to DOX, the novel thiosemicarbazone, Dp44mT, has been demonstrated to be more potent and selective toward MDR-resistant tumors (11, 12). This observation has been demonstrated to be due to sequestration of the Pgp substrate, Dp44mT, into lysosomes by the transport activity of lysosomal-Pgp, where it becomes trapped by protonation followed by the redox cycling of its copper complex which causes LMP and cell death (12, 13). Herein, we demonstrate that by increasing cellular lysosomal content with functional Pgp via glucose-induced stress, disruption of lysosomal integrity is enhanced by Dp44mT and another thiosemicarbazone with similar structural properties, namely DpC (Figs. 8 and 10). In fact, this effect is markedly enhanced in cells highly expressing Pgp e.g. KBV1 and HCT-15 cells (Fig. 10, B, ii and v, and C, ii and v).
These results also demonstrated that Pgp activity is necessary for the glucose-potentiated LMP activity of the thiosemicarbazones Dp44mT and DpC, as the Pgp inhibitor, Ela, prevented LMP during low and high glucose treatments. These results are consistent with studies that have shown that for thiosemicarbazones to have selective toxicity to Pgp-expressing cells, they are required to: 1) be taken up into lysosomes by Pgp, 2) become protonated within the acidic lysosomal environment, which prevents them from transversing lysosomal membranes, 3) bind to copper for metal redox cycling activity, and 4) generate ROS that permeabilizes the lysosomal membrane (12–14).
The increase in LMP by thiosemicarbazones during glucose variation-induced stress translated into a significant increase in the sensitivity of Pgp-expressing cells to thiosemicarbazone treatment (Fig. 10, B and C). This effect was found to be Pgp-dependent, as Ela markedly reduced cytotoxicity of both Dp44mT and DpC (Fig. 10, B and C). Hence, these studies highlight the rapid formation of intracellular MDR within the tumor cell in response to a change in glucose levels. It is important to note that other cellular stressors, such as hypoxia, serum deprivation, and hydrogen peroxide, have also resulted in the same endocytic response with regard to Pgp and LAMP2 co-localization in endosome-like puncta (data not shown). Hence, the effect of glucose modulation demonstrated in the current investigation reflects a generalized stress response of the cell rather than an effect that is specific for glucose alteration alone. This increased endocytic response to stress that stimulates lysosomal biogenesis may promote cellular resistance to many classical chemotherapeutic agents, such as DOX (7). In contrast, this mechanism increases Dp44mT and DpC activity, which utilizes lysosomal Pgp to induce LMP and tumor cell death (Fig. 8A).
Considering the important intracellular degradative role of autophagy as an adaptive response to stress, the role of stress-induced autophagy would be interesting to further investigate within this system. However, as this is a very complex system, such analyses remained well beyond the scope of these studies. Interestingly, the link between glucose starvation and the promotion of autophagy remains controversial. Although some studies indicate that glucose limitation promotes autophagy, other more recent reports demonstrate that basal autophagic flux becomes inhibited (80, 81). Moreover, studies that have examined the inhibition of autophagy indicate that it does not protect cells undergoing necrosis or apoptosis upon glucose deprivation (80, 81). Therefore, although autophagy may have an important role in the degradation of intracellular particles during conditions of stress, it is likely that the endocytic process observed in these studies plays a more central role in delivering Pgp to lysosomal membranes rather than the autophagic apparatus. Moreover, the increased co-localization of Pgp with EEA1 observed in this study in response to glucose stress (see Fig. 3) further supports the lack of involvement of plasma membrane-dependent autophagosome formation in Pgp internalization into endosome-like vesicles.
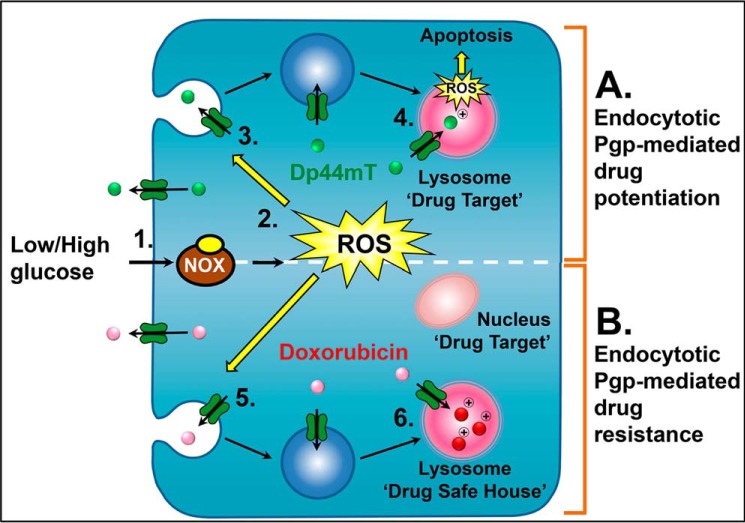
In conclusion, this investigation for the first time demonstrates a mechanism of intracellular MDR that is enhanced after glucose-induced stress. In response to stress, cells rapidly form lysosomes by the budding of endosomes from the plasma membrane during endocytosis (Fig. 11, A and B). A certain proportion of these endosomes mature into lysosomes containing Pgp that remains active and capable of transporting substrates. Herein, it was demonstrated that thiosemicarbazones can utilize their novel mechanism of utilizing lysosomes to target these newly formed lysosomes and cause enhanced toxicity to drug-resistant cells exposed to stress, such as glucose variation (Fig. 11A). In contrast, cells can utilize these newly formed lysosomes as drug safe houses by actively sequestering toxic agents, such as DOX, into the organelle lumen (Fig. 11B). The crucial difference between DOX and the DpT thiosemicarbazones (i.e. Dp44mT and DpC) is that the latter bind copper within the lysosome to form potently redox active complexes which generate ROS that induces LMP, whereas DOX does not do this (7, 68). Therefore, this novel mechanism involving Pgp translocation from the plasma membrane to the lysosomal membrane in the stressful tumor micro-environment is an important consideration for cancer treatment and for new cytotoxic drug development strategies targeting the lysosomal compartment.
FIGURE 11.
Schematic illustration of glucose variation-induced stress resulting in endocytotic Pgp-mediated potentiation of sensitivity to the thiosemicarbazones (Dp44mT and DpC) via increased lysosomal membrane permeabilization (targeting of lysosomal Pgp mechanism) (A) and glucose variation-induced stress leading to endocytotic Pgp-mediated drug resistance mediated by lysosomal sequestration of DOX (safe house mechanism) (B). 1, within the tumor environment cells are exposed to spatial and temporal changes in glucose availability leading to stress (28, 29, 79). 2, this stimulates the production of ROS by both the NOX4 and the mitochondrial electron transport chain (21). 3, these ROS stimulate endocytosis of the plasma membrane to form endosomes. 4, endocytosis increases the number of lysosomes with functional Pgp. These organelles can actively sequester Pgp substrates such as the thiosemicarbazones, Dp44mT and DpC, into the organelle, where they become protonated and trapped (12, 13). Once trapped, the thiosemicarbazones then bind intra-lysosomal copper and redox cycle to form ROS, which damage and permeabilize the lysosome membrane, leading to apoptosis (12–14). Consequently, glucose variation sensitizes the cell to thiosemicarbazones. 5, in contrast, newly formed endosomes and lysosomes from glucose variation-induced stress will also sequester agents that are weakly basic Pgp substrates, such as DOX. 6, within the lysosome, DOX will become charged and trapped (7). As DOX does not markedly redox cycle like Dp44mT, the lysosome will act as a drug safe house (7). This will prevent DOX reaching its intracellular target, the nucleus. Consequently, unlike the situation with Dp44mT and DpC, glucose variation-induced stress common in the tumor microenvironment will decrease the anti-tumor efficacy of agents like DOX.
Author Contributions
N. A. S., D. J. R. L., P. J. J., and D. R. R. designed the experiments and wrote manuscript. N. A. S, D. J. R. L., and P. J. J. performed the experiments.
Acknowledgments
We acknowledge the Bosch Institute Flow Cytometry Unit and Advanced Microscopy Facility (University of Sydney) for access to their facilities and use of the Zeiss Axiovision software. We thank Dr. Parvin Ataie (University of New South Wales), Dr. Michael Huang, Dr. Hiu Lok, Dr. Danuta Kalinowski, Dr. Angelica Merlot, Dr. Vera Richardson, and Dr. Sumit Sahni (Molecular Pharmacology and Pathology Program, Department of Pathology and Bosch Institute) for careful assessment of the manuscript before submission. We also thank Leyla Fouani (Molecular Pharmacology and Pathology Program, Department of Pathology and Bosch Institute) and Dr. Louise Cole from the Bosch Institute Advanced Microscopy Facility at the University of Sydney for kindly offering advice and assistance for microscopy image acquisition and co-localization analysis.
D. R. Richardson is a stakeholder in the companies Oncochel Therapeutics LLC and Oncochel Therapeutics Pty Ltd, which are developing the thiosemicarbazone DpC for the treatment of cancer. D. R. Richardson also consults for Oncochel Therapeutics LLC and Pty Ltd.
- MDR
- multidrug resistance
- Pgp
- P-glycoprotein
- AO
- acridine orange
- Dp44mT
- di-2-pyridylketone 4,4-dimethyl-3-thiosemicarbazone
- DpC
- di-2-pyridylketone 4-cyclohexyl-4-methyl-3-thiosemicarbazone
- Cu[Dp44mT]
- copper complex of Dp44mT
- Cu[DpC]
- copper complex of DpC
- DOX
- doxorubicin
- EEA1
- early endosomal antigen 1
- Ela
- elacridar
- HIF-1α
- hypoxia inducible factor 1
- LAMP2
- lysosomal-associated membrane protein-2
- LMP
- lysosomal-membrane permeabilization
- NOX4
- NADPH oxidase-4
- Rh123
- rhodamine-123
- ROS
- reactive oxygen species.
References
- 1. Holohan C., Van Schaeybroeck S., Longley D. B., and Johnston P. G. (2013) Cancer drug resistance: an evolving paradigm. Nat. Rev. Cancer 13, 714–726 [DOI] [PubMed] [Google Scholar]
- 2. Longley D. B., and Johnston P. G. (2005) Molecular mechanisms of drug resistance. J. Pathol. 205, 275–292 [DOI] [PubMed] [Google Scholar]
- 3. Eckford P. D., and Sharom F. J. (2009) ABC efflux pump-based resistance to chemotherapy drugs. Chem. Rev. 109, 2989–3011 [DOI] [PubMed] [Google Scholar]
- 4. Sharom F. J. (2006) Multidrug resistance protein: p-glycoprotein. In Drug Transporters, pp. 223–262, John Wiley & Sons, New York [Google Scholar]
- 5. Milane L., Duan Z., and Amiji M. (2011) Role of hypoxia and glycolysis in the development of multi-drug resistance in human tumor cells and the establishment of an orthotopic multi-drug resistant tumor model in nude mice using hypoxic pre-conditioning. Cancer Cell Int. 11, 3. [DOI] [PMC free article] [PubMed] [Google Scholar]
- 6. Kartner N., and Ling V. (1989) Multidrug resistance in cancer. Sci. Am. 260, 44–51 [DOI] [PubMed] [Google Scholar]
- 7. Yamagishi T., Sahni S., Sharp D. M., Arvind A., Jansson P. J., and Richardson D. R. (2013) P-glycoprotein mediates drug resistance via a novel mechanism involving lysosomal sequestration. J. Biol. Chem. 288, 31761–31771 [DOI] [PMC free article] [PubMed] [Google Scholar]
- 8. Ludwig J. A., Szakács G., Martin S. E., Chu B. F., Cardarelli C., Sauna Z. E., Caplen N. J., Fales H. M., Ambudkar S. V., Weinstein J. N., and Gottesman M. M. (2006) Selective toxicity of NSC73306 in MDR1-positive cells as a new strategy to circumvent multidrug resistance in cancer. Cancer Res. 66, 4808–4815 [DOI] [PMC free article] [PubMed] [Google Scholar]
- 9. Heffeter P., Jakupec M. A., Körner W., Chiba P., Pirker C., Dornetshuber R., Elbling L., Sutterlüty H., Micksche M., Keppler B. K., and Berger W. (2007) Multidrug-resistant cancer cells are preferential targets of the new antineoplastic lanthanum compound KP772 (FFC24). Biochem. Pharmacol. 73, 1873–1886 [DOI] [PMC free article] [PubMed] [Google Scholar]
- 10. Heffeter P., Jakupec M. A., Körner W., Wild S., von Keyserlingk N. G., Elbling L., Zorbas H., Korynevska A., Knasmüller S., Sutterlüty H., Micksche M., Keppler B. K., and Berger W. (2006) Anticancer activity of the lanthanum compound [tris(1,10-phenanthroline)lanthanum(III)]trithiocyanate (KP772; FFC24). Biochem. Pharmacol. 71, 426–440 [DOI] [PubMed] [Google Scholar]
- 11. Whitnall M., Howard J., Ponka P., and Richardson D. R. (2006) A class of iron chelators with a wide spectrum of potent antitumor activity that overcomes resistance to chemotherapeutics. Proc. Natl. Acad. Sci. U.S.A. 103, 14901–14906 [DOI] [PMC free article] [PubMed] [Google Scholar]
- 12. Jansson P. J., Yamagishi T., Arvind A., Seebacher N., Gutierrez E., Stacy A., Maleki S., Sharp D., Sahni S., and Richardson D. R. (2015) Di-2-pyridylketone 4,4-dimethyl-3-thiosemicarbazone (Dp44mT) overcomes multidrug resistance by a novel mechanism involving the hijacking of lysosomal P-glycoprotein (Pgp). J. Biol. Chem. 290, 9588–9603 [DOI] [PMC free article] [PubMed] [Google Scholar]
- 13. Lovejoy D. B., Jansson P. J., Brunk U. T., Wong J., Ponka P., and Richardson D. R. (2011) Antitumor activity of metal-chelating compound Dp44mT is mediated by formation of a redox-active copper complex that accumulates in lysosomes. Cancer Res. 71, 5871–5880 [DOI] [PubMed] [Google Scholar]
- 14. Jansson P. J., Hawkins C. L., Lovejoy D. B., and Richardson D. R. (2010) The iron complex of Dp44mT is redox-active and induces hydroxyl radical formation: an EPR study. J. Inorg. Biochem. 104, 1224–1228 [DOI] [PubMed] [Google Scholar]
- 15. Lovejoy D. B., Sharp D. M., Seebacher N., Obeidy P., Prichard T., Stefani C., Basha M. T., Sharpe P. C., Jansson P. J., Kalinowski D. S., Bernhardt P. V., and Richardson D. R. (2012) Novel second-generation di-2-pyridylketone thiosemicarbazones show synergism with standard chemotherapeutics and demonstrate potent activity against lung cancer xenografts after oral and intravenous administration in vivo. J. Med. Chem. 55, 7230–7244 [DOI] [PubMed] [Google Scholar]
- 16. Kovacevic Z., Chikhani S., Lovejoy D. B., and Richardson D. R. (2011) Novel thiosemicarbazone iron chelators induce up-regulation and phosphorylation of the metastasis suppressor N-myc down-stream regulated gene 1: a new strategy for the treatment of pancreatic cancer. Mol. Pharmacol. 80, 598–609 [DOI] [PubMed] [Google Scholar]
- 17. Chen Z., Zhang D., Yue F., Zheng M., Kovacevic Z., and Richardson D. R. (2012) The iron chelators Dp44mT and DFO inhibit TGF-β-induced epithelial-mesenchymal transition via up-regulation of N-Myc downstream-regulated gene 1 (NDRG1). J. Biol. Chem. 287, 17016–17028 [DOI] [PMC free article] [PubMed] [Google Scholar]
- 18. Liu W., Xing F., Iiizumi-Gairani M., Okuda H., Watabe M., Pai S. K., Pandey P. R., Hirota S., Kobayashi A., Mo Y. Y., Fukuda K., Li Y., and Watabe K. (2012) N-myc downstream regulated gene 1 modulates Wnt-β-catenin signalling and pleiotropically suppresses metastasis. EMBO Mol. Med. 4, 93–108 [DOI] [PMC free article] [PubMed] [Google Scholar]
- 19. Sun J., Zhang D., Zheng Y., Zhao Q., Zheng M., Kovacevic Z., and Richardson D. R. (2013) Targeting the metastasis suppressor, NDRG1, using novel iron chelators: regulation of stress fiber-mediated tumor cell migration via modulation of the ROCK1/pMLC2 signaling pathway. Mol. Pharmacol. 83, 454–469 [DOI] [PubMed] [Google Scholar]
- 20. Wang J., Yin D., Xie C., Zheng T., Liang Y., Hong X., Lu Z., Song X., Song R., Yang H., Sun B., Bhatta N., Meng X., Pan S., Jiang H., and Liu L. (2014) The iron chelator Dp44mT inhibits hepatocellular carcinoma metastasis via N-Myc downstream-regulated gene 2 (NDRG2)/gp130/STAT3 pathway. Oncotarget 5, 8478–8491 [DOI] [PMC free article] [PubMed] [Google Scholar]
- 21. Seebacher N. A., Richardson D. R., and Jansson P. J. (2015) Glucose modulation induces reactive oxygen species and increases P-glycoprotein-mediated multidrug resistance to chemotherapeutics. Br. J. Pharmacol. 172, 2557–2572 [DOI] [PMC free article] [PubMed] [Google Scholar]
- 22. Li Q., Harraz M. M., Zhou W., Zhang L. N., Ding W., Zhang Y., Eggleston T., Yeaman C., Banfi B., and Engelhardt J. F. (2006) Nox2 and Rac1 regulate H2O2-dependent recruitment of TRAF6 to endosomal interleukin-1 receptor complexes. Mol. Cell. Biol. 26, 140–154 [DOI] [PMC free article] [PubMed] [Google Scholar]
- 23. Iacopetta B. J., and Morgan E. H. (1983) The kinetics of transferrin endocytosis and iron uptake from transferrin in rabbit reticulocytes. J. Biol. Chem. 258, 9108–9115 [PubMed] [Google Scholar]
- 24. Nemeth E., Tuttle M. S., Powelson J., Vaughn M. B., Donovan A., Ward D. M., Ganz T., and Kaplan J. (2004) Hepcidin regulates cellular iron efflux by binding to ferroportin and inducing its internalization. Science 306, 2090–2093 [DOI] [PubMed] [Google Scholar]
- 25. Aguilar R. C., and Wendland B. (2005) Endocytosis of membrane receptors: two pathways are better than one. Proc. Natl. Acad. Sci. U.S.A. 102, 2679–2680 [DOI] [PMC free article] [PubMed] [Google Scholar]
- 26. Goh L. K., and Sorkin A. (2013) Endocytosis of receptor-tyrosine kinases. Cold Spring Harb. Perspect. Biol. 5, a017459. [DOI] [PMC free article] [PubMed] [Google Scholar]
- 27. Vega V. L., Charles W., and De Maio A. (2010) A new feature of the stress response: increase in endocytosis mediated by Hsp70. Cell Stress Chaperones 15, 517–527 [DOI] [PMC free article] [PubMed] [Google Scholar]
- 28. Pelicano H., Martin D. S., Xu R. H., and Huang P. (2006) Glycolysis inhibition for anticancer treatment. Oncogene 25, 4633–4646 [DOI] [PubMed] [Google Scholar]
- 29. Annibaldi A., and Widmann C. (2010) Glucose metabolism in cancer cells. Curr. Opin. Clin. Nutr. Metab. Care 13, 466–470 [DOI] [PubMed] [Google Scholar]
- 30. Junttila M. R., and de Sauvage F. J. (2013) Influence of tumour micro-environment heterogeneity on therapeutic response. Nature 501, 346–354 [DOI] [PubMed] [Google Scholar]
- 31. Wek R. C., and Staschke K. A. (2010) How do tumours adapt to nutrient stress? EMBO J. 29, 1946–1947 [DOI] [PMC free article] [PubMed] [Google Scholar]
- 32. Shen D. W., Cardarelli C., Hwang J., Cornwell M., Richert N., Ishii S., Pastan I., and Gottesman M. M. (1986) Multiple drug-resistant human KB carcinoma cells independently selected for high-level resistance to colchicine, adriamycin, or vinblastine show changes in expression of specific proteins. J. Biol. Chem. 261, 7762–7770 [PubMed] [Google Scholar]
- 33. Richardson D. R., Tran E. H., and Ponka P. (1995) The potential of iron chelators of the pyridoxal isonicotinoyl hydrazone class as effective antiproliferative agents. Blood 86, 4295–4306 [PubMed] [Google Scholar]
- 34. Zhong D., Liu X., Khuri F. R., Sun S.-Y., Vertino P. M., and Zhou W. (2008) LKB1 Is necessary for Akt-mediated phosphorylation of proapoptotic proteins. Cancer Res. 68, 7270–7277 [DOI] [PMC free article] [PubMed] [Google Scholar]
- 35. Richardson D. R., and Baker E. (1990) The uptake of iron and transferrin by the human malignant melanoma cell. Biochim. Biophys. Acta 1053, 1–12 [DOI] [PubMed] [Google Scholar]
- 36. Richardson D., and Baker E. (1992) Two mechanisms of iron uptake from transferrin by melanoma cells. The effect of desferrioxamine and ferric ammonium citrate. J. Biol. Chem. 267, 13972–13979 [PubMed] [Google Scholar]
- 37. McFarlane A. S. (1958) Efficient trace-labelling of proteins with iodine. Nature 182, 53. [DOI] [PubMed] [Google Scholar]
- 38. Dunn K. W., Kamocka M. M., and McDonald J. H. (2011) A practical guide to evaluating colocalization in biological microscopy. Am. J. Physiol. Cell Physiol. 300, C723–C742 [DOI] [PMC free article] [PubMed] [Google Scholar]
- 39. Canonico P. G., and Bird J. W. (1969) The use of acridine orange as a lysosomal marker in rat skeletal muscle. J. Cell Biol. 43, 367–371 [DOI] [PMC free article] [PubMed] [Google Scholar]
- 40. Boya P., and Kroemer G. (2008) Lysosomal membrane permeabilization in cell death. Oncogene 27, 6434–6451 [DOI] [PubMed] [Google Scholar]
- 41. Hwang J. J., Lee S. J., Kim T. Y., Cho J. H., and Koh J. Y. (2008) Zinc and 4-hydroxy-2-nonenal mediate lysosomal membrane permeabilization induced by H2O2 in cultured hippocampal neurons. J. Neurosci. 28, 3114–3122 [DOI] [PMC free article] [PubMed] [Google Scholar]
- 42. Kawabata M., Kobayashi H., Mori S., Sekiguchi S., and Takemura Y. (1997) Flow cytometric analysis of P-glycoprotein function by rhodamine 123 dye-efflux assay in human leukemia cells. Rinsho. Byori. 45, 891–898 [PubMed] [Google Scholar]
- 43. Wartenberg M., Ling F. C., Müschen M., Klein F., Acker H., Gassmann M., Petrat K., Pütz V., Hescheler J., and Sauer H. (2003) Regulation of the multidrug resistance transporter P-glycoprotein in multicellular tumor spheroids by hypoxia-inducible factor (HIF-1) and reactive oxygen species. FASEB J. 17, 503–505 [DOI] [PubMed] [Google Scholar]
- 44. Xie J., Li D. W., Chen X. W., Wang F., and Dong P. (2013) Expression and significance of hypoxia-inducible factor-1α and MDR1/P-glycoprotein in laryngeal carcinoma tissue and hypoxic Hep-2 cells. Oncol. Lett. 6, 232–238 [DOI] [PMC free article] [PubMed] [Google Scholar]
- 45. Eskelinen E. L. (2006) Roles of LAMP-1 and LAMP-2 in lysosome biogenesis and autophagy. Mol. Aspects Med. 27, 495–502 [DOI] [PubMed] [Google Scholar]
- 46. Gruenberg J., and van der Goot F. G. (2006) Mechanisms of pathogen entry through the endosomal compartments. Nat. Rev. Mol. Cell Biol. 7, 495–504 [DOI] [PubMed] [Google Scholar]
- 47. Sorkin A., and von Zastrow M. (2009) Endocytosis and signalling: intertwining molecular networks. Nat. Rev. Mol. Cell Biol. 10, 609–622 [DOI] [PMC free article] [PubMed] [Google Scholar]
- 48. Grant B. D., and Donaldson J. G. (2009) Pathways and mechanisms of endocytic recycling. Nat. Rev. Mol. Cell Biol. 10, 597–608 [DOI] [PMC free article] [PubMed] [Google Scholar]
- 49. Hua C. T., Hopwood J. J., Carlsson S. R., Harris R. J., and Meikle P. J. (1998) Evaluation of the lysosome-associated membrane protein LAMP-2 as a marker for lysosomal storage disorders. Clin. Chem. 44, 2094–2102 [PubMed] [Google Scholar]
- 50. Huynh K. K., Eskelinen E. L., Scott C. C., Malevanets A., Saftig P., and Grinstein S. (2007) LAMP proteins are required for fusion of lysosomes with phagosomes. EMBO J. 26, 313–324 [DOI] [PMC free article] [PubMed] [Google Scholar]
- 51. Huotari J., and Helenius A. (2011) Endosome maturation. EMBO J. 30, 3481–3500 [DOI] [PMC free article] [PubMed] [Google Scholar]
- 52. Morales C., Clermont Y., and Nadler N. J. (1986) Cyclic endocytic activity and kinetics of lysosomes in Sertoli cells of the rat: a morphometric analysis. Biol. Reprod. 34, 207–218 [DOI] [PubMed] [Google Scholar]
- 53. Fiszer-Szafarz B., and Nadal C. (1977) Lysosomal enzyme activities in the regenerating rat liver. Cancer Res. 37, 354–357 [PubMed] [Google Scholar]
- 54. Pétriz J., and García-López J. (1997) Flow cytometric analysis of P-glycoprotein function using rhodamine 123. Leukemia 11, 1124–1130 [DOI] [PubMed] [Google Scholar]
- 55. Twentyman P. R., Rhodes T., and Rayner S. (1994) A comparison of rhodamine 123 accumulation and efflux in cells with P-glycoprotein-mediated and MRP-associated multidrug resistance phenotypes. Eur. J. Cancer 30, 1360–1369 [DOI] [PubMed] [Google Scholar]
- 56. Jaiswal J. K., Andrews N. W., and Simon S. M. (2002) Membrane proximal lysosomes are the major vesicles responsible for calcium-dependent exocytosis in nonsecretory cells. J. Cell Biol. 159, 625–635 [DOI] [PMC free article] [PubMed] [Google Scholar]
- 57. Shurety W., Stewart N. L., and Stow J. L. (1998) Fluid-phase markers in the basolateral endocytic pathway accumulate in response to the actin assembly promoting drug Jasplakinolide. Mol. Biol. Cell 9, 957–975 [DOI] [PMC free article] [PubMed] [Google Scholar]
- 58. Rappoport J. Z., and Simon S. M. (2003) Real-time analysis of clathrin-mediated endocytosis during cell migration. J. Cell Sci. 116, 847–855 [DOI] [PubMed] [Google Scholar]
- 59. Baravalle G., Schober D., Huber M., Bayer N., Murphy R. F., and Fuchs R. (2005) Transferrin recycling and dextran transport to lysosomes is differentially affected by bafilomycin, nocodazole, and low temperature. Cell Tissue Res. 320, 99–113 [DOI] [PubMed] [Google Scholar]
- 60. Daecke J., Fackler O. T., Dittmar M. T., and Kräusslich H. G. (2005) Involvement of clathrin-mediated endocytosis in human immunodeficiency virus type 1 entry. J. Virol. 79, 1581–1594 [DOI] [PMC free article] [PubMed] [Google Scholar]
- 61. Sorokin L. M., Morgan E. H., and Yeoh G. C. (1987) Transferrin receptor numbers and transferrin and iron uptake in cultured chick muscle cells at different stages of development. J. Cell Physiol. 131, 342–353 [DOI] [PubMed] [Google Scholar]
- 62. Patki V., Virbasius J., Lane W. S., Toh B. H., Shpetner H. S., and Corvera S. (1997) Identification of an early endosomal protein regulated by phosphatidylinositol 3-kinase. Proc. Natl. Acad. Sci. U.S.A. 94, 7326–7330 [DOI] [PMC free article] [PubMed] [Google Scholar]
- 63. Wilson J. M., de Hoop M., Zorzi N., Toh B. H., Dotti C. G., and Parton R. G. (2000) EEA1, a tethering protein of the early sorting endosome, shows a polarized distribution in hippocampal neurons, epithelial cells, and fibroblasts. Mol. Biol. Cell 11, 2657–2671 [DOI] [PMC free article] [PubMed] [Google Scholar]
- 64. Thilo L., Stroud E., and Haylett T. (1995) Maturation of early endosomes and vesicular traffic to lysosomes in relation to membrane recycling. J. Cell Sci. 108, 1791–1803 [DOI] [PubMed] [Google Scholar]
- 65. Lippincott-Schwartz J., and Fambrough D. M. (1987) Cycling of the integral membrane glycoprotein, LEP100, between plasma membrane and lysosomes: kinetic and morphological analysis. Cell 49, 669–677 [DOI] [PubMed] [Google Scholar]
- 66. Liaudet-Coopman E., Beaujouin M., Derocq D., Garcia M., Glondu-Lassis M., Laurent-Matha V., Prébois C., Rochefort H., and Vignon F. (2006) Cathepsin D: newly discovered functions of a long-standing aspartic protease in cancer and apoptosis. Cancer Lett. 237, 167–179 [DOI] [PubMed] [Google Scholar]
- 67. Jaffrézou J. P., Levade T., Chatelain P., and Laurent G. (1992) Modulation of subcellular distribution of doxorubicin in multidrug-resistant P388/ADR mouse leukemia cells by the chemosensitizer ((2-isopropyl-1-(4-[3-N-methyl-N-(3,4-dimethoxy-β-phenethyl)amino]propyloxy)-benzenesulfonyl))indolizine. Cancer Res. 52, 6440–6446 [PubMed] [Google Scholar]
- 68. Mukherjee S., Ghosh R. N., and Maxfield F. R. (1997) Endocytosis. Endocytosis. Physiol. Rev. 77, 759–803 [DOI] [PubMed] [Google Scholar]
- 69. Smit J. W., Duin E., Steen H., Oosting R., Roggeveld J., and Meijer D. K. (1998) Interactions between P-glycoprotein substrates and other cationic drugs at the hepatic excretory level. Br. J. Pharmacol. 123, 361–370 [DOI] [PMC free article] [PubMed] [Google Scholar]
- 70. Ollinger K., and Brunk U. T. (1995) Cellular injury induced by oxidative stress is mediated through lysosomal damage. Free Radic. Biol. Med. 19, 565–574 [DOI] [PubMed] [Google Scholar]
- 71. Neuzil J., Svensson I., Weber T., Weber C., and Brunk U. T. (1999) α-Tocopheryl succinate-induced apoptosis in Jurkat T cells involves caspase-3 activation, and both lysosomal and mitochondrial destabilisation. FEBS Lett. 445, 295–300 [DOI] [PubMed] [Google Scholar]
- 72. Hawkins H. K., Ericsson J. L., Biberfeld P., and Trump B. F. (1972) Lysosome and phagosome stability in lethal cell injury. Morphologic tracer studies in cell injury due to inhibition of energy metabolism, immune cytolysis and photosensitization. Am. J. Pathol. 68, 255–258 [PMC free article] [PubMed] [Google Scholar]
- 73. Kwon Y., Kamath A. V., and Morris M. E. (1996) Inhibitors of P-glycoprotein-mediated daunomycin transport in rat liver canalicular membrane vesicles. J. Pharm. Sci. 85, 935–939 [DOI] [PubMed] [Google Scholar]
- 74. Jansson P. J., Sharpe P. C., Bernhardt P. V., and Richardson D. R. (2010) Novel thiosemicarbazones of the ApT and DpT series and their copper complexes: identification of pronounced redox activity and characterization of their antitumor activity. J. Med. Chem. 53, 5759–5769 [DOI] [PubMed] [Google Scholar]
- 75. Sundqvist T., and Liu S. M. (1993) Hydrogen peroxide stimulates endocytosis in cultured bovine aortic endothelial cells. Acta Physiol. Scand. 149, 127–131 [DOI] [PubMed] [Google Scholar]
- 76. Dada L. A., Chandel N. S., Ridge K. M., Pedemonte C., Bertorello A. M., and Sznajder J. I. (2003) Hypoxia-induced endocytosis of Na,K-ATPase in alveolar epithelial cells is mediated by mitochondrial reactive oxygen species and PKC-zeta. J. Clin. Invest. 111, 1057–1064 [DOI] [PMC free article] [PubMed] [Google Scholar]
- 77. Niwa K., Sakai J., Karino T., Aonuma H., Watanabe T., Ohyama T., Inanami O., and Kuwabara M. (2006) Reactive oxygen species mediate shear stress-induced fluid-phase endocytosis in vascular endothelial cells. Free Radic. Res. 40, 167–174 [DOI] [PubMed] [Google Scholar]
- 78. Steinman R. M., Mellman I. S., Muller W. A., and Cohn Z. A. (1983) Endocytosis and the recycling of plasma membrane. J. Cell Biol. 96, 1–27 [DOI] [PMC free article] [PubMed] [Google Scholar]
- 79. Chaplain M. A. J. (1996) Avascular growth, angiogenesis and vascular growth in solid tumours: the mathematical modelling of the stages of tumour development. Math. Comput. Model. 23, 47–87 [Google Scholar]
- 80. Marambio P., Toro B., Sanhueza C., Troncoso R., Parra V., Verdejo H., García L., Quiroga C., Munafo D., Díaz-Elizondo J., Bravo R., González M. J., Diaz-Araya G., Pedrozo Z., Chiong M., Colombo M. I., and Lavandero S. (2010) Glucose deprivation causes oxidative stress and stimulates aggresome formation and autophagy in cultured cardiac myocytes. Biochim. Biophys. Acta 1802, 509–518 [DOI] [PubMed] [Google Scholar]
- 81. Ramírez-Peinado S., León-Annicchiarico C. L., Galindo-Moreno J., Iurlaro R., Caro-Maldonado A., Prehn J. H., Ryan K. M., and Muñoz-Pinedo C. (2013) Glucose-starved cells do not engage in prosurvival autophagy. J. Biol. Chem. 288, 30387–30398 [DOI] [PMC free article] [PubMed] [Google Scholar]


