

Abstract
Chloride conducting channelrhodopsins (ChloCs) are new members of the optogenetic toolbox that enable neuronal inhibition in target cells. Originally, ChloCs have been engineered from cation conducting channelrhodopsins (ChRs), and later identified in a cryptophyte alga genome. We noticed that the sequence of a previously described Proteomonas sulcata ChR (PsChR1) was highly homologous to the naturally occurring and previously reported ChloCs GtACR1/2, but was not recognized as an anion conducting channel. Based on electrophysiological measurements obtained under various ionic conditions, we concluded that the PsChR1 photocurrent at physiological conditions is strongly inward rectifying and predominantly carried by chloride. The maximum activation was noted at excitation with light of 540 nm. An initial spectroscopic characterization of purified protein revealed that the photocycle and the transport mechanism of PsChR1 differ significantly from cation conducting ChRs. Hence, we concluded that PsChR1 is an anion conducting ChR, now renamed PsACR1, with a red-shifted absorption suited for multicolor optogenetic experiments in combination with blue light absorbing cation conducting ChRs.
Keywords: algae, biophysics, chloride channel, electrophysiology, optogenetics, patch clamp, photobiology, ultraviolet-visible spectroscopy (UV-Vis spectroscopy), channelrhodopsin
Introduction
A decade ago, channelrhodopsins (ChRs)2 found their way from green motile algae into the emerging field of optogenetics (1). When ChR genes are transferred into electrically excitable cells, the cells become light sensitive in such a way that the membrane voltage can be controlled non-invasively. Light excitation of cation selective ChRs causes an inward-directed ion flux carried primarily by H+ and Na+ (2). In the case of a ChR-expressing neuron, the application of light pulses causes depolarization, which might lead to action potential (AP) firing. In contrast, light-driven pumps derived from prokaryotes or green algae are used for cell hyperpolarization and AP inhibition. These pumps hyperpolarize the cell membrane by pumping ionic species across the membrane against an electrochemical potential, but bear the difficulty that only one charge per photon is transported and very high expression levels are required (3). Recently, ChRs have been genetically engineered to alter ion selectivity from cationic to anionic (4–6). Under physiological conditions (low intracellular, high extracellular [Cl−]) these ChRs shunt cells by clamping their potential toward the reversal potential of Cl−, and thus silence neurons by a mode that differs from light-driven pumps.
Subsequently, two naturally occurring anion conducting ChRs from the cryptophyte alga Guillardia theta (GtACR1/2) were identified and characterized (7). GtACR2 was employed to silence neurons as previously shown for engineered chloride-conducting ChRs (termed ChloC and iC1C2). Inspired by this application we aimed to better understand the chloride transport mechanism. Consequently, we compared the ChR amino acid sequences identified by genome mining approach (8) with the GtACRs and found the sequence of a previously described ChR from Proteomonas sulcata (PsChR1) (8) to be similar to the GtACRs (Fig. 1A and supplemental Fig. S2). Hence, we hypothesized that PsChR1 is also a chloride conducting ChR. Electrophysiological characterization of PsChR1 indeed verified its function as a light-activated chloride channel with a photosensitivity red-shifted compared with GtACR1/2. Time-resolved UV-Vis spectroscopy on recombinant protein revealed a photocycle with a novel so far undiscovered red-shifted intermediate, which is assigned as an early conducting state.
FIGURE 1.
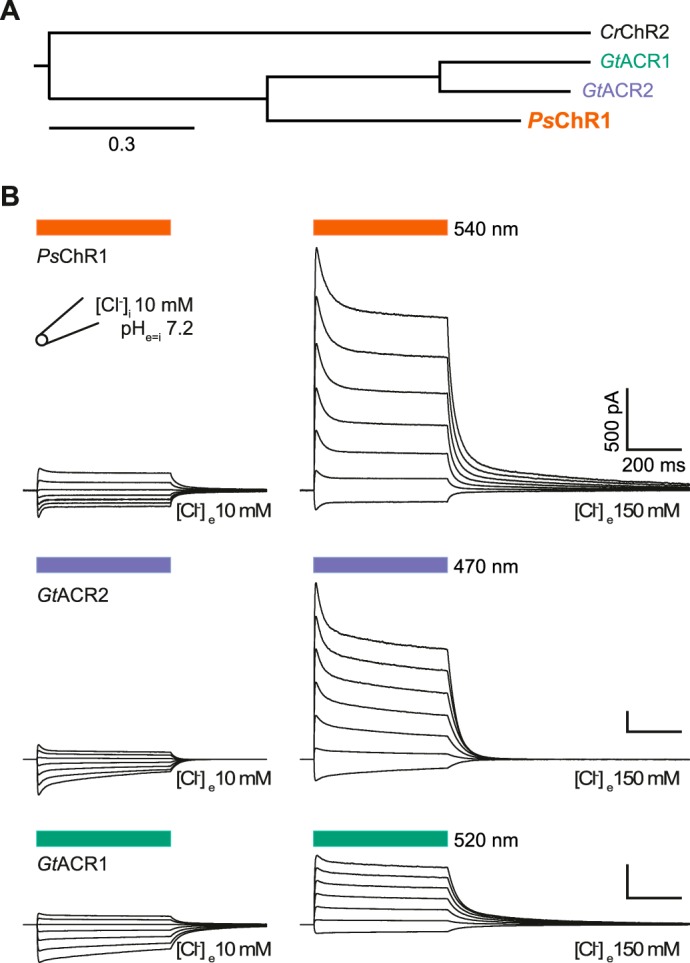
Phylogenetic tree and photocurrents of naturally occurring chloride conducting channelrhodopsins. A, phylogenetic tree of naturally occurring ChloCs and Chlamydomonas reinhardtii channelrhodopsin-2 (CrChR2). B, typical current traces at low (left) and high (right) extracellular [Cl−], measured on the same cell for each ChR, respectively. The holding potential was raised from −80 (bottom) to +40 mV (top trace) in 20 mV steps. Light application is indicated by colored bars above the traces.
Experimental Procedures
Molecular Biology and Protein Purification
Human codon-adapted genes encoding for PsChR1 (GenBankTM: KF992074.1, amino acids 1–291), GtACR1 (GenBankTM: KP171708.1, amino acids 1–295) and GtACR2 (GenBankTM: KP171709.1, amino acids 1–291) were synthesized (GenScript, NJ) and cloned into p-EGFP-C1 vector using NheI and AgeI restriction sites. EGFP was replaced by mCherry using AgeI and XhoI restriction sites. DNA sequences can be found in supplemental Fig. S1.
For expression in Pichia pastoris, humanized PsChR1-encoding DNA sequence was subcloned with C-terminal 6×His-Tag into a pPICZ vector (Invitrogen). Cell transformation, selection of recombinant clones, and expression have been performed as described elsewhere (9). Cells were harvested 24 h post-induction and lysed using a high pressure homogenizer (EmulsiFlex-B15, AVESTIN). The membrane fraction was collected and recombinant rhodopsin was solubilized with 1% (w/v) dodecylmaltoside (DDM, Glycon, Luckenwalde, Germany). The protein was purified by affinity chromatography and gel filtration (HisTrap FF Crude HiLoad 16/600 Superdex 200) (all from GE Healthcare, Chalfont St. Giles, UK). The purified protein was concentrated in a buffer containing 20 mm Tris, pH 8.0, 150 mm NaCl, and 0.02% DDM.
HEK293 Cell Recordings
HEK293 (human embryonic kidney) cells (catalogue 85120602, Sigma-Aldrich, Munich, Germany) were cultured as described (4), seeded onto poly-l-lysine-coated coverslips at a concentration of 1.5 × 10⁵ cells · ml−1 and supplemented with 1 μm all-trans retinal (Sigma-Adrich, Munich, Germany). Cells were transiently transfected using Fugene HD (Roche, Mannheim, Germany) 36 h before measurements. Signals were amplified and digitized using AxoPatch200B and DigiData1400 (Molecular Devices, Sunnyvale, CA). A Polychrome V (TILL Photonics, Planegg, Germany) served as light source. The half-bandwidth was set to ±7 nm for all measurements. Actinic light was coupled into an Axiovert 100 microscope (Carl Zeiss, Jena, Germany) and controlled with a programmable shutter system (VS25 and VCM-D1, Vincent Associates, Rochester, NY). Patch pipettes were pulled using a P1000 micropipette puller (Sutter Instruments, Novato, CA), followed by fire-polishing resulting in pipette resistances between 1.5 and 2.5 MΩ. Whole-cell recordings had a minimum membrane resistance of 500 MΩ (usually >1 GΩ) whereas the access resistance was kept below 10 MΩ. Liquid junction potentials (LJPs) were corrected on-line (see below).
Chloride-dependent Measurements
For all experiments external buffer solutions were exchanged by perfusion of at least 4 ml of the respective buffer into the custom made recording chamber (volume ∼500 μl) while the bath level was kept constant with an automatic peristaltic pump controlled by a fluid level sensor (MPCU bath handler, Lorenz Messgerätebau, Katlenburg-Lindau, Germany). The buffer compositions for the pipette solution (10 mm Cl−) was as follows (in mm): 2 MgCl2, 2 CaCl2, 1 KCl, 1 CsCl, 10 EGTA, 10 HEPES, 110 Na-Aspartate, whereas the low/high chloride bath solution (10/150 mm Cl−) was composed of (in mm): 2 MgCl2, 2 CaCl2, 1 KCl, 1 CsCl, 10 HEPES, 0/140 NaCl, 140/0 Na-Aspartate. The pH of all buffers was adjusted with N-methyl-d-glucamine to pH 7.20. The final osmolarity was adjusted to 320 mOsm for extracellular solutions and 290 mOsm for intracellular solutions.
All experiments were carried out at 25 °C. We used a 140 mm NaCl agar bridge to maintain a stable reference (bath) electrode potential. Patch clamp recordings were performed under balanced low chloride conditions (10 mm) to exclude chloride adulteration. As the change of extracellular chloride concentration causes a LJP, all measurements have been corrected on-line for occurring LJP of 10.5 mV for an extracellular chloride concentration of 150 mm (10).
Illumination Properties and Protocols
Light intensities were measured after passing through all optics and coverslip with a calibrated optometer (P9710, Gigahertz Optik, Türkenfeld, Germany). Measured light intensities are given for the illuminated field of the W Plan-Apochromat 40×/1.0 DIC objective (0.264 mm2).
The applied light intensities for conventional current voltage recordings at 470, 520, and 540 nm were 4.71, 3.40, and 3.12 mW/mm2, respectively. Light was applied for 500 ms. The holding voltage was raised from −80 to +40 mV in 20 mV steps.
For wavelength-dependent measurements (recording of action spectra), a motorized neutral density filter wheel (NDF) (Newport, Irvine, CA) was inserted into the light path between the Polychrome V light source and the microscope to gain the same photon irradiance for all wavelengths (390 to 670 nm; 10 nm steps). A custom software written in LabVIEW (National Instruments, Austin, TX) was used to control the NDF and synchronize it with electrophysiological experiments. Light was applied for 10 ms at 0 mV holding potential and 150 mm extracellular Cl−. Minimal deviations in photon flux were corrected by linear normalization post measurements.
For light titration experiments, ND filters (SCHOTT, Mainz, Germany) were used for attenuation. Light intensities were measured as stated above for each condition. Here, light was applied for 1 s. The holding potential was kept at 20 mV.
Fluorescence Measurements
Cell fluorescence measurements were acquired with a tripleband ECFP/EYFP/mCherry 69008 filterset (Chroma, Bellows Falls, VT) and Wat-221S CCD camera (Watec, Tsuruoka, Japan). Images were analyzed with ImageJ. Raw fluorescence was integrated per cell and normalized to cell area. Background fluorescence has always been subtracted. Photocurrents were directly correlated with the relative fluorescence of each cell measured prior patch clamp measurements.
UV-Vis Spectroscopy
Absorbance spectrum of purified PsChR1 was recorded by a Cary 50 Bio spectrophotometer (Varian Inc., Palo Alto) at 22 °C. Flash-photolysis experiments were performed on a LKS.60 system (Applied Photophysics Ltd., Leatherland, UK) aligned to a tunable Rainbow OPO/Nd:YAG laser (BrilliantB, Quantel, Les Ulis Cedex, France) (11). PsChR1 sample (in 20 mm Tris, pH 8.0, 150 mm NaCl, 0.02% DDM with chromophore absorption of ∼0.7) was excited by green flashes (535 nm) of ∼10 ns adjusted to a power of 5 mJ per shot. Resulting absorption changes at 22 °C were probed by a 150 Watt Xenon Short Arc XBO lamp (Osram, München, Germany), which was pulsed for times beneath 1 μs, and detected isologarithmically by an Andor iStar ICCD camera (Andor Technolgy Ltd, Belfast, Ireland) at 44 time points between 40 ns and 10 s. After every measurement, sample was kept in the dark for 2 min to ensure complete recovery.
Data Analysis and Statistics
Data were analyzed using Clampfit 10.4 and Origin 9. All data are given as means ± S.E. of the mean (S.E.). Stationary photocurrents (IS) were measured for the last 50 ms of illumination period. Reversal potentials (Erev) were calculated by linear fit of the two data points between crossing of I = 0 pA occurs. For the action spectra recording, photocurrents have been normalized to the maximum response. The maximum response wavelength (λmax) has been determined by fitting single recorded action spectra with a three parametric Weibull function. Kinetic properties were determined by mono- or biexponential fitting using minimization sum of squared errors method. Half maximal effective light dose values (EC50) were determined by fitting single light titration curves by logistic growth function. We performed one-way ANOVA, followed by Tukey's test for electrophysiological data, thoroughly.
Time-resolved spectroscopic data sets are averages of 15 cycles over the entire time domain and were analyzed globally by Glotaran (12, 13). Spectra were reconstructed by the most significant single value decomposition (SVD) components. Normalized Evolutionary Associated Difference Spectra (EADS) and their corresponding life-times are derived using an unbranched, unidirectional model as described previously (14), with five spectral components.
Results
To test the ability of PsChR1 to transport Cl− across cell membranes, we generated plasmids encoding for human codon optimized PsChR1 (and GtACRs for comparison) fused to the mCherry fluorophore to assess expression in human embryonic kidney (HEK) cells. After 36–48 h the biophysical photocurrent properties of the expressed ChRs were studied by whole cell patch clamp electrophysiology.
When [Cl−] was kept low on both sites of the membrane (10 mm), all three proteins exhibited similar photocurrents that inverted their sign when the membrane voltage was changed from negative to positive. After increasing extracellular [Cl−] to 150 mm, we observed positive photocurrents at holding voltages around −70 mV, demonstrating that PsChR1 was conducting Cl− into the cell (Fig. 1B).
When normalized photocurrents of the three ChRs were compared at 0 mV and high extracellular Cl− conditions (10 mm [Cl−]i, 150 mm [Cl−]e), the PsChR1 current was more than three times larger than GtACR1, and twice as large as GtACR2, respectively (Figs. 1B and 2A), which indicates that inward directed Cl− transport is favored over outward movement particularly in PsChR1. The observed reversal potentials (Erev) detailed in Fig. 2B follow the Erev of Cl− in all three cases with no obvious differences.
FIGURE 2.
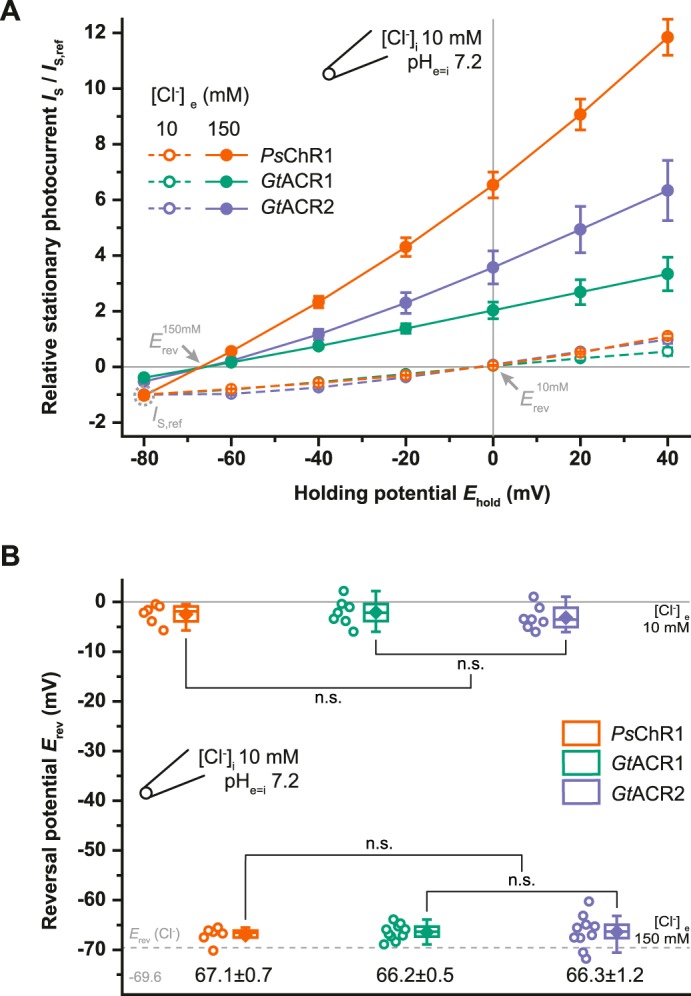
Current voltage dependence and reversal potentials for different chloride concentrations. A, current voltage relation under different extracellular [Cl−]. Stationary photocurrents (IS) were normalized to IS,ref = −80 mV and 10 mm [Cl−]e is indicated by the gray dotted circle. Mean values ± S.E. are shown (n = 6–7). B, reversal potentials (Erev) extracted from single measurements as shown in A. Center lines indicate the medians, box limits indicate the 25th and 75th percentiles, whiskers extend 1.5-times the interquartile range from the 25th and 75th percentiles, mean values are represented by diamonds, and circles indicate single measurement data points. n.s., not significant (one way ANOVA; Tukey's post-hoc test).
Govorunova et al. reported unusually high single channel conductance for GtACRs (7). To compare the relative conductivity of the different ChRs, we first analyzed the expression levels by integrating the mCherry-fluorescence and correlated it to the respective cell area. All three rhodopsins exhibited almost similar expression levels 36 h post-transfection (Fig. 3A). We then compared absolute photocurrents and current amplitudes normalized to cell fluorescence and cell area. The absolute and relative photocurrents were significantly higher for GtACRs compared with PsChR1 (Fig. 3B). However, under identical conditions the current amplitude was still larger in PsChR1 (394 ± 81 pA, n = 7) than in the engineered chloride channels ChloC (31 ± 10 pA, n = 6), slowChloC (188 ± 38 pA, n = 7) (4), iChloC (210 ± 29 pA, n = 6) (6), and iC1C2 (51 ± 11 pA, n = 15, data not shown).
FIGURE 3.
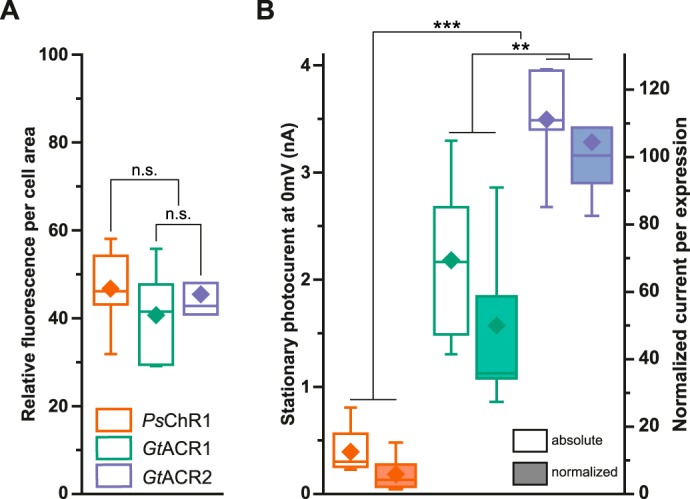
Expression and photocurrent comparison. A, mean fluorescence divided by cell area. B, absolute stationary photocurrents and currents normalized to values obtained as in A. Center lines indicate the medians, box limits indicate the 25th and 75th percentiles, whiskers extend 1.5-times the interquartile range from the 25th and 75th percentiles, mean values are represented by diamonds. n.s., not significant; **, p < 0.01; ***, p < 0.001; n = 5–8 (one way ANOVA; Tukey's post-hoc test).
For temporally precise optogenetic experiments, the channel closing properties are often of interest. Hence, we carefully analyzed the closing kinetics of all three ChRs. PsChR1 and GtACR1 exhibited biphasic off-kinetics comprised of a fast and a slow component like most cation conducting ChRs (15–17), whereas the decay of GtACR2 was mono-exponential (Fig. 4A). The slow time constants (τslow) were similar for GtACR1 (257 ± 10 ms, n = 8) and PsChR1 (303 ± 31 ms, n = 9). However, the slow component amplitude (Aslow) for GtACR1 accounted for 44.3% of the overall off-kinetic, which was twice that of PsChR1 (20.6% see Fig. 4B). The fast time constants (τfast) for PsChR1 and GtACR1 were 23 ± 3 ms and 41 ± 1 ms, respectively. Next, we calculated the apparent off-kinetic time constants for comparison with the GtACR2 closing rate. Due to the shorter τfast and the smaller slow-component amplitude (Aslow), PsChR1 displayed faster apparent closing kinetics than GtACR1 (∼80 versus ∼140 ms), whereas GtACR2 exhibited the most rapid closing (∼60 ms; Fig. 4C).
FIGURE 4.

Kinetic properties. A, typical closing kinetics after light off. B, two component closing kinetics of GtACR1 and PsChR1 showing fast (τfast, Afast) and slow (τslow, Aslow) component and amplitude, respectively. C, apparent closing kinetics of GtACR1/2 and PsChR1. Center lines indicate the medians, box limits indicate the 25th and 75th percentiles, whiskers extend 1.5-times the interquartile range from the 25th and 75th percentiles, mean values are represented by diamonds, and circles indicate single measurement data points. n.s., not significant; *, p < 0.05; **, p < 0.01; ***, p < 0.001; n = 8–10 (one way ANOVA; Tukey's post-hoc test).
To determine the dark state absorption, we performed action spectroscopy with short light pulses. As previously (7) reported, GtACR1 and GtACR2 exhibited peak activity (λmax) at 518.5 ± 0.2 and 470 ± 0.5 nm (mean ± S.E., n = 8), respectively. PsChR1 activity peaked at 537.8 ± 0.6 nm (mean ± S.E., n = 9), and was thus 20 nm more red-shifted than GtACR1 (Fig. 5A). Next, light titration experiments with 470 nm (GtACR2), 520 nm (GtACR1), and 540 ± 7 nm (PsChR1) excitation were carried out to ascertain the half maximal effective light dose (EC50; Fig. 5B). GtACR2 displayed the highest sensitivity to the cells (EC50, 0.05 ± 0.01 mW/mm2; n = 6). GtACR1 and PsChR1 were one-half and one-fourth as sensitive compared with GtACR2 (EC50, 0.09 ± 0.02 mW/mm2; n = 6, and 0.20 ± 0.02 mW/mm2; n = 7, respectively), although 10-fold differences were apparent in the amplitudes (Fig. 3).
FIGURE 5.
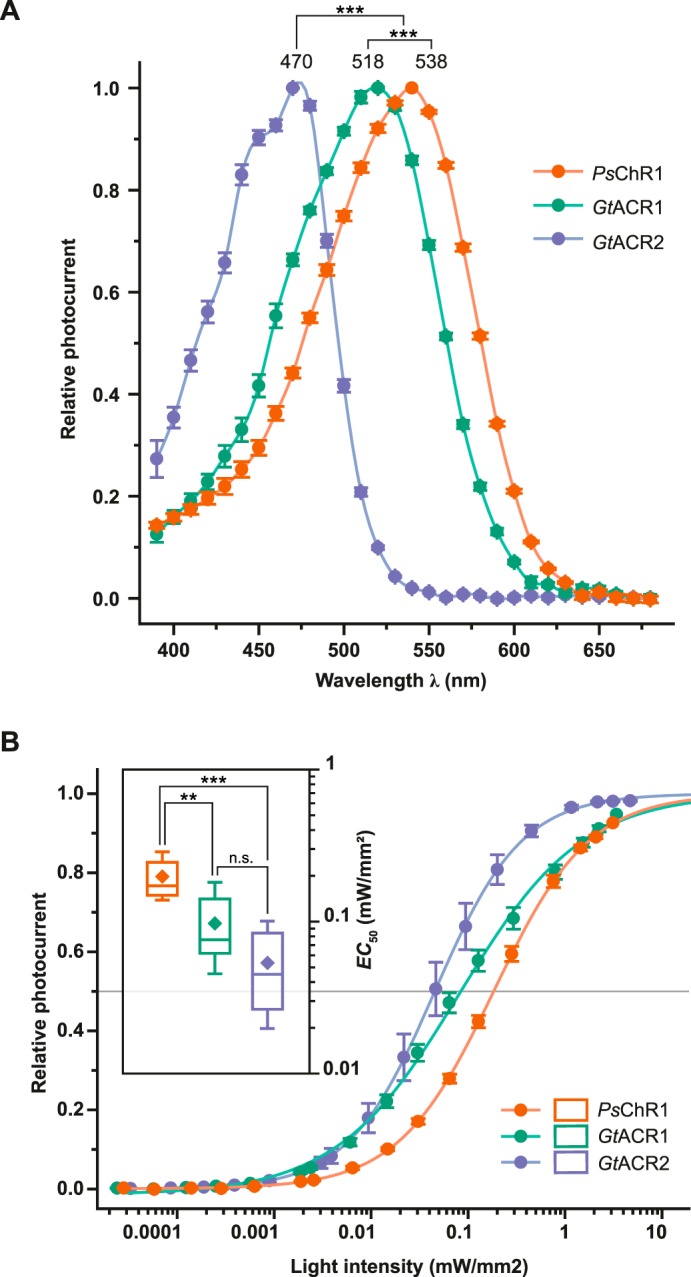
Spectral properties and light sensitivity. A, normalized peak response. Mean values ± S.E. are shown (n = 8–9) and maximum responses obtained from fitting are listed. B, light titration and fitted EC50 values (inset). Mean values ± S.E. are shown (n = 6–7). Center lines indicate the medians, box limits indicate the 25th and 75th percentiles, whiskers extend 1.5-times the interquartile range from the 25th and 75th percentiles, mean values are represented by diamonds. n.s., not significant; *, p < 0.05; **, p < 0.01; ***, p < 0.001 (one way ANOVA; Tukey's post-hoc test).
To characterize the photocycle by time-resolved UV-Vis-spectroscopy we heterologously expressed PsChR1 in the yeast P. pastoris. The absorption spectrum of purified, dark-adapted PsChR1 exhibits the prominent peak at 535 nm, in good agreement with the obtained action spectrum (Fig. 6A). Formation and decay of photocycle intermediates were recorded as transient absorbance changes between 40 ns to 10 s after laser flash excitation. Five spectral species with unique spectral and kinetic properties could be identified. In Fig. 6B the normalized Evolution Associated Difference Spectra (EADS) of these main kinetic components are shown. Unless otherwise indicated photocycle intermediates are denoted according to their maximal absorption within the difference spectra. Immediately after the flash excitation (i.e. below the instrumental time limit) an early red-shifted photoproduct (P610) is formed that is followed by a less prominent blue absorbing species (P460) within a few μs (Fig. 6C). P460 persists over two orders of time and converts to a second red-shifted photointermediate (P620). The decay of P620 (τapp ∼20 ms) is accompanied by the formation of a late blue-absorbing intermediate (P400). Within ∼90 ms a slowly decaying intermediate spectrally not distinguishable from the dark state (P535, absolute maximum) is populated that finally reconverts to the dark-state after 1.5 s.
FIGURE 6.

Spectroscopic characterization of PsChR1. A, solid line shows normalized absorption spectrum of detergent-purified P. pastoris-expressed PsChR1 (pH 8.0 150 mm NaCl; normalized to 280 nm). Dots show electrophysiological data as presented in Fig. 5A (pH 7.2 150 mm NaCle; normalized to maximum response). B, normalized (to maximum absorption amplitude) Evolutionary Associated Difference Spectra (EADS) and their life-times derived using a unidirectional sequential model comprising five components. For illustration purposes, solid lines were added to the EADS. C, time course of the spectral components. Raw data points are depicted as dots, whereas global fits are represented as solid lines. Dashed gray lines denote half-life-time from EADS as shown in B.
Discussion
In summary, we determined that the previously characterized PsChR1 from Proteomonas sulcata is a chloride conducting ChR that should be classified in a group with the two GtACRs. As well, renaming PsChR1 as PsACR1 would be beneficial to avoid confusion with the cation conducting PsChR found in Platymonas subcordiformis (18).
Further, because both Proteomonas sulcata and Guillardia theta belong to the Geminigeraceae family, genome mining in this family or the Cryptophyta phylum (19) might enable the discovery of additional and novel ACRs.
The attractive difference between PsACR1 and the two GtACRs is apparently the red-shifted absorption. This feature renders PsACR1 to be an interesting optogenetic tool. Due to the lower scattering of red or green light compared with blue light within biological tissue PsACR1 may enable researchers to inactivate neurons in deeper brain regions. Since the absorption maxima of known ChRs cover a spectral region from 435 to 590 nm (8, 20), the use of PsACR1 in combination with a blue-absorbing cation conducting ChR is well suited for dual color application.
Although the absolute photocurrent generated by PsACR1 is smaller than those obtained from GtACRs, the conductance of PsACR1 is still in the same range as most known cation conducting ChRs and higher than the engineered light-gated chloride channel iChloC that is able to suppress AP firing in vivo (6). Further, if the chloride conductance is high and not compensated by endogenous chloride transporters prolonged or repeated illumination could dramatically change the chloride gradient. Thus, the neuronal excitability might increase upon sustained illumination at the tissue surface.
The initial spectroscopic characterization of PsACR1 reveals substantial differences to photocycles of cation conducting ChRs (11, 21–24). As in virtual all microbial rhodopsin also in PsACR1 the early red-shifted K-like photoproduct reflects an energetically elevated electronic ground-state after photoisomerization (25). However, two further photocycle intermediates, P460 and P620 could be identified in PsACR1 within the μs to ms region, before deprotonation of the retinal Schiff base (RSB) occurs as seen as development of the late P400 state. Albeit the comparison of spectroscopic and electrophysiological time constants can differ significantly due to lipid or detergent environments (26), the rise of P400 is too slow to correlate with channel on-gating but is in the time range of the major decay component of the PsACR1 photocurrent instead. Thus, we assign the second red-shifted species P620 to a novel early conducting state, which does not emerge from a deprotonated RSB.
As new members of the optogenetic toolbox, chloride-conducting ACRs will extend the ability to specifically address questions surrounding Cl− homeostasis, developmental influences of chloride, as well as loss of function experiments in a neurophysiological context. Likewise, ACRs have striking features that render them superior to light-driven ion pumps previously used for cell inactivation. ChRs transport many charges per turnover, they allow for easy modification of kinetics and light sensitivity through the introduction of step function mutations (27, 28), and they act more physiological like the endogenous GABAA-receptor and do not hyperpolarize the cell membrane far below physiological levels (6).
Author Contributions
J. W. identified the sequence, designed, and performed all electrophysiological experiments, analyzed, and interpreted the resulting data and prepared all figures. M. B. performed protein expression and steady state spectroscopy. B. S. K. measured and processed time resolved spectroscopic data. M. B., P. H., and J. W. wrote the paper, with contributions of B. S. K. All authors reviewed the results and approved the final version of the manuscript.
Acknowledgments
We thank Melanie Meiworm, Maila Reh, Altina Klein, and Thi Bich Thao Nguyen for technical assistance.
This work was supported by the German Research Foundation (DFG) (SFB1078 B2, FOR1279 SPP1665 and the Cluster of Excellence Unifying Concepts in Catalysis, UniCat, Project E4/D4 (to P. H.). The authors declare that they have no conflicts of interest with the contents of this article.

This article contains supplemental Figs. S1 and S2.
- ChR
- channelrhodopsin
- ChloC
- chloride conducting channelrhodopsins
- PsChR1
- Proteomonas sulcata ChR1
- GtACR1/2
- Guillardia theta anion ChR1/2
- AP
- action potential
- HEK
- human embryonic kidney
- LJP
- liquid junction potential
- NDF
- neutral density filter
- ANOVA
- analysis of variance
- UV-Vis
- ultraviolet-visible
- DDM
- dodecylmaltoside
- SVD
- single value decomposition
- EADS
- Evolutionary Associated Difference Spectrum
- mW
- milliwatt.
References
- 1. Boyden E. S., Zhang F., Bamberg E., Nagel G., and Deisseroth K. (2005) Millisecond-timescale, genetically targeted optical control of neural activity. Nat. Neurosci. 8, 1263–1268 [DOI] [PubMed] [Google Scholar]
- 2. Schneider F., Gradmann D., and Hegemann P. (2013) Ion selectivity and competition in channelrhodopsins. Biophys. J. 105, 91–100 [DOI] [PMC free article] [PubMed] [Google Scholar]
- 3. Chow B. Y., Han X., Dobry A. S., Qian X., Chuong A. S., Li M., Henninger M. A., Belfort G. M., Lin Y., Monahan P. E., and Boyden E. S. (2010) High-performance genetically targetable optical neural silencing by light-driven proton pumps. Nature 463, 98–102 [DOI] [PMC free article] [PubMed] [Google Scholar]
- 4. Wietek J., Wiegert J. S., Adeishvili N., Schneider F., Watanabe H., Tsunoda S. P., Vogt A., Elstner M., Oertner T. G., and Hegemann P. (2014) Conversion of channelrhodopsin into a light-gated chloride channel. Science 344, 409–412 [DOI] [PubMed] [Google Scholar]
- 5. Berndt A., Lee S. Y., Ramakrishnan C., and Deisseroth K. (2014) Structure-guided transformation of channelrhodopsin into a light-activated chloride channel. Science 344, 420–424 [DOI] [PMC free article] [PubMed] [Google Scholar]
- 6. Wietek J., Beltramo R., Scanziani M., Hegemann P., Oertner T. G., and Simon Wiegert J. (2015) An improved chloride-conducting channelrhodopsin for light-induced inhibition of neuronal activity in vivo. Sci. Rep. 5, 1–11 [DOI] [PMC free article] [PubMed] [Google Scholar]
- 7. Govorunova E. G., Sineshchekov O. A., Janz R., Liu X., and Spudich J. L. (2015) Natural light-gated anion channels: A family of microbial rhodopsins for advanced optogenetics. Science 349, 647–650 [DOI] [PMC free article] [PubMed] [Google Scholar]
- 8. Klapoetke N. C., Murata Y., Kim S. S., Pulver S. R., Birdsey-Benson A., Cho Y. K., Morimoto T. K., Chuong A. S., Carpenter E. J., Tian Z., Wang J., Xie Y., Yan Z., Zhang Y., Chow B. Y., Surek B., Melkonian M., Jayaraman V., Constantine-Paton M., Wong G. K.-S., and Boyden E. S. (2014) Independent optical excitation of distinct neural populations. Nat. Methods 11, 338–346 [DOI] [PMC free article] [PubMed] [Google Scholar]
- 9. Yizhar O., Fenno L. E., Prigge M., Schneider F., Davidson T. J., O'Shea D. J., Sohal V. S., Goshen I., Finkelstein J., Paz J. T., Stehfest K., Fudim R., Ramakrishnan C., Huguenard J. R., Hegemann P., and Deisseroth K. (2011) Neocortical excitation/inhibition balance in information processing and social dysfunction. Nature 477, 171–178 [DOI] [PMC free article] [PubMed] [Google Scholar]
- 10. Barry P. H. (1994) JPCalc, a software package for calculating liquid junction potential corrections in patch-clamp, intracellular, epithelial and bilayer measurements and for correcting junction potential measurements. J. Neurosci. Methods 51, 107–116 [DOI] [PubMed] [Google Scholar]
- 11. Ritter E., Stehfest K., Berndt A., Hegemann P., and Bartl F. J. (2008) Monitoring light-induced structural changes of Channelrhodopsin-2 by UV-visible and Fourier transform infrared spectroscopy. J. Biol. Chem. 283, 35033–35041 [DOI] [PMC free article] [PubMed] [Google Scholar]
- 12. Snellenburg J. J., Laptenok S. P., Seger R., Mullen K. M., and van Stokkum I. H. M. (2012) Glotaran: a Java-based graphical user interface for the R package TIMP. J. Stat. Softw. 49, 1–22 [Google Scholar]
- 13. Mullen K. M., and van Stokkum I. H. M. (2007) TIMP : An R package for modeling multi-way spectroscopic measurements. J. Stat. Softw. 18, 1–46 [Google Scholar]
- 14. Luck M., Mathes T., Bruun S., Fudim R., Hagedorn R., Nguyen T. M. T., Kateriya S., Kennis J. T. M., Hildebrandt P., and Hegemann P. (2012) A photochromic histidine kinase rhodopsin (HKR1) that is bimodally switched by ultraviolet and blue light. J. Biol. Chem. 287, 40083–40090 [DOI] [PMC free article] [PubMed] [Google Scholar]
- 15. Hegemann P., Ehlenbeck S., and Gradmann D. (2005) Multiple photocycles of channelrhodopsin. Biophys. J. 89, 3911–3918 [DOI] [PMC free article] [PubMed] [Google Scholar]
- 16. Nikolic K., Grossman N., Grubb M. S., Burrone J., Toumazou C., and Degenaar P. (2009) Photocycles of channelrhodopsin-2. Photochem. Photobiol. 85, 400–411 [DOI] [PubMed] [Google Scholar]
- 17. Prigge M., Schneider F., Tsunoda S. P., Shilyansky C., Wietek J., Deisseroth K., and Hegemann P. (2012) Color-tuned channelrhodopsins for multiwavelength optogenetics. J. Biol. Chem. 287, 31804–31812 [DOI] [PMC free article] [PubMed] [Google Scholar]
- 18. Govorunova E. G., Sineshchekov O. A., Li H., Janz R., and Spudich J. L. (2013) Characterization of a highly efficient blue-shifted channelrhodopsin from the marine alga Platymonas subcordiformis. J. Biol. Chem. 288, 29911–29922 [DOI] [PMC free article] [PubMed] [Google Scholar]
- 19. Clay B. L., Kugrens P., and Lee R. E. (1999) A revised classification of Cryptophyta. Bot. J. Linn. Soc. 131, 131–151 [Google Scholar]
- 20. Schneider F., Grimm C., and Hegemann P. (2015) Biophysics of channelrhodopsin. Annu. Rev. Biophys. 44, 167–186 [DOI] [PubMed] [Google Scholar]
- 21. Ernst O. P., Murcia P. A. S., Daldrop P., Tsunoda S. P., Kateriya S., and Hegemann P. (2008) Photoactivation of channelrhodopsin. J. Biol. Chem. 283, 1637–1643 [DOI] [PubMed] [Google Scholar]
- 22. Kianianmomeni A., Stehfest K., Nematollahi G., Hegemann P., and Hallmann A. (2009) Channelrhodopsins of Volvox carteri are photochromic proteins that are specifically expressed in somatic cells under control of light, temperature, and the sex inducer. Plant Physiol. 151, 347–366 [DOI] [PMC free article] [PubMed] [Google Scholar]
- 23. Sineshchekov O. A., Govorunova E. G., Wang J., Li H., and Spudich J. L. (2013) Intramolecular proton transfer in channelrhodopsins. Biophys. J. 104, 807–817 [DOI] [PMC free article] [PubMed] [Google Scholar]
- 24. Szundi I., Li H., Chen E., Bogomolni R., Spudich J. L., and Kliger D. S. (2015) Platymonas subcordiformis channelrhodopsin-2 function. Part I: the photochemical reaction cycle. J. Biol. Chem. 290, 16573–16584 [DOI] [PMC free article] [PubMed] [Google Scholar]
- 25. Ernst O. P., Lodowski D. T., Elstner M., Hegemann P., Brown L. S., and Kandori H. (2014) Microbial and animal rhodopsins: structures, functions, and molecular mechanisms. Chem. Rev. 114, 126–163 [DOI] [PMC free article] [PubMed] [Google Scholar]
- 26. Lórenz-Fonfría V. A., and Heberle J. (2014) Channelrhodopsin unchained: structure and mechanism of a light-gated cation channel. Biochim. Biophys. Acta. 1837, 626–642 [DOI] [PubMed] [Google Scholar]
- 27. Berndt A., Yizhar O., Gunaydin L. A., Hegemann P., and Deisseroth K. (2009) Bi-stable neural state switches. Nat. Neurosci. 12, 229–234 [DOI] [PubMed] [Google Scholar]
- 28. Dawydow A., Gueta R., Ljaschenko D., Ullrich S., Hermann M., Ehmann N., Gao S., Fiala A., Langenhan T., Nagel G., and Kittel R. J. (2014) Channelrhodopsin-2-XXL, a powerful optogenetic tool for low-light applications. Proc. Natl. Acad. Sci. U.S.A. 111, 13972–13977 [DOI] [PMC free article] [PubMed] [Google Scholar]