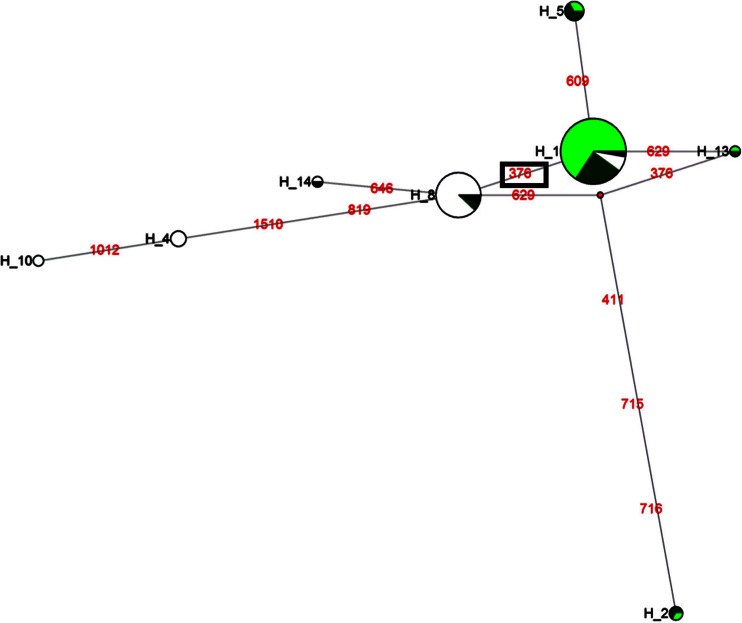
Fig. 5.
Median-joining network for haplotypes at the TLR2 ectodomain. The circles represent haplotypes and the size of the circles are proportional to the frequency of the haplotypes. The mutation positions are shown along branches as red numbers. Asian wild boars, Asian domestic pigs, European wild boars, and European domestic pigs populations are shown in black, white, deep green, and light green colors, respectively. SNP 376, under positive selection is boxed and differentiates the Asian and European populations

