

Abstract
This brief article focuses on two aims: i) To investigate the in vitro pharmaco-dynamic interactions of combining synthetic potent microtubule targeting anticancer agent, Fludelone (FD) with cyto-protective agent, Panaxytriol (PXT) derived from Panax ginseng, and ii) To illustrate step-by-step operation for conducting two-drug combination in vitro using the combination index method, in terms of experimental design, data acquisition, computerized simulation and data interpretation. The Chou-Talalay method for drug combination is based on the median-effect equation, which provides the theoretical basis for the combination index (CI)-isobologram equation that allows quantitative determination of drug interactions, where CI<1, =1, and >1 indicates synergism, additive effect and antagonism, respectively. Based on these algorithms, computer software, CompySyn, is used for determining synergism and antagonism at all doses or effect levels simulated automatically. The use of Chou-Talalay’s CI method in quantifying synergism or antagonism is increasing steadily during the past two decades, however, confusing questions and pitfalls were still frequently raised by insufficient understanding of the theory, especially reflected when researchers trying to use the computerized software to design and conduct experiments. In order to specifically address the confusions and to illustrate the practical features of this method, in this paper, a selected example is given based on our unpublished data regarding the combinational pharmacologic interactions of FD and PXT against the growth of breast cancer cell line MX-1. The step-by-step operation from experimental design to the real data analysis is illustrated. The results indicated that FD and PXT combination in vitro exerted synergistic effect when cell growth inhibition was greater than 45%, with CI ranged 0.836-0.609 for the fractional inhibition of Fa=0.50~0.90, as shown by the Fa-CI plot and by the isobologram. Thus, quantitative conclusion of synergism is obtained using the Chou-Talalay CI method, under the well-defined simple conditions for the FD and PXT combinations in vitro.
Keywords: Fludelone, panaxytriol, synergism quantification, combination index, compusyn
Introduction
Currently, drug combinations have been widely used and become the leading choice for treating many dreadful diseases, such as cancer and acquired immune deficiency syndrome (AIDS). Attempts have been made during the past century to develop the strategy to assess quantitatively maximum synergistic effect in drug combination studies. However, this effort is compromised by the long-standing confusions and controversies in this field as manifested by over 20 definitions for synergy and discrepancies in its determination [1]. According to Thomson Reuters Web of Science and Google Scholar Citations Core Databases, the combination index (CI) method based on the median-effect principle of the mass-action law introduced in 1984 by Chou and Talalay [2] is the most cited (4, 369 citations) and the broadest cited (in over 693 bio-medical journals) synergy assessment paper of all time [Google Scholar Citations - Ting-Chao Chou AND Thomson Reuters Web of Science: http://www.reseracherid.com/rid/B-4111-2009]. A comprehensive review of the CI method by Chou in 2006 [1], which consists of detailed theoretical basis, experimental design, and computerized simulation of synergism, has received the second highest citation. On the same CI subject in a question-and-answer (Q&A) format [3], Chou had clarified many frequently raised questions. This paper also received remarkable citations since 2010 in 217 different bio-medical journals [see Supplementary Table 1]. Since some researchers still find the CI theory difficult to follow when visiting the ComoySyn web site [4], this paper is an attempt to transform previous general theoretical discussions into specific example of using FD+PXT combination for the real time analytical practice.
With the increasing applications of the Chou-Talalay theory, the most updated version called CompuSyn was introduced in 2005 [4]. Compared to earlier versions, CompuSyn generates better quality graphics that are ready for publication, provides more options and flexibility, and improves statistics (for more information, visit combosyn@gmail.com). Since August 1st, 2012, CompuSyn was offered for free download with real name registration. By the time of this paper publication, it has reached 11,451 downloads by researchers from 88 countries or territories.
Meanwhile, many of the new-applicants of this CompuSyn software have not been quite familiar with the mathematics-oriented Chou-Talalay method. Thus some of researchers have encountered difficulties and uncertainty when actually conduct experimental design, analysis, and interpretation of the data resulted from the computer simulation. This was reflected by over one hundred of consultations through emails or telephone calls that Chou has received during the past years. Therefore, this article aims to focus on the step-by-step illustration for conducting two-drug combinations in vitro using the combination index method. Specifically, dose-range, combination ratio, design layout, computerized simulation of synergism/antagonism and results presentation will be sequentially described based on the example of the combination of Fludelone (FD) and panaxytriol (PXT), two drugs with unique anticancer properties, against breast cancer cell line MX-1 growth. The current example may not be perfect in all aspects, but rather represents a correct design with appropriate data analysis and interpretations using Chou-Talalay method to determine synergy, which provides an opportunity to illustrate frequently encountered situations in practice. This instruction-like article starts from the constant ratio combinations and focuses on the basic analytical rationales, which will facilitate the researchers in understanding how to use Chou-Talalay method by answering ‘what’, ‘when’, ‘where’ and ‘why’ side by side, with explicit notes given in the CompuSyn Report (see Supplementary Materials). Similarly, the step-by-step experimental design and computerized analysis in animals in vivo and in clinical trials will be illustrated in our subsequent articles. Additionally, the theoretical basis of Chou-Talalay method as well as the derivation of equations and theorems can be found in details in previous published papers [1-3,5-8], thus they will not be illustrated in this article, but will be referred to when needed.
Background of fludelone (FD)
Epothilones, 16-membered macrolides isolated from a myxobacterium in soil, exert their antitumor effect similar as taxol, by stabilization of microtubule polymerization [9-11]. As the second-generation epothilones, Fludelone (FD) is not a multi-drug-resistant (MDR) substrate and, therefore, not cross-resistant to taxol or vinka-alkaloids such as vincreastine or vinblastine, and adriamycin [12]. FD, designed by the organic chemists at Memorial Sloan-Kettering Cancer Center via molecular editing and total synthesis, has emerged as a very promising therapeutic candidate in late preclinical investigations [12,13]. Our previous published data has demonstrated that treatment of nude mice bearing MX-1 human mammary carcinoma with optimal dose of FD (25 mg/kg for 6 hr i.v. infusion every 3 days, total six doses) led to complete tumor remission without any relapse in over 100 days and achieved de facto “cure” [12,13]. Other human xenograft tumors in nude mice treated with FD also achieved therapeutic cures including ovarian adenocarcinoma SK-OV-3, prostate adenocarcinoma PC-3 and colon carcinoma HCT-116 [12,13]. Some refractory tumor such as neuroblastoma SK-AN-S, lung carcinoma A549, and adriamycin-resistant MCF-7 breast cancer showed remarkable tumor suppression although not complete tumor remission post FD treatment [12,13]. Most impressively, FD achieved remission and cure against MX-1 mammary tumor at 30 mg/kg doses via oral administrations [13]. FD is much more water-soluble and can use Tween-80 plus ethanol formulation. By contrast, Taxol need the Cremophor formulation, which led to allergy in patients [12].
Background of panaxytriol (PXT)
A series of panoxytriol (PXT) derived polyacetylene small molecules have been shown moderate antitumor effect with promising general cytoprotective activity. As a main active ingredient of Panax ginseng C. A. Meyer, PXT-(3R, 9R, 10S) and its analogs showed multifaceted pharmacological effects [14,21,22]. This type of polyacetylenes alleviated the toxicities (e.g., body weight lose, peripheral neuropathy, lethality) induced by high therapeutic doses of Taxol, vinka alkaloids, epothilones, or 5-fluorouracil [14]. In addition, PXT compounds also reduced x-ray radiation induced body weight loss and lethality in mice [14]. Our recent single dose in vivo studies suggested that co-administration of a PXT-derived agent with cancer chemotherapeutics or radiation therapy may serve to mitigate a range of therapy-associated toxicities. It should be emphasized, however, that the single dose combination can never determine synergism or antagonism due to the lack of the mass-action law parameters, e.g., m and Dm values of each drug for the CI calculation [1,2,4-8]. Thus, based on our previous not-yet-reported data, we further conducted the quantitative drug combination synergism or antagonism analysis to examine a more detailed pharmacological interaction of FD and PXT against MX-1 breast cancer cells, using the 96-well microplate XTT assays as described previously for the single drug assay of both FD and PXT [9,12-14]. Herein, for the first time we display those results and those data will be served as an example of CI-method application and CompuSyn simulation.
Conceptual aspects and rationale of combinations
The two most important features of any useful drug are: i) High efficacy and ii) Low toxicity. Now, we have xenograft tumor “curative” compound, (FD) [12,13], and a broad-spectrum toxicity reducing agent, (PXT) [14], so the combination of these two would have added benefits, even if they only show additive effect, and very favorable consequences if they are synergistic.
It should be noted that the combination index theorem is entirely based on the physical, chemical and mathematical principles of the mass-action law, i.e., unified median-effect equation (MEE) [1,7,15] and the combination index equation (CIE) [1,8]. There have never been any artificial conditions or assumptions that have been added to the theory. Although the mechanisms of each drug are valuable to know, they are not essential for the synergism/antagonism determination. The conclusion of the combinational effect will still be the same regardless the units of each drug (e.g., µM, nM, or µg/ml) or the combination ratio (1:1000 for FD vs. PXT both in uM, or 1:1 if FD in nM, and PXT in μM as shown in the current example, Table 1). The computer takes only the “numbers” and analyzed with the programmed algorithms, without any external influences. However, the accuracy of the assays, experimental design [e.g., constant ratio or non-constant combination ratio(s), appropriate dose density and dose range, concurrent or sequential, etc] will dictate what type of conclusions can be feasibly drawn, and whether the conclusions drawn are reliable or acceptable (e.g., sufficiently high r values for the median-effect plot; in general, for in vitro experiments, the r value usually requires >0.95 be considered good or acceptable) [1].
Table 1.
Combination of Fludelone (FD) with Panaxytriol (PXT) against MX-1 cell growth in XTT assay in vitroa
| Compound | Fractional Inhibition (fa) | Parametersb | DRId | Comments/Conclusion | |||||
|---|---|---|---|---|---|---|---|---|---|
|
|
|
|
|||||||
| FD (nM) | PXT (µM) | m | Dm | r | CIc | [FD; PXT] | |||
| (D)1 | |||||||||
| 0.05 | 0.084 | m=0.619 | Dm=2.724 | r=0.992 | |||||
| 0.125 | 0.121 | ||||||||
| 0.25 | 0.220 | ||||||||
| 0.5 | 0.222 | ||||||||
| 1.25 | 0.358 | ||||||||
| 2.5 | 0.453 | ||||||||
| 5.0 | 0.631 | ||||||||
| 12.5 | 0.731 | ||||||||
| (D)2 | |||||||||
| 1.25 | 0.131 | m=2.600 | Dm=3.191 | r=0.993 | |||||
| 2.5 | 0.270 | ||||||||
| 5.0 | 0.635 | ||||||||
| 12.5 | 0.981 | ||||||||
| 25 | 0.995 | ||||||||
| 50 | 0.999 | ||||||||
| 0.5 | + | 0.5 | 0.322 | m=1.792 | Dm=2.456 (1.228+1.228) | r=0.976 | 0.821 [1.63; 4.79] | Slight synergism, Favorable dose reduction | |
| 1.25 | + | 1.25 | 0.514 | 0.804 [2.38; 2.61] | |||||
| 2.5 | + | 2.5 | 0.633 | 1.015 [2.63; 1.57] | |||||
| 5 | + | 5 | 0.878 | 0.810 [13.2; 1.36] | |||||
| 12.5 | + | 12.5 | 0.979 | 0.910 [105; 1.11] | |||||
| 25 | + | 25 | 0.994 | 1.078 [>105; 0.93] | |||||
| 50 | + | 50 | 0.999 | 0.842 [>105; 1.19] | |||||
| Simulation | Moderate synergism, Favorable dose reduction | ||||||||
| 0.50 | 0.836 [2.22; 2.60] | ||||||||
| 0.75 | 0.607 [7.09; 2.15] | ||||||||
| 0.90 | 0.607 [22.7; 1.78] | ||||||||
| 0.95 | 0.661 [50.0; 1.56] | ||||||||
This Table is constructed from the contents generated by CompuSyn Report (see Supplementary Materials).
Dose and effect data were obtained from the XTT assay [14] (average value of triplicate) and were subjected to CompuSyn [4] analysis.
Parameters were calculated from the median-effect equation and the median-effect plot [1,2,15]. M is slope, signifies shape; Dm is IC50 (FD in nM, PXT in µM), signifies potency; and r is linear correlation coefficient, signifies conformity.
The recommended combinations are usually at the constant ratio to allow the computerized simulations for various plots [1,2,16-18]. However, sometimes the non-constant ratio combinations allow special situations or practical purposes, for instance, one of the drug cannot use high doses due to severe or very undesirable toxicities; one of the drug is of limited supply or limited solubility; in vivo studies or in clinical trials that are limited by multiple data points [3,8]. It should be noted that for the non-constant ratio combinations (e.g., keep one drug at fixed concentration while varying the other(s), or combined at various mixed ratios, the CI value for each combination data point can still be calculated. As long as the m and Dm parameters are determined for each drug from the dose-effect plot and by using the CI equation and algorithm, the CI value can be calculated. The combination can have any number of data poin(s), including only one [1,2,19].
Experimental design
The prerequisite for synergism or antagonism determination is to know both the “potency” and the “shape” of the dose-effect curve for each drug. Therefore, it is necessary to calculate the does-effect parameters of each drug alone (m1, (Dm)1, m2 and (Dm)2) as well as in combination (m1,2, (Dm)1,2), and thereby determine the CI value. The above parameters can be easily and automatically determined from the median-effect equation using CompuSyn software (Available for free download from www.combosyn.com) [4]. The detailed information could be obtained from our previous published paper in regard to the principle of dose range selection, dose density and combination ratio decision [1-3].
Specifically to this example (Table 1), 8 data points of 0.05, 0.125, 0.25, 0.5, 1.25, 2.5, 5.0, 12.5 (nM), and 6 data points of 1.25, 2.5, 5.0, 12.5, 25, 50 (µM) were used to determine the dose-effect curve of FD and PXT, respectively. Regarding the optimal combination ratio for maximal synergy, the IC50 of FD and PXT were 5 nM and 5 μM, respectively, thus the recommended equipotency ratio (5/5=1:1) was used in the design of combination effect, insofar 0.5 nM+0.5 μM, 1.25 nM+1.25 μM, 2.5 nM+2.5 μM, 5 nM+5 μM, 12.5 nM+12.5 μM, 25 nM+25 μM, 50 nM+50 μM were used in combination analysis. It should be noted that in drug combination studies, the experiments for a single drug and its combinations should be carried out under the same experimental conditions to avoid variability caused by personnel changes, and agent or target inconsistency [3,8]. Additionally, unreliable outlier data point could be considered to drop before data being input into CompuSyn for analysis. However, if the outlier data located in the middle of the data points, repeating the experiment is suggested [3,8].
Computerized simulation by compuSyn
CompuSyn is available for downloading from www.combosyn.com, original price $399.00 (2005-2012); As a donation to the biomedical communities it was offered for free download upon registration, beginning at August 1, 2012; sponsored by ComboSyn Inc and PD Science LLC. As of 9/20/2015, there are a total 11,451 free downloads by bioscientists from 88 countries or territories. In addition, the FD and PXT combination has been included as one of the several examples verbally presented by T.C. Chou in the video demonstration at www.combosyn.com website. The present written report and the oral demonstration would complement each other to illustrate the details of the drug combination CI method.
Detailed procedures of automated dose-effect analysis for quantization/simulation of synergism or antagonism are given in the User’s Guide for CompuSyn [4]. The details of the actual CompuSyn analysis of FD+PXT combination and its Report are given in the Supplementary Materials. Additional notes, precautions, pit-falls, options, and interpretations have been given in the shaded areas on the right margins of the CompuSyn Report printout. Specifically, the sequential steps are summarized as follows.
Data entry
It takes 5-10 min to input the XTT results (the dose and corresponding effect for FD, PXT alone as well as FD+PXT combination) depending on the size of experiment. When entering each “dose” and effect “fa” pair, remember to click “enter” from the keyboard. Also, when the set of data for “each single drug” or “their combination” has been entered, remember to click “Finish” in the entry box in order to proceed [4].
Report generation
One will be asked to choose the items that will be included in the report [Such as Single Drug (sometimes may have more than 2 single drugs to be selected from, e.g., 3-drug combinations or more than two pair combinations); Drug Combos at Constant Ratio (There is an option for selection, when you enter the dose of D1, the doses of D2 and the total dose show up automatically since the ratio has already been entered), and Drug Combos at Non-constant ratios. (Each data point has its own ratio)]. Once the report has been created, it will automatically open in one’s default web browser. At this point, one is no longer in the CompuSyn application. To make changes to the selected choices previously made in the generated report, CompuSyn must be opened first and one must click on “Recall Experiment”.
Results presentation and report printing
The explicit details of the present study for FD+PXT combination have been presented in the CompuSyn Report (see Supplementary Materials). This computer generated complete report includes i) Experimental descriptions and assays; ii) Experimental design and crude data; iii) The dose-effect curves; iv) The median-effect plot; v) The m, Dm and r parameters; vi) The fa-CI table and Fa-CI plot; vii) The Fa-DRI table and the Fa-DRI plot, viii) The ED50-, ED75- and ED90-isobolograms; and ix) The summary of the findings. The results in iv) for the CI values and the viii) for the isobolograms are the experimental proof of synergism between FD and PXT. For the convenience of the first time users of the CI method, some notes, interpretations, precautions, options, and conclusions are given in the shaded boxes on the right-side of the page of the computer printout, which are specific to the items on the left-side. Additionally, Table 1 and Figure 1 were selected and re-organized as they are the simple ways to present the results effectively for illustration when the researchers actually display their results.
Figure 1.
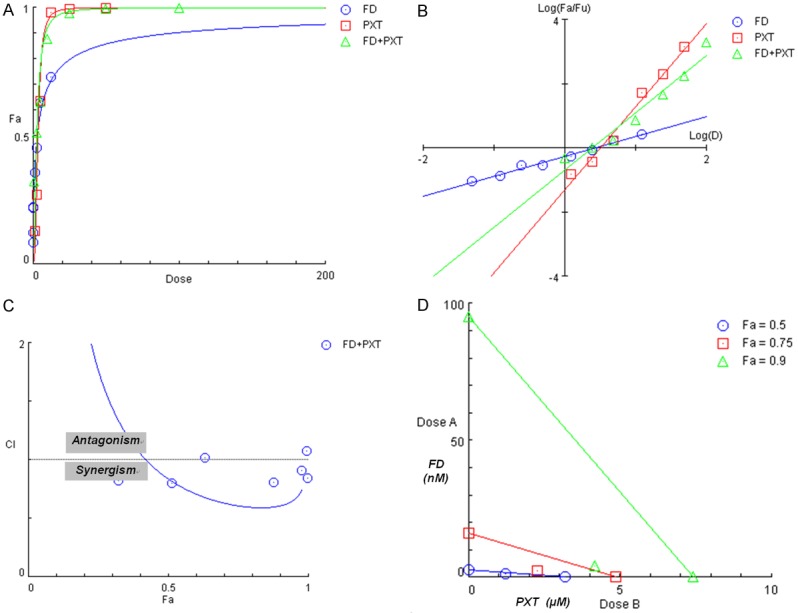
The graphic representations obtained from the CompuSyn Report for FD and PXT combinations (see Supplementary Materials). A. Dose-effect curves; B. Median-effect plot; C. Combination index plot; D. Isobolograms.
Discussions and conclusions
The present study indicates that FD and PXT are moderately synergistic with CI values ranging from 0.836 to 0.715 for fa=0.5~0.97 as indicated by the Fa-CI table and Fa-CI plot (i.e., when MX-1 growth was inhibited 50% to 97%) [see Figure 1C and CompuSyn Report simulation for the Fa-CI table, in Supplementary Materials]. These conclusions are summarized in Table 1 for the concise format of presentation. The results also showed favorable dose-reduction (DRI>1) as shown in the Fa-DRI table and Fa-DRI plot in the CompuSyn Report. The isobolograms, as shown at fa=0.5, 0.75 and 0.9 are given in Figure 1D.
The conclusions from Fa-CI plot and isobologram should be constant and identical since they are two-sides of the same coin where Fa-CI plot is effect-oriented, isobologram is dose-oriented, based on the same combination index theorem [1,3,6,7], which, in turn based on MEE [1,15] and CIE [1,6,7]. Thus, the computerized simulation and the construction are based on the same algorithm. However, whereas Fa-CI plot encompasses all effect levels (all fas), the isobologram usually consists of three or less fa levels (e.g. CompuSyn set isobols at fa=0.5, 0.75 and 0.9 as a default, see Figure 1C), since isobol is only a visual graphics. When isobols have too many effect levels, the graphics tent to be too crowded or too messy to read [3,6].
Since MEE and CIE are unified general theories obtained from over 300 derived reaction rate equations encompassing system analysis with different mechanism of both effectors and receptors (e.g., bullets and targets), the CI method is very general, flexible, and easy to use, including design (combination rations, dose range and dose density). Drug mechanisms are good to know, but not essential. Units of drugs can be defined to fit the purpose (e.g., μM, nm μg/ml, IU, etc). In the present study, FD is nm and PXT in µM, and both compounds have totally different mechanisms. FD is a microtubule stabilizer/fixer [12,13], and PXT has multifaceted mechanisms including moderate cytotoxicity and broad spectrum of cyto-protecting effects [14,21,22]. However, cytotoxicity on MX-1 cell growth is the common end-point of the measurement. It is expected that co-treatments of PXT with main anticancer compound such as FD would be especially favorable in vivo if they were synergistic, and even if only additive effect, would be very beneficial too.
Interestingly, our present study shows that synergy between FD and PXT is moderate with CI=0.836~0.715 for fa=0.50~0.97. These findings have unique significance, as FD is one of a few anticancer compounds that achieves complete tumor remission and no relapse for over 100 days against human mammary carcinoma xenograft (MX-1) in nude mice [12,13]. However, PXT, as a single agent, suppressed tumor growth in vivo only about 30~40% at optimal conditions. Thus, the moderate synergism of FD and PXT combination represents both desirable aims of ideal drug combination: i) Effective (high efficacy), and ii) Safe (low toxicity). In fact, in our preliminary therapeutic studies in vivo [16], Iso-fludelone (Iso-FD, a derivative of fludelone), as a single agents, achieved complete cure in 6 out of 6 colon carcinoma HCT-116 xenograft bearing nude mice at optimal conditions. Co-treatment of Iso-FD with PXTAI (a derivative of PXT), at 25 mg/kg 6 hr i.v. infusion every 12 days for 4 times, also resulted in 6 out of 6 tumor complete remission, but PXTAI cotreatment (10 mg/kg, i.v. injection, every 3 days for 3 times) significantly reduced body weight loss from 26% to 16% (P<0.05) [14].
The main features of Chou-Talalay’s CI method are: i) Derived equations and theory; ii) Established algorithms, iii) Automated computer simulation, iv) Flexibility in its use and v) Attains quantitative, index pharmaco-dynamic conclusions [1,3,16,19]. None of about 20 different synergism/antagonism evaluation methods in bio-medical literature of all time have all the above features. This is apparently the major reason why the MEE-based CI method is the most cited and the most widely cited drug combination analysis of all time (see Supplementary Table 1). When using the CI method, there are always possible rooms of flexibility for improvements or revisions in experimental design. However, the experimental design may dictate what kind or type of conclusions feasible to be obtained [1,3,16-18]. For example, constant ratio allows computerized simulation using m1,2 and (Dm)1,2 values as shown in the present study. However, for the non-constant ratio combinations, we can still determine synergism or antagonism using CI algorithm as long as we have m1, (Dm)1, m2 and (Dm)2 values [1,19,20].
Conclusively, the present studies in vitro showing synergy at broad dose ranges and broad effect ranges is consistent with the in vivo anticancer co-treatment at a given optimal specific dose and regimen of each compound. The consistency of conclusions obtained from the in vivo and in vitro studies support the general rationale of potentiality of co-treatment of the cytoprotective panaxytriol compound(s) with the microtubule targeting anticancer compounds in the therapy of cancer. Further studies in vivo are very much warranted.
Acknowledgements
This work was supported by NIH grant CA28524 and institutional Sloan-Kettering Institute general fund and core grant CA08748 (T.C.C).
Disclosure of conflict of interest
None.
Supporting Information
References
- 1.Chou TC. Theoretical basis, experimental design, and computerized simulation of synergism and antagonism in drug combination studies. Pharmacol Rev. 2006;58:621–681. doi: 10.1124/pr.58.3.10. [DOI] [PubMed] [Google Scholar]
- 2.Chou TC, Talalay P. Quantitative analysis of dose-effect relationships: the combined effects of multiple drugs or enzyme inhibitors. Adv Enzyme Regul. 1984;22:27–55. doi: 10.1016/0065-2571(84)90007-4. [DOI] [PubMed] [Google Scholar]
- 3.Chou TC. Drug combination studies and their synergy quantification using the Chou-Talalay method. Cancer Res. 2010;70:440–446. doi: 10.1158/0008-5472.CAN-09-1947. [DOI] [PubMed] [Google Scholar]
- 4.Chou TC, Martin N. ComboSyn Inc Paramus NJ. 2005. CompuSyn for drug combinations. pc software and user’s guide. [Google Scholar]
- 5.Chou TC, Motzer RJ, Tong Y, Bosl GJ. Computerized quantitation of synergism and antagonism of taxol, topotecan, and cisplatin against human teratocarcinoma cell growth: a rational approach to clinical protocol design. J Natl Cancer Inst. 1994;86:1517–1524. doi: 10.1093/jnci/86.20.1517. [DOI] [PubMed] [Google Scholar]
- 6.Chou TC. The mass-action law based algorithm for cost-effective approach for cancer drug discovery and development. Am J Cancer Res. 2011;1:925–954. [PMC free article] [PubMed] [Google Scholar]
- 7.Chou TC. The mass-action law based algorithms for quantitative econo-green bio-research. Integr Biol (Camb) 2011;3:548–559. doi: 10.1039/c0ib00130a. [DOI] [PubMed] [Google Scholar]
- 8.Chou TC. Frequently asked questions in drug combinations and the mass-action law-based answers. Synergy. 2014;1:3–21. [Google Scholar]
- 9.Chou TC, O’Connor OA, Tong WP, Guan Y, Zhang ZG, Stachel SJ, Lee C, Danishefsky SJ. The synthesis, discovery, and development of a highly promising class of microtubule stabilization agents: curative effects of desoxyepothilones B and F against human tumor xenografts in nude mice. Proc Natl Acad Sci U S A. 2001;98:8113–8118. doi: 10.1073/pnas.131153098. [DOI] [PMC free article] [PubMed] [Google Scholar]
- 10.Chou TC, Zhang XG, Balog A, Su DS, Meng D, Savin K, Bertino JR, Danishefsky SJ. Desoxyepothilone B: an efficacious microtubule-targeted antitumor agent with a promising in vivo profile relative to epothilone B. Proc Natl Acad Sci U S A. 1998;95:9642–9647. doi: 10.1073/pnas.95.16.9642. [DOI] [PMC free article] [PubMed] [Google Scholar]
- 11.Chou TC, Zhang XG, Harris CR, Kuduk SD, Balog A, Savin KA, Bertino JR, Danishefsky SJ. Desoxyepothilone B is curative against human tumor xenografts that are refractory to paclitaxel. Proc Natl Acad Sci U S A. 1998;95:15798–15802. doi: 10.1073/pnas.95.26.15798. [DOI] [PMC free article] [PubMed] [Google Scholar]
- 12.Chou TC, Dong H, Zhang X, Tong WP, Danishefsky SJ. Therapeutic cure against human tumor xenografts in nude mice by a microtubule stabilization agent, fludelone, via parenteral or oral route. Cancer Res. 2005;65:9445–9454. doi: 10.1158/0008-5472.CAN-05-1014. [DOI] [PubMed] [Google Scholar]
- 13.Chou TC, Zhang X, Zhong ZY, Li Y, Feng L, Eng S, Myles DR, Johnson R Jr, Wu N, Yin YI, Wilson RM, Danishefsky SJ. Therapeutic effect against human xenograft tumors in nude mice by the third generation microtubule stabilizing epothilones. Proc Natl Acad Sci U S A. 2008;105:13157–13162. doi: 10.1073/pnas.0804773105. [DOI] [PMC free article] [PubMed] [Google Scholar]
- 14.Chou TC, Dong H, Zhang X, Lei X, Hartung J, Zhang Y, Lee JH, Wilson RM, Danishefsky SJ. Multifaceted cytoprotection by synthetic polyacetylenes inspired by the ginseng-derived natural product, panaxytriol. Proc Natl Acad Sci U S A. 2011;108:14336–14341. doi: 10.1073/pnas.1111332108. [DOI] [PMC free article] [PubMed] [Google Scholar]
- 15.Chou TC. Derivation and properties of Michaelis-Menten type and Hill type equations for reference ligands. J Theor Biol. 1976;59:253–276. doi: 10.1016/0022-5193(76)90169-7. [DOI] [PubMed] [Google Scholar]
- 16.Zhang N, Dai L, Qi Y, Di W, Xia P. Combination of FTY720 with cisplatin exhibits antagonistic effects in ovarian cancer cells: role of autophagy. Int J Oncol. 2013;42:2053–2059. doi: 10.3892/ijo.2013.1906. [DOI] [PubMed] [Google Scholar]
- 17.Zhang N, Zhang H, Xia L, Zheng Y, Yu Y, Zhu Y, Chen G, Di W. NSC606985 induces apoptosis, exerts synergistic effects with cisplatin, and inhibits hypoxia-stabilized HIF-1alpha protein in human ovarian cancer cells. Cancer Lett. 2009;278:139–144. doi: 10.1016/j.canlet.2008.12.025. [DOI] [PubMed] [Google Scholar]
- 18.Zhang N, Wu ZM, McGowan E, Shi J, Hong ZB, Ding CW, Xia P, Di W. Arsenic trioxide and cisplatin synergism increase cytotoxicity in human ovarian cancer cells: therapeutic potential for ovarian cancer. Cancer Sci. 2009;100:2459–2464. doi: 10.1111/j.1349-7006.2009.01340.x. [DOI] [PMC free article] [PubMed] [Google Scholar]
- 19.Fu JN, Li J, Tan Q, Yin HW, Xiong K, Wang TY, Ren XY, Zeng HH. Thioredoxin reductase inhibitor ethaselen increases the drug sensitivity of the colon cancer cell line LoVo towards cisplatin via regulation of G1 phase and reversal of G2/M phase arrest. Invest New Drugs. 2011;29:627–636. doi: 10.1007/s10637-010-9401-y. [DOI] [PubMed] [Google Scholar]
- 20.Chou TC. Preclinical versus clinical drug combination studies. Leuk Lymphoma. 2008;49:2059–2080. doi: 10.1080/10428190802353591. [DOI] [PubMed] [Google Scholar]
- 21.Matsunaga H, Saita T, Nagumoa F, Mori M, Katano M. A possible mechanism for the cytotoxicity of a polyacetylenic alcohol, panaxytriol: inhibition of mitochondrial respiration. Cancer Chemother Pharmacol. 1995;35:291–296. doi: 10.1007/BF00689447. [DOI] [PubMed] [Google Scholar]
- 22.Halim M, Yee DJ, Sames D. Imaging induction of cytoprotective enzymes in intact human cells: coumberone, a metabolic reporter for human AKR1C enzymes reveals activation by panaxytriol, an active component for red ginseng. J Am Chem Soc. 2008;130:14123–14128. doi: 10.1021/ja801245y. [DOI] [PubMed] [Google Scholar]
Associated Data
This section collects any data citations, data availability statements, or supplementary materials included in this article.