

Abstract
Disturbed lipid metabolism is a well-established feature of human Alzheimer’s disease (AD). The present study used gas chromatography-mass spectrometry (GC-MS) analysis of fatty acid methyl esters (FAMES) to profile all detectable fatty acid (FA) species present in post-mortem neocortical tissue (Brodmann 7 region). Quantitative targeted analysis was undertaken from 29 subjects (n=15 age-matched controls; n=14 late-stage AD). GC-MS analysis of FAMES detected a total of 24 FAs and of these, 20 were fully quantifiable. The results showed significant and wide ranging elevations in AD brain FA concentrations. A total of 9 FAs were elevated in AD with cis-13,16-docosenoic acid increased most (170%; P=0.033). Intriguingly, docosahexanoic acid (DHA; C22:6) concentrations were elevated (47%; P=0.018) which conflicts with the findings of others (unaltered or decreased) in some brain regions after the onset of AD. Furthermore, our results appear to indicate that subject gender influences brain FA levels in AD subjects (but not in age-matched control subjects). Among AD subjects 7 FA species were significantly higher in males than in females. These preliminary findings pinpoint FA disturbances as potentially important in the pathology of AD. Further work is required to determine if such changes are influenced by disease severity or different types of dementia.
Keywords: Fatty acid, GC-MS, AD, brain tissues, DHA
Introduction
Alzheimer’s disease (AD) is a neurodegenerative disorder characterised by progressive memory loss and deteriorating cognitive abilities in older populations. Currently dementia affects 820,000 people in the UK [1] and recent global projections suggest that the number of people affected by AD will triple to 115 million by the year 2050 [2]. The main pathological hallmarks of AD are the accumulation of β-amyloid plaques, and neurofibrillary tangles [3,4]. Despite numerous studies that have been conducted on these two histological features, the cause, onset and development of the disease needs to be fully elucidated. Current therapeutic options temporarily slow the progression of symptoms for approximately 6-12 months but no disease-modifying treatments are currently available [5]. Lipid profiling (lipidomic) techniques are increasingly being used to study AD in the hope of finding new mechanistic insights or novel diagnostic biomarkers [6]. The application of lipidomic tools can reveal alterations in lipid metabolism [6-8], lipid-mediated signaling processes [6,9,10], biochemical interaction with other lipids, proteins and metabolites [11,12]; and ultimately these techniques could lead to new discoveries in terms of disease pathogenesis and pharmacological targets [13,14].
Recent lipid profiling studies of AD brain and plasma reveal that many, if not all, classes of lipids are affected by AD. Nitsch et al. [15] reported aberrant lipid metabolism and perturbed lipid composition in post-mortem brain tissue from pathologically confirmed AD cases. They described a global decrease in the concentration of phosphatidylcholine (PC) and increased levels of PC deacylation products [15]. Others have reported decreases of up to 40% in the levels of plasmalogen-phosphatidylethanolamine (p-PE) in white brain matter in the early stages of AD [16]. There is increasing epidemiological and molecular evidence indicating that cholesterol plays a role in the initiation and/or progression of AD [17,18]. Evidence suggests that disturbed cholesterol metabolism and hypercholesterolemia are important factors in amyloid plaque formation and tau hyperphosphorylation [17]. Plasma levels of desmosterol (a precursor to cholesterol) have been suggested as a potential AD biomarker and correlates closely to Mini-Mental State Examination scores of AD subjects [19]. Other investigations report significant depletions in plasma sphingomyelin and increased levels of ceramide in AD patients, with the ratio of ceramides to sphingomyelins reported to be much more discriminatory in determining AD cases from controls than lipid-type alone [20]. Recent findings suggest significant depletions in plasma levels of 10 particular lipid molecules (including species of PCs, lyso-PCs, and acetylcarnitines) of individuals with mild cognitive impairment (MCI) at short-term risk of developing AD [21].
A review of the scientific literature indicates that only a small number of studies have examined changes in the brain FA complement following onset of AD. 50% of the neuronal membrane is composed of polyunsaturated fatty acids (PUFA) [22]. These FA are shown to be incorporated into critical membrane phospholipids and secondary signaling messengers that modulate neuronal well-being, oxidative stress and inflammation [22]. PUFAs in the brain include both long chained Omega-3 and Omega-6 FA. Several studies have shown that an Omega-3 PUFA, in particular docosahexanoic acid (DHA) has an anti-inflammatory effect within the brain [23]. High dietary intake of DHA is correlated with lower risk of developing neurological disorders such as AD, Parkinson’s disease and major depression [24,25]. In addition, aged mice supplemented with DHA and EPA (eicosapentaenoic acid) were found to attenuate pro-inflammatory cytokine expression and astrogliosis as well as restoring spatial memory deficits in the hippocampal region [26]. While omega-3 FAs assist in providing neuroprotective functions in aged and diseased brain, omega-6 FAs are known to result in the production of pro-inflammatory cytokines from arachidonic acid (AA). Studies have indicated that increased levels of pro-inflammatory cytokines and activation of neutrophils were detected as a result of eicosanoid synthesis from enzymatic activity of cyclooxygenase and lipooxygenase on AA [27].
The present study describes a targeted quantitative method for profiling FAs in post-mortem human brain tissue (Brodmann 7 region) from late-stage AD patients and healthy, non-demented, age-matched control subjects. The aims were to: 1) use GC-MS to quantify and identify all the detectable FA present in post-mortem human brain tissue; and 2) to determine which of the FA were most significantly affected.
Methods
Reagents and analytical standards
Fatty acid standards: myristic acid methyl ester (C14:0), pentadecanoic acid methyl ester (C15:0) (PDA), palmitic acid methyl ester (C16:0), palmitoleic acid methyl ester (C16:1Δ9), margaric acid methyl ester (C17:0), cis-10-heptadecanoic acid methyl ester (C17:1Δ10), stearic acid methyl ester (C18:0), elaidic acid methyl ester (t-C18:1Δ9), oleic acid methyl ester (C18:1Δ9), linolelaidic acid methyl ester (t-C18:2Δ9,12), linoleic acid methyl ester (C18:2Δ9,12), arachidic acid methyl ester (C20:0), linolenic acid methyl ester (C18:3Δ9,12,15), heneicosanoic acid methyl ester (C21:0), all-cis-11,14,17-eicosatrienoic acid methyl ester (C20:3Δ11,14,17), arachidonic acid methyl ester (C20:4Δ5,8,11,14), all-cis-13,16-docosadienoic acid methyl ester (C22:2Δ13,16), lignoceric acid methyl ester (C24:0), nervonic acid methyl ester (C24:1Δ16,15), docosahexanoic acid methyl ester/DHA (C22:6Δ4,7,10,13,16,19), gondoic acid methyl ester (C20:1), all-cis-8,11,14-eicosatrienoic acid methyl ester (C20:3Δ8,11,14), erucic acid methyl ester (C22:1Δ13), all-cis-5,8,11,14,17-eicosapentaenoic acid methyl ester/EPA (C20:5Δ5,8,11,14,17), lauric acid methyl ester (C12:0), were all purchased from Sigma Aldrich (UK). Solvents including; methanol, n-Hexane and dichloromethane (DCM) were all CHROMASOLV grade for HPLC use and were bought from Sigma Aldrich (UK). Hydrogen chloride (1.25 M) in methanol was purchased from Fluka Analytical (UK).
Brain tissue samples
Brain tissue for this study (Brodmann 7 region, neocortex region, n=15 Controls; n=14 AD) was provided by the Newcastle Brain Tissue Resource which is part of the Brains for Dementia Research (BDR) project. We selected the parietal cortex (Brodmann 7) region as it not the primary site of AD pathology. Studies have shown that FA composition of the parietal cortex is much less affected than other brain regions such as the frontal or temporal cortex [28]. Sample details including Braak stage, age, gender and post mortem delay can be found in Table 1.
Table 1.
Descriptive characteristics of the study population by group. Age and post-mortem delay are presented as mean (±SEM)
| Age-matched control (n=15) | Late-stage AD (n=14) | |
|---|---|---|
| Age (years) | 77.9±3.03 | 86±1.89 |
| Female/Male | 11/4 | 6/8 |
| Post-mortem delay (hours) | 45.3±6.96 | 45.2±6.25 |
| Braak Stage, n (0/1/2/3/4/5/6) | (3/2/6/3/1/0/0) | (0/0/0/0/0/2/12) |
Frozen tissue samples were initially lyophilized and milled to a fine powder using the Freezer/Mill-cryogenic grinder (Model 6850, SPEX Sample PREP, UK). The use of liquid nitrogen throughout the milling process, avoids heat generation which often results in protein denaturation, or inadvertent increase of amino acids and changes in concentration of metabolites in the brain tissue samples. Once milled, all samples were stored at -80°C. The brain samples were extracted using the modified version of the Folch extraction procedure [29]. Briefly, 50 mg (±0.5 mg) tissue samples were mixed thoroughly in 1 ml of 50% methanol:water in a 2 ml sterile eppendorf tube using a Merris minimix paint-shaker for 10 min then sonicated for 15 min before centrifugation at 16,000 g at 4°C for 20 min. The supernatant was kept and used to separately investigate the polar metabolome (as described by Graham et al. [5]). The remaining pellet (which contained >95% of the lipid content) was stored in a -20°C freezer for 6 months and subsequently under went FA profiling. Lauric acid (C12:0) was selected as an internal standard because it was identified as being completely absent from all the samples. Lauric acid was added to each pellet (100 ng/uL) then FA were extracted in 1 ml of DCM (dichloromethane), transferred to sterile tubes and evaporated to dryness. FA were derivatised to fatty acid methyl esters (FAMEs) by reconstitution in 2 ml hydrogen chloride (1.25 M) in methanol (HCL:MeOH) and heated for 1 h at 100°C. Samples were then cooled and 1 ml of water was added. The FAMEs were extracted in 1 ml of hexane and subsequently analyzed using an Agilent GC (model 7890, Delaware, USA) coupled to an MS detector (Agilent model 5975C, Delaware, USA). Throughout the experiment, all samples were kept at 4°C to avoid denaturation of metabolic products.
GC-MS analysis
Samples were injected (inlet temp 220°C, split-mode ratio of 15:1) onto a CP-Sil88 fused silica capillary column (100 m x 0.25 mm x 0.25 μm) (Agilent, UK) with helium as carrier gas at a constant flow of 1 ml/min. The initial temperature gradient started at 100°C, increasing at 4°C/min to 220°C and was then held for 5 min. Following this, the gradient increased at 4°C/min to 240°C and was held for 8 min. The Mass Selective Detector (MSD) operated at 70eV in dual Scan/Selected Ion monitoring (SIM) mode the Source temp was 230°C the Quad temp 150°C and the Interface temp 225°C. The full scan ranged from m/z 50-550, whilst SIM mode targeted the molecular ion and another appropriate ion selected from the fragmentation pattern, each ion having a dwell time of 100 ms. All detectable FAMEs were confirmed using purchased analytical-grade standards and led to targeted analysis involving 24 FA. The quantification was based on a linear regression model formed from five point scaling factors of individual fatty acid methyl esters that were either conducted at a low (0-20 ng/ml) or high concentration range (0-300 ng/ml). The GC-MS was initially auto-tuned using PTFBA and the built-in MSDCHEM software to check the efficiency of the machine prior to running the experiment. Lauric acid was used as both the internal standard control for all the fatty acids as well as a measuring standard to detect changes in injection volume for all the extracted samples. Hexane was used as blank in the experiment. FA concentrations are reported as (g/kg post-mortem (PM) human brain dry weight) and corrected to the internal standard. Fatty acids with calibration curves of poor linearity (R2 ≤ 0.9) were not quantified.
Data analysis
Integration and quantitation of individual FA peaks from the GC-MS analysis was done using the MSD ChemStation Software (Agilent Technologies, USA). A one-tailed homoscedastic Student’s T-test was undertaken to calculate the significant differences (Microsoft Excel, US). Results are presented as mean values ± standard deviation (SD). Graphical representations were produced using Prism (GraphPad 5.0, California, USA).
Results
A number of changes in FA concentrations in the neocortex region (Brodmann area 7) of AD patients were observed compared with Controls. Figure 1 shows a typical Total Ion Chromatogram (TIC) of brain FAMEs following separation on a CP-Sil88 column. Out of 24 individual FA that were detectable in both groups, 20 were accurately quantified, of which 9 were significantly different (p<0.05) between AD patients and healthy age-matched controls (Table 2). There was a general trend towards increased FA levels in AD samples, however the total FA levels did not differ between groups (P=0.058). All the measured FA are listed as Table 2 and include the 9 FA found to be significantly different between AD and controls.
Figure 1.
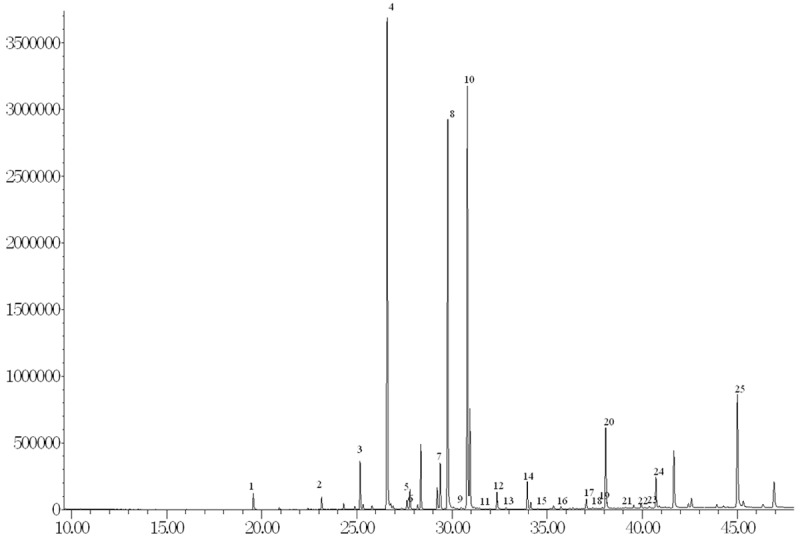
GC-MS detection of brain FA. Peaks were postiviely identified as: 1. lauric acid, 2. myristic acid, 3. pentadecanoic acid, 4. palmitic acid, 5. palmitoleic acid, 6. heptadecanoic acid, 7. cis-10-heptadecanoic acid, 8. stearic acid, 9. elaidic acid, 10. oleic acid, 11. linolelaidic acid, 12. linoleic acid, 13. arachidic acid, 14. cis-11-eicosanoic acid, 15. linolenic acid, 16. heneicosanoic acid, 17. cis-8,11,14-eicosatrienoic acid; 18. erucic acid, 19. cis-11,14,17-eicosatrienoic acid, 20. arachidonic acid, 21. cis-13,16-docosadienoic acid, 22. lignoceric acid, 23. Eicosapentanoic acid 24. nervonic acid, 25. Docosahexaenoic acid.
Table 2.
FA measurements in post-mortem brain samples of Brodmann 7 region from Control and late-stage AD subjects
| Fatty Acid | Lipid No. | RT | R2 | Mass | Control (n=15) | AD (n=14) | P-Value |
|---|---|---|---|---|---|---|---|
| Myristic acid | C14:0 | 23.16 | 0.987 | 242.22 | 0.022±0.107 | 0.268±0.068 | 0.085 |
| Pentadecanoic acid | C15:0 | 24.91 | 0.991 | 256.42 | 0.043±0.023 | 0.058±0.020 | 0.035* |
| Palmitic acid | C16:0 | 26.60 | 0.991 | 270.45 | 8.914±3.995 | 11.18±2.588 | 0.042* |
| Palmitoleic acid | C16:1Δ9 | 27.77 | 0.991 | 268.43 | 4.561±2.834 | 6.349±2.168 | 0.034* |
| Heptadecanoic acid | C17:0 | 28.21 | 0.989 | 284.48 | 0.091±0.049 | 0.124±0.040 | 0.029* |
| cis-10-heptadecenoic acid | C17:1Δ10 | 29.30 | 0.989 | 282.46 | 0.539±0.405 | 0.716±0.267 | 0.090 |
| Stearic acid | C18:0 | 29.79 | 0.986 | 298.50 | 8.390±4.097 | 10.65±2.788 | 0.048* |
| Elaidic acid | t-C18:1Δ9 | 30.71 | 0.986 | 296.49 | 5.392±2.662 | 7.639±3.242 | 0.025* |
| Oleic acid | c-C18:1Δ9 | 30.82 | 0.988 | 297.49 | 7.968±4.179 | 9.781±3.243 | 0.103 |
| Linolelaidic acid | t-C18:2Δ9,12 | 31.29 | 0.986 | 294.47 | 0.030±0.013 | 0.031±0.014 | 0.425 |
| Linoleic acid | c-C18:2Δ9,12 | 32.38 | 0.987 | 294.47 | 0.337±0.196 | 0.407±0.176 | 0.160 |
| Arachidic acid | C20:0 | 32.85 | 0.973 | 326.56 | 0.050±0.028 | 0.060±0.023 | 0.145 |
| Linolenic acid | C18:3Δ9,12,15 | 34.20 | 0.987 | 294.26 | 0.762±0.369 | 0.874±0.314 | 0.194 |
| Heneicosanoic acid | C21:0 | 34.39 | 0.974 | 340.58 | 0.023±0.005 | 0.021±0.003 | 0.167 |
| all-cis-11,14,17-eicosatrienoic acid | C20:3Δ11,14,17 | 28.93 | 0.917 | 320.51 | 0.173±0.198 | 0.319±0.204 | 0.031* |
| Arachidonic acid | C20:4Δ5,8,11,14 | 38.08 | 0.983 | 318.49 | 1.929±1.322 | 2.582±0.934 | 0.069 |
| all-cis-13,16-docosadienoic acid | C22:2Δ13,16 | 38.89 | 0.946 | 350.58 | 0.021±0.031 | 0.045±0.038 | 0.033* |
| Lignoceric acid | C24:0 | 39.55 | 0.965 | 382.66 | 2.317±1.461 | 2.370±1.220 | 0.458 |
| Nervonic acid | C24:1Δ15 | 40.68 | 0.968 | 380.65 | 0.664±0.504 | 0.724±0.724 | 0.398 |
| Docosahexanoic acid | C22:6Δ4,7,10,13,16,19 | 45.01 | 0.925 | 342.51 | 4.897±2.810 | 7.215±2.818 | 0.018* |
| Gondoic acida | C20:1Δ11 | 34.04 | 0.475 | 324.54 | |||
| all-cis-8,11,14-eicosatrienoic acida | C20:3Δ8,11,14 | 37.05 | 0.745 | 320.51 | |||
| Erucic acida | C22:1Δ13 | 35.60 | 0.267 | 352.59 | |||
| Eicosapentanoic acida | C20:5Δ5,8,11,14,17 | 39.85 | 0.019 | 316.24 | |||
| Lauric acid (internal standard) | C12:0 | 19.57 | 0.996 | 214.34 | |||
| Total FA content | 47.12±25.29 | 61.41±20.90 | 0.058 | ||||
FA concentrations (g/kg dry weight) are displayed as mean ± SD.
p<0.05 for Control vs AD.
FA not quantified due to poor calibration curves (R2 less than 0.9).
Figure 2 shows those FA which are significantly different between AD and control samples. It highlights that AD tissue has higher concentrations of cis-13,16-docosadienoic acid (170%), cis-11,14,17-docosatrienoic acid (132%), docosahexanoic acid (DHA) (47%), elaidic acid (41%), palmitoleic acid (39%), heptadecanoic acid (36%), pentadecanoic acid (35%) and palmitic acid (25%) when compared with control PM brain tissue. Despite numerous reports which have shown a significant decrease or unaltered levels of DHA in different brain regions, our accurately quantified results have found DHA at significantly (p<0.05) higher concentrations in AD patients (47%) (Figure 2). When PM human brain tissue from male and female specimens are compared for both AD and control samples it was found that 7 FA were found at significantly (p<0.05) higher concentrations in male AD tissue (Table 3). These included cis-13,16-docosadienoic acid (170%), myristic acid (35%), stearic acid (33%), and palmitic acid (33%) as displayed in Figures 3 and 4.
Figure 2.

FAs (g/kg) significantly altered between Control and AD. A total of 9 brain FFA from the 24 measured (Table 1) were significantly elevated in late-stage AD. FFA concentrations are displayed as mean ± SD. *p<0.05 was deemed statistically significant.
Table 3.
FA concentrations (g/kg dry weight) in post-mortem brain samples of Brodmann 7 region of Control and late-stage AD, male and female subjects
| Fatty Acid | Lipid No. | Control | AD | ||||
|---|---|---|---|---|---|---|---|
|
| |||||||
| Male (n=4) | Female (n=11) | P-value | Male (n=8) | Female (n=7) | P-value | ||
| Myristic acid | C14:0 | 0.252±0.106 | 0.208±0.111 | 0.254 | 0.301±0.058 | 0.223±0.055 | 0.013* |
| Pentadecanoic acid | C15:0 | 0.052±0.018 | 0.040±0.025 | 0.192 | 0.066±0.016 | 0.049±0.022 | 0.058 |
| Palmitic acid | C16:0 | 9.368±3.152 | 8.479±4.388 | 0.401 | 12.54 ±1.225 | 9.373±2.903 | 0.008* |
| Palmitoleic acid | C16:1Δ9 | 5.438±2.152 | 4.242±3.072 | 0.245 | 6.637±2.294 | 5.966±2.131 | 0.294 |
| Heptadecanoic acid | C17:0 | 0.104±0.039 | 0.086±0.053 | 0.278 | 0.141±0.023 | 0.102±0.048 | 0.035* |
| cis-10-Heptadecenoic acid | C17:1Δ10 | 0.596±0.403 | 0.519±0.424 | 0.378 | 0.777±0.186 | 0.634±0.349 | 0.170 |
| Stearic acid | C18:0 | 8.799±3.400 | 8.241±4.466 | 0.413 | 11.92±1.231 | 8.953±3.471 | 0.022* |
| Elaidic acid | t-C18:1Δ9 | 5.154±3.350 | 5.478±2.554 | 0.422 | 8.313±3.132 | 6.739±3.449 | 0.195 |
| Oleic acid | c-C18:1Δ9 | 8.201±3.579 | 7.884±4.537 | 0.451 | 10.95±2.726 | 8.224±3.441 | 0.062 |
| Linolelaidic acid | t-C18:2Δ9,12 | 0.023±0.010 | 0.032±0.014 | 0.141 | 0.030±0.016 | 0.032±0.012 | 0.413 |
| Linoleic acid | c-C18:2Δ9,12 | 0.379±0.189 | 0.322±0.206 | 0.320 | 0.489±0.185 | 0.299±0.088 | 0.020* |
| Arachidic acid | C20:0 | 0.054±0.031 | 0.048±0.028 | 0.369 | 0.065±0.016 | 0.053±0.030 | 0.177 |
| Linolenic acid | C18:3Δ9,12,15 | 0.918±0.542 | 0.705±0.300 | 0.171 | 0.962±0.290 | 0.757±0.332 | 0.121 |
| Heneicosanoic acid | C21:0 | 0.021±0.002 | 0.023±0.006 | 0.266 | 0.021±0.003 | 0.021±0.003 | 0.355 |
| all-cis-11,14,17-eicosatrienoic acid | C20:3Δ11,14,17 | 0.204±0.198 | 0.162±0.206 | 0.363 | 0.371±0.159 | 0.249±0.248 | 0.142 |
| Arachidonic acid | C20:4Δ5,8,11,14 | 1.915±0.580 | 1.935±1.532 | 0.490 | 3.014±0.777 | 2.006±0.851 | 0.020* |
| all-cis-13,16-Docosadienoic acid | C22:2Δ13,16 | 0.017±0.021 | 0.022±0.035 | 0.400 | 0.062±0.038 | 0.023±0.027 | 0.026* |
| Lignoceric acid | C24:0 | 2.303±1.693 | 2.322±1.459 | 0.492 | 2.531±0.930 | 2.154±1.600 | 0.294 |
| Nervonic acid | C20:5Δ5,8,11,14,17 | 0.700±0.280 | 0.651±0.576 | 0.438 | 0.769±0.796 | 0.664±0.683 | 0.400 |
| Docosahexanoic acid | C22:6Δ4,7,10,13,16,19 | 3.821±2.826 | 5.288±2.834 | 0.196 | 7.646±2.892 | 6.641±2.870 | 0.265 |
FA concentrations are displayed as mean ± SD.
p<0.05 Control vs AD.
Figure 3.

FA (g/Kg) significantly altered between male and female subjects with late-stage AD. The concentrations of 7 brain FFA were significantly affected by gender in AD subjects FA concentrations are displayed as mean ± SD. *p<0.05 was deemed statistically significant.
Figure 4.

Box-and-whisker plots of FA (g/Kg) significantly altered between male and female subjects with late-stage AD. The concentrations of 7 brain FA were significantly affected by gender in AD subjects FA concentrations are displayed as mean ± SEM. *p<0.05 was deemed statistically significant.
Discussion
This study has comprehensively quantified FAs detectable by GC-MS in human post-mortem brain tissue from AD and control patients. Having established the FA composition of PM brain tissue, detailed quantification studies were conducted across the tissue samples from 29 subjects, comprising 14 individuals with late-stage AD and 15 age-matched control subjects. The findings indicate that the FA complement of brain neocortex tissue is profoundly affected by late-stage AD (Braak stages 5-6). A general trend towards increased concentrations of a wide range of FAs was observed in AD tissue. Of the 24 detectable fatty acids 20 were accurately quantified, and of these 9 were significantly different between AD patients and healthy non-demented age-matched controls. Samples from late-stage AD subjects had higher concentrations of cis-13,16-docosadienoic acid (170%), cis-11,14,17-docosatrienoic acid (132%), docosahexanoic acid (DHA) (47%), elaidic acid (41%) palmitoleic acid (39%), heptadecanoic acid (36%), pentadecanoic acid (35%) and palmitic acid (25%) compared with controls (Figure 2). Previous reports found DHA levels to be either significantly decreased (mid-frontal and superior temporal cortex) [30] or unaltered (frontal, temporal and parietal neocortex) [31] in AD subjects. However, we report DHA concentrations to be significantly higher in the Brodmann 7 region of AD PM brain tissue (47%).
A particularly noteworthy aspect of our findings was the influence that subject gender had on FA concentrations in AD tissue. Analysis of brain tissue from male and female specimens found that 7 FAs were significantly higher in male AD subjects (Table 3). These included cis-13,16-docosadienoic acid (170%), linoleic acid (63%), arachidonic acid (50%), heptadecanoic acid (37%), myristic acid (35%), stearic acid (33%), and palmitic acid (33%; Figure 3). This could indicate that the lipidome of male and female subjects responded differently to the development of AD pathology. However, these findings should be treated with caution given the relatively small sample size (n=8 male AD; n=7 female AD). Despite this, it is worth noting that in healthy subjects no significant FA changes were observed and therefore further examination of gender-related differences in brain FA in AD is warranted. Whilst the reason for such differences are yet to be determined, the study of FA compositions in different regions of the brain thus far has yet to record any association between FA and gender [28] making the first time this has been reported.
Omega-3 and -6 (n-3/n-6) (linolenic and linoleic) FAs are essential fatty acids [32,33]. They are obtained from the diet given that the human body cannot naturally synthesize them and act as precursors for the synthesis of other fatty acids through a series of saturation and elongation reactions [32]. Both n-3 and n-6 FAs have been implicated in the modulation of brain inflammatory processes [34-38]. The significant increase in cis-13,16-docosadienoic concentrations observed here could form part of an anti-inflammatory response to the development of AD. Inflammation is one of many hallmarks of AD as found in a number of different studies including elevated levels of pro-inflammatory cytokines and activated microglia in AD patients [39,40]. Fatty acids such as arachidonic acid (AA; C20:4), eicosapentanoic acid (EPA; C20:5) and DHA are thought to modulate the severity and duration of AD inflammatory processes [41,42]. These fatty acids exert their inflammatory function through their conversion to potent eicosanoids such as prostaglandins, thromboxanes and leukotrienes (by AA), or resolvins and docosatrienes (by EPA and DHA) by means of cyclooxygenase (COX) and/or lypooxygenase (LOX) enzymes [32,33]. Eicosanoids derived from AA are normally pro-inflammatory. Studies have indicated that increased levels of pro-inflammatory cytokines and activation of neutrophils were detected as a result of eicosanoid synthesis from enzymatic activity of COX and LOX on AA [27]. In the present study neither AA nor EPA significantly differed between AD and control subjects. However, if only male AD patients and male controls were compared AA was significantly (P<0.05) higher. Increased levels of cis-13,16-docosadienoic concentrations could provide neuroprotection by blocking COX enzyme activity [34]. Henry et al. [43] investigated fatty acids for COX inhibition, finding cis-13,16-docosadienoic acid and two other fatty acids to be potent inhibitors [43]. This supports the notion that cis-13,16-docosadienoic acid could be part of an anti-inflammatory mechanism to reduce the severity of inflammation in AD.
Reported studies are somewhat conflicting regarding the relationship between DHA levels and AD. Two studies reported brain DHA to be unchanged in AD [31] and another found it to be lower [30,44]. Here we observed a 47% increase in DHA in AD subjects (Figure 2). Although the reason is as yet unclear it could, similar to cis-13,16-docosadienoic acid, be part of a protective mechanism against AD-induced damage. Recent studies show that a derivative of DHA, neuroprotectin D1 (NPD1) down-regulates beta-amyloid (1-42 triggered gene expression of COX-2) n HNG cells [45]. It has also been reported that NPD1 affects beta-amyloid precursor protein processing thus reducing beta-amyloid (1-42) synthesis [46]. Other LOX-mediated DHA derivatives such as 17S-resolvins have been shown to reduce infiltration of leukocyte and glial cell migration as well as their respective cytokine production [47].
There are several potential explanations for increases in the brain levels of some FAs. Firstly this could stem directly from the considerable loss of brain mass and marked changes in the populations of cell types which occurs in late-stage AD. Notably in AD there is an increased loss of neurons with a concomitant increase in the levels of astrocytes that ordinarily provide numerous levels of support to neurons. Thus increases in the levels of some FAs could relate to the relatively greater number of astrocytes present in AD tissue following severe neuronal loss. Therefore, one could hypothesize that the elevated FA concentrations as reported herein are found to a greater extent in astrocytes. Secondly, the relative increase in brain FA content observed here in late-stage AD could arise from processes occurring within the small amount of white matter present in each specimen. Increase in FA concentrations may also result from ceramide accumulation due to the activation of the sphingomyelinase in oligodendrites which is induced by enhanced beta-amyloid peptide levels [48]. Interestingly, our findings correlate with another study which analysed FA in white matter tissue which reported elevated concentrations of palmitoleic acid and erucic acid [49].
Increased concentrations of other FA observed here may be responsible for detrimental effects on the brain. For example, both palmitic acid and stearic acid have been reported to induce hyperphosphorylation of tau proteins and elevate the expression of β-secretase activity in embryonic rat cortex cultures [50]. Palmitic acid is known to reduce the viability of neuronal stem cells and increase apoptotic activity [10]. Furthermore, elaidic acid (a ‘trans’ fatty acid) appears to drive the oligomerization and aggregation of beta-amyloid, potentially aggravating the severity of AD [51]. In conjunction with other brain regions that have been studied, palmitoleic acid was found to be increased in concentration in the Brodmann 7 region of AD patients. Astarita et al. reported an increase in the same fatty acid concentrations in the hippocampal and the mid frontal cortex regions of the brain when controls were compared with AD patients [44]. It is also interesting to note that in the same study, nervonic acid was found to be significantly higher in AD samples in the 3 various brain regions being studied (mid frontal, hippocampal, and the temporal cortexes) [44]. This finding however was in contrast to our results as no significant difference (p<0.05) was detected. The increase in nervonic acid and several other fatty acid concentrations in those regions were most likely due to an increased stearoyl-Coa desaturase activity [44].
It is important for the authors to point out the potential limitations of this preliminary investigation. Firstly, although we attempted to closely age-match the subjects there is a significant difference between groups (P=0.034). Secondly, the gender balance of control subjects and AD subjects is not uniform. There is potential for age and gender to influence the levels of individual fatty acids. Both of these confounding factors should be taken into consideration when interpreting the findings.
In conclusion, this study has profiled, identified and quantified the widest range of FA detected in the Brodmann area 7 brain region of post-mortem human brain tissue. Significant alterations in several FA were observed in late-stage AD. The dramatically increased levels of cis-13,16-docosadienic acid and DHA in AD could be part of a neuroprotective anti-inflammatory response to AD. Other FA elevations could play a role in driving or exacerbating the disease pathogenesis. In addition, our study exhibited the first gender specific differences with regards to brain FA concentrations, indicating a tendency for FA to be higher in male AD tissue than in female AD tissue, a finding which must be further investigated in studies with larger sample sizes. This study provides an insight into changes in lipid metabolism occurring late into the development of AD, but it will be necessary to investigate specimens earlier in the pathogenesis of AD and also from other types of dementia in order to ascertain whether brain FA changes are generalized responses to brain inflammation or a consequence of neuronal cell death.
Acknowledgements
We would like to thank Dr. H. Rachael Hill for her invaluable assistance, both for her help with the sample preparation and mass spectral analyses. Studies into Alzheimer’s disease have been supported by grants from Alzheimer’s Research UK [ARUK-NCH2012B-5; ARUK-PPG2011B-8 and ARUK-Network2012-11]. The authors’ work is also supported by a Proof of Concept grant from Invest Northern Ireland [INI-PoC406]. Brain tissue used was provided by the Newcastle Brain Tissue Resource which is funded in part by a grant from the UK Medical Research Council (G0400074), by NIHR Newcastle Biomedical Research Centre and Unit awarded to the Newcastle upon Tyne NHS Foundation Trust and Newcastle University, and by a grant from the Alzheimer’s Society and Alzheimer’s Research Trust as part of the Brains for Dementia Research Project.
References
- 1.ARUK, Dementia Statistics. http://www.alzheimersresearchuk.org/dementia-statistics/2014.
- 2.Prince M, Bryce R, Albanese E, Wimo A, Ribeiro W, Ferri CP. The global prevalence of dementia: a systematic review and metaanalysis. Alzheimers Dement. 2013;9:63–75.e2. doi: 10.1016/j.jalz.2012.11.007. [DOI] [PubMed] [Google Scholar]
- 3.Karran E, Mercken M, De Strooper B. The amyloid cascade hypothesis for Alzheimer’s disease: an appraisal for the development of therapeutics. Nat Rev Drug Discov. 2011;10:698–712. doi: 10.1038/nrd3505. [DOI] [PubMed] [Google Scholar]
- 4.Ittner LM, Gotz J. Amyloid-beta and tau--a toxic pas de deux in Alzheimer’s disease. Nat Rev Neurosci. 2011;12:65–72. doi: 10.1038/nrn2967. [DOI] [PubMed] [Google Scholar]
- 5.Graham SF, Chevallier OP, Roberts D, Holscher C, Elliott CT, Green BD. Investigation of the human brain metabolome to identify potential markers for early diagnosis and therapeutic targets of Alzheimer’s disease. Anal Chem. 2013;85:1803–1811. doi: 10.1021/ac303163f. [DOI] [PubMed] [Google Scholar]
- 6.Touboul D, Gaudin M. Lipidomics of Alzheimer’s disease. Bioanalysis. 2014;6:541–561. doi: 10.4155/bio.13.346. [DOI] [PubMed] [Google Scholar]
- 7.Cutler RG, Kelly J, Storie K, Pedersen WA, Tammara A, Hatanpaa K, Troncoso JC, Mattson MP. Involvement of oxidative stressinduced abnormalities in ceramide and cholesterol metabolism in brain aging and Alzheimer’s disease. Proc Natl Acad Sci U S A. 2004;101:2070–2075. doi: 10.1073/pnas.0305799101. [DOI] [PMC free article] [PubMed] [Google Scholar]
- 8.Yanagisawa K, Odaka A, Suzuki N, Ihara Y. GM1 ganglioside-bound amyloid beta-protein (A beta): a possible form of preamyloid in Alzheimer’s disease. Nat Med. 1995;1:1062–1066. doi: 10.1038/nm1095-1062. [DOI] [PubMed] [Google Scholar]
- 9.Berridge MJ. Inositol trisphosphate and calcium signaling. Ann N Y Acad Sci. 1995;766:31–43. doi: 10.1111/j.1749-6632.1995.tb26646.x. [DOI] [PubMed] [Google Scholar]
- 10.Yuan Q, Zhao S, Wang F, Zhang H, Chen ZJ, Wang J, Wang Z, Du Z, Ling EA, Liu Q, Hao A. Palmitic acid increases apoptosis of neural stem cells via activating c-Jun N-terminal kinase. Stem Cell Res. 2013;10:257–266. doi: 10.1016/j.scr.2012.11.008. [DOI] [PubMed] [Google Scholar]
- 11.Takenawa T, Itoh T. Phosphoinositides, key molecules for regulation of actin cytoskeletal organization and membrane traffic from the plasma membrane. Biochim Biophys Acta. 2001;1533:190–206. doi: 10.1016/s1388-1981(01)00165-2. [DOI] [PubMed] [Google Scholar]
- 12.Wenk MR, De Camilli P. Protein-lipid interactions and phosphoinositide metabolism in membrane traffic: insights from vesicle recycling in nerve terminals. Proc Natl Acad Sci U S A. 2004;101:8262–8269. doi: 10.1073/pnas.0401874101. [DOI] [PMC free article] [PubMed] [Google Scholar]
- 13.Monteiro JP, Oliveira PJ, Jurado AS. Mitochondrial membrane lipid remodeling in pathophysiology: a new target for diet and therapeutic interventions. Prog Lipid Res. 2013;52:513–528. doi: 10.1016/j.plipres.2013.06.002. [DOI] [PubMed] [Google Scholar]
- 14.Meikle PJ, Wong G, Barlow CK, Kingwell BA. Lipidomics: Potential role in risk prediction and therapeutic monitoring for diabetes and cardiovascular disease. Pharmacol Ther. 2014;143:12–23. doi: 10.1016/j.pharmthera.2014.02.001. [DOI] [PubMed] [Google Scholar]
- 15.Nitsch RM, Blusztajn JK, Pittas AG, Slack BE, Growdon JH, Wurtman RJ. Evidence for a membrane defect in Alzheimer disease brain. Proc Natl Acad Sci U S A. 1992;89:1671–1675. doi: 10.1073/pnas.89.5.1671. [DOI] [PMC free article] [PubMed] [Google Scholar]
- 16.Han X, Holtzman DM, McKeel DW Jr. Plasmalogen deficiency in early Alzheimer’s disease subjects and in animal models: molecular characterization using electrospray ionization mass spectrometry. J Neurochem. 2001;77:1168–1180. doi: 10.1046/j.1471-4159.2001.00332.x. [DOI] [PubMed] [Google Scholar]
- 17.Gamba P, Testa G, Sottero B, Gargiulo S, Poli G, Leonarduzzi G. The link between altered cholesterol metabolism and Alzheimer’s disease. Ann N Y Acad Sci. 2012;1259:54–64. doi: 10.1111/j.1749-6632.2012.06513.x. [DOI] [PubMed] [Google Scholar]
- 18.Jones L, Holmans PA, Hamshere ML, Harold D, Moskvina V, Ivanov D, Pocklington A, Abraham R, Hollingworth P, Sims R, Gerrish A, Pahwa JS, Jones N, Stretton A, Morgan AR, Lovestone S, Powell J, Proitsi P, Lupton MK, Brayne C, Rubinsztein DC, Gill M, Lawlor B, Lynch A, Morgan K, Brown KS, Passmore PA, Craig D, McGuinness B, Todd S, Holmes C, Mann D, Smith AD, Love S, Kehoe PG, Mead S, Fox N, Rossor M, Collinge J, Maier W, Jessen F, Schurmann B, Heun R, Kolsch H, van den Bussche H, Heuser I, Peters O, Kornhuber J, Wiltfang J, Dichgans M, Frolich L, Hampel H, Hull M, Rujescu D, Goate AM, Kauwe JS, Cruchaga C, Nowotny P, Morris JC, Mayo K, Livingston G, Bass NJ, Gurling H, McQuillin A, Gwilliam R, Deloukas P, Al-Chalabi A, Shaw CE, Singleton AB, Guerreiro R, Muhleisen TW, Nothen MM, Moebus S, Jockel KH, Klopp N, Wichmann HE, Ruther E, Carrasquillo MM, Pankratz VS, Younkin SG, Hardy J, O’Donovan MC, Owen MJ, Williams J. Genetic evidence implicates the immune system and cholesterol metabolism in the aetiology of Alzheimer’s disease. PLoS One. 2010;5:e13950. doi: 10.1371/journal.pone.0013950. [DOI] [PMC free article] [PubMed] [Google Scholar]
- 19.Sato Y, Suzuki I, Nakamura T, Bernier F, Aoshima K, Oda Y. Identification of a new plasma biomarker of Alzheimer’s disease using metabolomics technology. J Lipid Res. 2012;53:567–576. doi: 10.1194/jlr.M022376. [DOI] [PMC free article] [PubMed] [Google Scholar]
- 20.Han X, Rozen S, Boyle SH, Hellegers C, Cheng H, Burke JR, Welsh-Bohmer KA, Doraiswamy PM, Kaddurah-Daouk R. Metabolomics in early Alzheimer’s disease: identification of altered plasma sphingolipidome using shotgun lipidomics. PLoS One. 2011;6:e21643. doi: 10.1371/journal.pone.0021643. [DOI] [PMC free article] [PubMed] [Google Scholar]
- 21.Mapstone M, Cheema AK, Fiandaca MS, Zhong X, Mhyre TR, Macarthur LH, Hall WJ, Fisher SG, Peterson DR, Haley JM, Nazar MD, Rich SA, Berlau DJ, Peltz CB, Tan MT, Kawas CH, Federoff HJ. Plasma phospholipids identify antecedent memory impairment in older adults. Nat Med. 2014;20:415–8. doi: 10.1038/nm.3466. [DOI] [PMC free article] [PubMed] [Google Scholar]
- 22.Wang DC, Sun CH, Liu LY, Sun XH, Jin XW, Song WL, Liu XQ, Wan XL. Serum fatty acid profiles using GC-MS and multivariate statistical analysis: potential biomarkers of Alzheimer’s disease. Neurobiol Aging. 2012;33:1057–1066. doi: 10.1016/j.neurobiolaging.2010.09.013. [DOI] [PubMed] [Google Scholar]
- 23.Orr SK, Bazinet RP. The emerging role of docosahexaenoic acid in neuroinflammation. Curr Opin Investig Drugs. 2008;9:735–743. [PubMed] [Google Scholar]
- 24.Laye S. Polyunsaturated fatty acids, neuroinflammation and well being. Prostaglandins Leukot Essent Fatty Acids. 2010;82:295–303. doi: 10.1016/j.plefa.2010.02.006. [DOI] [PubMed] [Google Scholar]
- 25.Bazinet RP, Laye S. Polyunsaturated fatty acids and their metabolites in brain function and disease. Nat Rev Neurosci. 2014;15:771–785. doi: 10.1038/nrn3820. [DOI] [PubMed] [Google Scholar]
- 26.Labrousse VF, Nadjar A, Joffre C, Costes L, Aubert A, Gregoire S, Bretillon L, Laye S. Short-term long chain omega3 diet protects from neuroinflammatory processes and memory impairment in aged mice. PLoS One. 2012;7:e36861. doi: 10.1371/journal.pone.0036861. [DOI] [PMC free article] [PubMed] [Google Scholar]
- 27.Bagga D, Wang L, Farias-Eisner R, Glaspy JA, Reddy ST. Differential effects of prostaglandin derived from omega-6 and omega-3 polyunsaturated fatty acids on COX-2 expression and IL-6 secretion. Proc Natl Acad Sci U S A. 2003;100:1751–1756. doi: 10.1073/pnas.0334211100. [DOI] [PMC free article] [PubMed] [Google Scholar]
- 28.Fraser T, Tayler H, Love S. Fatty acid composition of frontal, temporal and parietal neocortex in the normal human brain and in Alzheimer’s disease. Neurochem Res. 2010;35:503–513. doi: 10.1007/s11064-009-0087-5. [DOI] [PubMed] [Google Scholar]
- 29.Folch J, Lees M, Sloane Stanley GH. A simple method for the isolation and purification of total lipides from animal tissues. J Biol Chem. 1957;226:497–509. [PubMed] [Google Scholar]
- 30.Cunnane SC, Schneider JA, Tangney C, Tremblay-Mercier J, Fortier M, Bennett DA, Morris MC. Plasma and brain fatty acid profiles in mild cognitive impairment and Alzheimer’s disease. J Alzheimers Dis. 2012;29:691–697. doi: 10.3233/JAD-2012-110629. [DOI] [PMC free article] [PubMed] [Google Scholar]
- 31.Shahar DR, Schwarzfuchs D, Fraser D, Vardi H, Thiery J, Fiedler GM, Bluher M, Stumvoll M, Stampfer MJ, Shai I, Group D. Dairy calcium intake, serum vitamin D, and successful weight loss. Am J Clin Nutr. 2010;92:1017–1022. doi: 10.3945/ajcn.2010.29355. [DOI] [PubMed] [Google Scholar]
- 32.Schmitz G, Ecker J. The opposing effects of n-3 and n-6 fatty acids. Prog Lipid Res. 2008;47:147–155. doi: 10.1016/j.plipres.2007.12.004. [DOI] [PubMed] [Google Scholar]
- 33.Youdim KA, Martin A, Joseph JA. Essential fatty acids and the brain: possible health implications. Int J Dev Neurosci. 2000;18:383–399. doi: 10.1016/s0736-5748(00)00013-7. [DOI] [PubMed] [Google Scholar]
- 34.Wall R, Ross RP, Fitzgerald GF, Stanton C. Fatty acids from fish: the anti-inflammatory potential of long-chain omega-3 fatty acids. Nutr Rev. 2010;68:280–289. doi: 10.1111/j.1753-4887.2010.00287.x. [DOI] [PubMed] [Google Scholar]
- 35.Bannenberg GL, Chiang N, Ariel A, Arita M, Tjonahen E, Gotlinger KH, Hong S, Serhan CN. Molecular circuits of resolution: formation and actions of resolvins and protectins. J Immunol. 2005;174:4345–4355. doi: 10.4049/jimmunol.174.7.4345. [DOI] [PubMed] [Google Scholar]
- 36.Schwab JM, Serhan CN. Lipoxins and new lipid mediators in the resolution of inflammation. Curr Opin Pharmacol. 2006;6:414–420. doi: 10.1016/j.coph.2006.02.006. [DOI] [PubMed] [Google Scholar]
- 37.Serhan CN, Hong S, Gronert K, Colgan SP, Devchand PR, Mirick G, Moussignac RL. Resolvins: a family of bioactive products of omega-3 fatty acid transformation circuits initiated by aspirin treatment that counter proinflammation signals. J Exp Med. 2002;196:1025–1037. doi: 10.1084/jem.20020760. [DOI] [PMC free article] [PubMed] [Google Scholar]
- 38.Patterson E, Wall R, Fitzgerald GF, Ross RP, Stanton C. Health implications of high dietary omega-6 polyunsaturated Fatty acids. J Nutr Metab. 2012;2012:539426. doi: 10.1155/2012/539426. [DOI] [PMC free article] [PubMed] [Google Scholar]
- 39.Cagnin A, Brooks DJ, Kennedy AM, Gunn RN, Myers R, Turkheimer FE, Jones T, Banati RB. In-vivo measurement of activated microglia in dementia. Lancet. 2001;358:461–467. doi: 10.1016/S0140-6736(01)05625-2. [DOI] [PubMed] [Google Scholar]
- 40.Griffin WS, Stanley LC, Ling C, White L, MacLeod V, Perrot LJ, White CL 3rd, Araoz C. Brain interleukin 1 and S-100 immunoreactivity are elevated in Down syndrome and Alzheimer disease. Proc Natl Acad Sci U S A. 1989;86:7611–7615. doi: 10.1073/pnas.86.19.7611. [DOI] [PMC free article] [PubMed] [Google Scholar]
- 41.Sanchez-Mejia RO, Mucke L. Phospholipase A2 and arachidonic acid in Alzheimer’s disease. Biochim Biophys Acta. 2010;1801:784–790. doi: 10.1016/j.bbalip.2010.05.013. [DOI] [PMC free article] [PubMed] [Google Scholar]
- 42.Serhan CN, Arita M, Hong S, Gotlinger K. Resolvins, docosatrienes, and neuroprotectins, novel omega-3-derived mediators, and their endogenous aspirin-triggered epimers. Lipids. 2004;39:1125–1132. doi: 10.1007/s11745-004-1339-7. [DOI] [PubMed] [Google Scholar]
- 43.Henry GE, Momin RA, Nair MG, Dewitt DL. Antioxidant and cyclooxygenase activities of fatty acids found in food. J Agric Food Chem. 2002;50:2231–2234. doi: 10.1021/jf0114381. [DOI] [PubMed] [Google Scholar]
- 44.Astarita G, Jung KM, Vasilevko V, Dipatrizio NV, Martin SK, Cribbs DH, Head E, Cotman CW, Piomelli D. Elevated stearoyl-CoA desaturase in brains of patients with Alzheimer’s disease. PLoS One. 2011;6:e24777. doi: 10.1371/journal.pone.0024777. [DOI] [PMC free article] [PubMed] [Google Scholar]
- 45.Zhao Y, Calon F, Julien C, Winkler JW, Petasis NA, Lukiw WJ, Bazan NG. Docosahexaenoic acid-derived neuroprotectin D1 induces neuronal survival via secretase- and PPARgammamediated mechanisms in Alzheimer’s disease models. PLoS One. 2011;6:e15816. doi: 10.1371/journal.pone.0015816. [DOI] [PMC free article] [PubMed] [Google Scholar]
- 46.Lukiw WJ, Cui JG, Marcheselli VL, Bodker M, Botkjaer A, Gotlinger K, Serhan CN, Bazan NG. A role for docosahexaenoic acid-derived neuroprotectin D1 in neural cell survival and Alzheimer disease. J Clin Invest. 2005;115:2774–2783. doi: 10.1172/JCI25420. [DOI] [PMC free article] [PubMed] [Google Scholar]
- 47.Hong S, Gronert K, Devchand PR, Moussignac RL, Serhan CN. Novel docosatrienes and 17S-resolvins generated from docosahexaenoic acid in murine brain, human blood, and glial cells. Autacoids in anti-inflammation. J Biol Chem. 2003;278:14677–14687. doi: 10.1074/jbc.M300218200. [DOI] [PubMed] [Google Scholar]
- 48.Lee JT, Xu J, Lee JM, Ku G, Han X, Yang DI, Chen S, Hsu CY. Amyloid-beta peptide induces oligodendrocyte death by activating the neutral sphingomyelinase-ceramide pathway. J Cell Biol. 2004;164:123–131. doi: 10.1083/jcb.200307017. [DOI] [PMC free article] [PubMed] [Google Scholar]
- 49.Roher AE, Weiss N, Kokjohn TA, Kuo YM, Kalback W, Anthony J, Watson D, Luehrs DC, Sue L, Walker D, Emmerling M, Goux W, Beach T. Increased A beta peptides and reduced cholesterol and myelin proteins characterize white matter degeneration in Alzheimer’s disease. Biochemistry. 2002;41:11080–11090. doi: 10.1021/bi026173d. [DOI] [PubMed] [Google Scholar]
- 50.Patil S, Chan C. Palmitic and stearic fatty acids induce Alzheimer-like hyperphosphorylation of tau in primary rat cortical neurons. Neurosci Lett. 2005;384:288–293. doi: 10.1016/j.neulet.2005.05.003. [DOI] [PubMed] [Google Scholar]
- 51.Grimm MO, Rothhaar TL, Grosgen S, Burg VK, Hundsdorfer B, Haupenthal VJ, Friess P, Kins S, Grimm HS, Hartmann T. Trans fatty acids enhance amyloidogenic processing of the Alzheimer amyloid precursor protein (APP) J Nutr Biochem. 2012;23:1214–1223. doi: 10.1016/j.jnutbio.2011.06.015. [DOI] [PubMed] [Google Scholar]