

Abstract
T2*-weighted MRI of transient oxygen challenge (OC) showed exaggerated OC percent changes in the ischemic tissue at risk compared to normal tissue. One ambiguity is that regions with high vascular density also showed exaggerated OC percent changes. This study explored time-to-peak (TTP) of the OC percent changes to improve the utility of T2*-weighted OC MRI. Experiments were performed longitudinally at 30 min, 150 min and 24 h after transient (60-min) stroke in rats. Ischemic core, normal, and mismatch tissue were classified pixel-by-pixel based on apparent diffusion coefficient and cerebral blood flow. Major findings were: (i) Delayed OC TTP was localized to and corresponded well with the perfusion-diffusion mismatch. (ii) By contrast, the exaggerated OC percent changes were less localized, with changes not only in the at-risk tissue but also in some areas of the contralesional hemisphere with venous vessel origins. (iii) The OC time-course of the mismatch tissue was biphasic, with a faster initial increase followed by a slower increase. (iv) At-risk tissue with delayed TTP and exaggerated OC was normal after reperfusion and the at-risk tissue was mostly (83 ± 18%) rescued by reperfusion as indicated by normal 24-h T2. OC TTP offers unique information toward better characterization of at-risk tissue in ischemic stroke.
Keywords: Functional MRI, focal ischemia, perfusion-weighted MRI, diffusion-weighted MRI, BOLD contrast
Introduction
Improved identification of potentially salvageable at-risk ischemic tissue is clinically important. Perfusion-diffusion MRI has been instrumental in distinguishing reversible from irreversibly ischemic brain injury, and to guide acute stroke treatment in preclinical and clinical settings.1 However, it remains challenging for perfusion and diffusion MRI to separate oligemia, penumbra or ischemic core.
T2*-weighted MRI of transient oxygen challenge (OC) has been shown to offer additional information on ischemic tissue at risk in permanent2,3 and transient4,5 stroke rats and in stroke patients.6 In the ischemic penumbra in which cerebral blood flow (CBF) is partially compromised but still has significant metabolic activity, the basal T2*-weighted signal intensity is low due to the relatively high concentration of deoxyhemoglobin. OC brings in oxygenated blood displacing the high deoxyhemoglobin concentration in the at-risk tissue surrounding the infarct core, resulting in an exaggerated OC T2*-weighted signal intensity percent changes compared to the homologous region in the contralesional hemisphere. In the infarct core during occlusion, OC induces little or no change in T2*-weighted signal intensity because occlusion completely compromises CBF. Thus, OC percent-change map highlight at-risk tissue with high contrast amongst its surrounding in ischemic stroke. Regions with exaggerated OC responses are consistent with the notion of ischemic penumbra, as demonstrated by histologic evidence of normal neuronal morphology, ongoing glucose metabolism, and tissue recovery after reperfusion.5,7–9 OC with reduced oxygen concentration (40% O2) to minimize possible toxic effects of oxygen has also been proposed.10,11 Basal T1 increased slightly in the ischemic core 24 h after stroke due to edema, whereas OC decreased T1 significantly in the core, indicating the substantial increases in dissolved oxygen occurred in the core as the results of hyperperfusion 24 h after stroke.5
Although OC offer useful insight into ischemic tissue fate, the OC T2*-weighted signals have a few confounding factors that preclude potential widespread utility. A key confound is that regions with high vascular density also showed exaggerated OC percent changes, making it challenging to distinguish these changes from the exaggerated OC percent changes of at-risk tissue. In this study, we explored the utility of time to peak (TTP) of the exaggerated OC responses to further improve its potential diagnostic value. Experiments were performed on transient (60-min) cerebral ischemia in rats. The ischemic core, normal, and mismatch tissues were classified pixel-by-pixel using automated cluster analysis of apparent diffusion coefficient (ADC) and CBF. OC percent changes and TTP were analyzed. These changes are monitored longitudinally at multiple time points after stroke.
Materials and methods
ARRIVE guidelines
The following ARRIVE guidelines were followed in the preparation of this manuscript: Title, Abstract, Background, Objectives, and Ethical statement; Study Design; Experimental procedures; Experimental animals, Housing and husbandry; Experimental outcomes; Statistical methods, Numbers analyzed; Interpretation, and scientific implications; and Generalizability/translation and Funding.
Animal preparation
Animal procedures followed guidelines and regulations consistent with the Guide for the Care and Use of Laboratory Animals, Public Health Service Policy on Humane Care and Use of Laboratory Animals, and the Animal Welfare Act and Animal Welfare Regulations and were approved by the Institutional of Animal Care and Utilization Committee, University of Texas Health Science Center at San Antonio. Eight male Sprague Dawley rats (250–300 g) were anesthetized with 2% isoflurane in air during surgery. Transient (60-min) focal brain ischemia of the right hemisphere was induced using the intraluminal middle cerebral artery occlusion (MCAO) method.12 Animals were mechanically ventilated and maintained at ∼1.2% isoflurane during MRI. End-tidal CO2 was monitored via a Surgivet capnometer (Smith Medical, Waukesha, WI, USA). Noninvasive end-tidal CO2 values have been calibrated previously against invasive blood gas samplings under identical settings.13 The rectal temperature was maintained at 37.0 ± 0.5℃. The heart rate and blood oxygen saturation level were monitored using a MouseOx system (STARR Life Science Corp., Oakmont, PA, USA).
Magnetic resonance imaging was performed during occlusion and animals were moved out on the rail to withdraw the occluder while the animals were in the holder at 60 min after occlusion. The animals were repositioned for additional MRI. Quantitative CBF and ADC were acquired every 30 min post-occlusion up to 180 min, and again at 24 h after stroke. Transient oxygen challenge (inhaling oxygen) was performed at 45 min, 150 min and 24 h post-occlusion. T2*-weighted MRI data were continuously acquired during which the animals breathed 3 min of air, 4 min of O2, and 3 min of air. Rats were imaged at 24 h post-occlusion and T2 maps were acquired to confirm infarct volume.
MRI experiments
MRI experiments were performed on a 7-T/40-cm magnet, a Biospec Bruker console (Billerica, MA), and a 40-G/cm gradient insert (ID = 12 cm, 120 -μs rise time). A surface coil (2.3-cm ID) was used for brain imaging and a neck coil for perfusion labeling.13,14 Coil-to-coil electromagnetic interaction was actively decoupled.
ADC: Averaged ADC was obtained by averaging three ADC maps with diffusion-sensitive gradients separately applied along the x, y or z direction. Single-shot, spin-echo echo-planar images (EPI) were acquired15 with matrix = 96 × 96 with partial Fourier (5/8) acquisition and reconstructed to 128 × 128, FOV = 2.56 × 2.56 cm, seven 1.5-mm slices, TR = 3 s (90o flip angle), TE = 37 ms, b = 4 and 1200 s/mm2, Δ = 17.53 ms, δ = 5.6 ms, and 16 averages.
CBF: CBF was measured using the continuous arterial spin-labeling (cASL) technique with single-shot, gradient-echo, echo-planar-imaging (EPI) acquisition as described previously.15 Continuous arterial spin labeling employed a 2.7-s square radiofrequency pulse to the labeling coil. Acquisition parameters were matrix = 96 × 96 with partial Fourier (5/8) acquisition and reconstructed to 128 × 128, FOV = 2.56 × 2.56 cm, seven 1.5-mm slices, TR = 3 s (90° flip angle), and TE = 10.2 ms.
T2*-weighted MRI of oxygen challenge: OC fMRI was acquired using T2*-weighted gradient-echo EPI, matrix = 96 × 96 (reconstructed to 128 × 128), FOV = 2.56 × 2.56 cm, seven 1.5-mm slices, TR = 10 s, TE = 26 ms, 90° flip angle. OC experiment paradigm was: 3 min OFF, 4 min ON, 3 min OFF, and 60 repetitions in total.
T2: T2-weighted images were acquired using fast spin-echo pulse sequence with two effective echo times (50 and 80 ms), TR = 2 s (90° flip angle), matrix = 128 × 128, FOV = 2.56 × 2.56 cm, echo train length 8, and eight signal averages.
Data analysis
Data analysis used codes written in Matlab (MathWorks Inc., Natick, MA, USA) and the STIMULATE (University of Minnesota) software. ADC, CBF and T2 maps were calculated as described previously.12,16 OC response percent change maps with respect to basal (air) conditions were calculated. T1 maps with intensity in unit of seconds were calculated pixel-by-pixel by fitting the model of Si = So−2Ae−TI(i)/T1, where Si is the signal intensity obtained with inversion delay time TI(i).
Cerebrospinal fluid and the corpus callosum were excluded from analysis. Three tissue types (normal, perfusion-diffusion mismatch and ischemic core) were characterized by using auto-clustering ISODATA method17 based on 30-min ADC and CBF data without using thresholds. Images of different time points were co-registered using custom-designed semi-automatic co-registration software.15,18–20 Percent changes, ADC and CBF values were analyzed for different tissue types for individual animals, followed by group averaging. Final infarct volume was determined based on 24-h T2 maps using threshold (mean T2 of normal hemisphere plus two standard deviations) method. To compensate for edema, a swelling factor was determined by subtracting the total volume of the normal hemisphere from the ischemic hemisphere.21 The edema-corrected lesion volume was obtained by subtracting the swelling volume from the ischemic volume.
OC percent-change and TTP maps were generated pixel-by-pixel. The time-to-peak was defined as the time from one standard deviation above baseline to the mean value of the steady-state OC response during the stimulation period. For pixels with negative OC response, TTP was assigned as −10 s. ROI analysis was performed using an ischemic core ROI, mismatch ROI, contralesional ROI, and other ROIs as described in text. The group-averaged OC percent changes and TTP (along with ADC, CBF and T2) of normal and at-risk tissue, contralesional ROI, and other ROIs with exaggerated percent changes were tabulated at different time points.
All data values in text are expressed as mean ± s.d. and in graphs as mean ± s.e.m. A P < 0.05 (two-tailed paired t-test) was taken to be statistically significant.
Results
All recorded physiological parameters were maintained within normal physiological ranges (end-tidal CO2: 35–45 mmHg, arterial O2 saturation: 94–97%, temperature: 36.5–37.3℃, heart rate: 350–400 bpm) unless otherwise perturbed by OC.
Figure 1 shows the ADC, CBF, OC percent-change, and OC TTP maps 30-mins after stroke of a representative rat during MCAO. The perfusion–diffusion mismatch was detected where CBF was low but ADC was close to normal (red ROI). Consistent with previous reports,2–5 OC percent-change map showed good correspondence between exaggerated OC response and the perfusion–diffusion mismatch regions. However, the OC percent-change map also showed exaggerated OC percent changes in some regions of the contralateral normal hemisphere (ROI1) and along the midline (ROI2).
Figure 1.
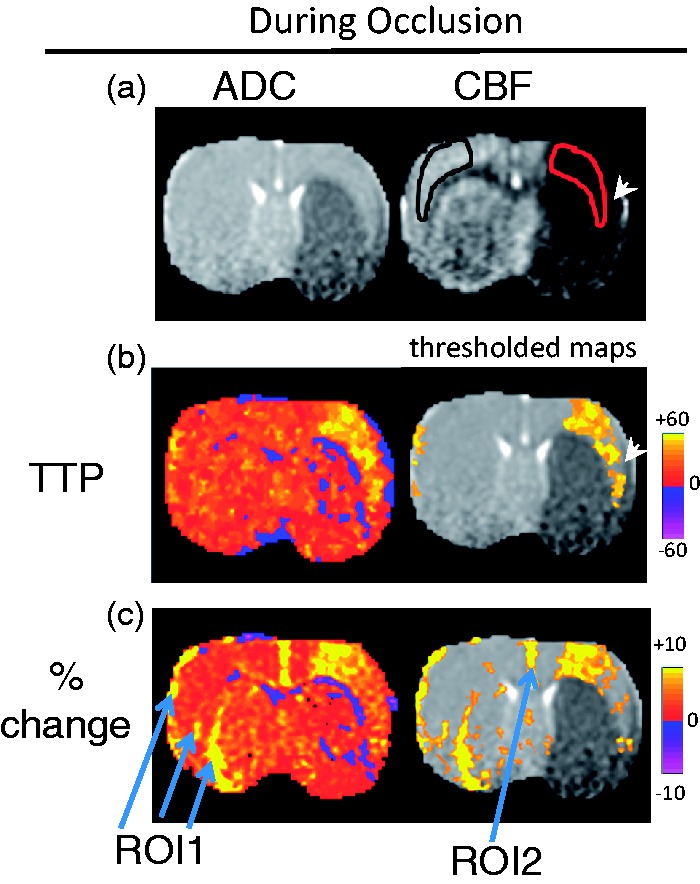
(a) ADC, CBF maps from a representative rat 30 min after stroke (during MCAO). The perfusion–diffusion mismatch was detected where CBF was low but ADC was close to normal (red ROI). Note that the tip of the red ROI did not include a piece of tissue (arrowhead) that is abnormal on ADC map (it is not a mis-registration). The corresponding homologous contralesional (black) ROI was used for comparison. (b) TTP maps displayed without and with a threshold. The pixels with delayed TTP were localized to the mismatch region. (c) OC percent-change map displayed without and with a threshold. The pixels with exaggerated OC percent changes were less localized, and these pixels included the mismatch, ROI1, and ROI2.
By contrast, the region with delayed TTP is much more localized with excellent correspondence with the perfusion–diffusion mismatch. TTP map is better visualized after setting a threshold of mean + 2 standard deviations of the normal hemisphere. ROI1 and ROI2 did not show delayed TTP compared to normal tissue, and therefore could be distinguished from tissue at risk.
The group-averaged OC magnitude and TTP of normal, at-risk and core tissue during MCAO, along with their ADC and CBF, are shown in Figure 2. The OC time courses showed exaggerated OC responses in the perfusion–diffusion mismatch tissue (red ROI) compared to the normal contralesional homologous region (black ROI). The post OC stimulus signals did not completely return to baseline compared to contralesional ROI. Normalized time courses showed the markedly delayed TTP of the mismatch tissue compared to normal tissue. Moreover, the time course of the mismatch tissue appeared biphasic, with a faster initial increase followed by a slower increase. The faster component slope was 0.028 s−1 and the slower component slope was 0.008 s−1, compared to the normal tissue slope of 0.033 s−1. The TTP of at-risk tissue was longer than that of normal tissue by 30 s. ADC and CBF values of the delayed TTP OC responses confirmed that these tissues were localized to the perfusion–diffusion mismatch (low CBF and slightly reduced ADC). The core tissue (blue ROI) with markedly reduced ADC and CBF did not show significant OC percent changes. Its TTP could not be reliably determined.
Figure 2.

Group-averaged time courses of (a) OC percent changes and (b) OC TTP from the perfusion–diffusion mismatch tissue (red ROI) compared to the contralesional homologous region (black ROI) at 30 min after stroke. The group time course of the mismatch tissue showed a biphasic pattern, with a faster initial increase followed by a slower increase. The faster component slope was 0.028 s−1 and the slower component slope was 0.008 s−1, compared to the normal tissue slope of 0.033 s−1. The corresponding group-averaged (c) OC percent change, (d) OC TTP, (e) ADC and (f) CBF for the mismatch (at-risk) tissue, the contralesional homologous ROI (normal tissue) and core tissue (blue ROI). OC TTP of core tissue could not be reliably determined and was labeled as ‘not reliable’.
Group-averaged OC magnitude and TTP of the normal, mismatch, ROI1 and ROI2 were compared (Figure 3). While the mismatch ROI, ROI1 and ROI2 all showed exaggerated BOLD responses, only the mismatch ROI showed a delayed TTP compared to the contralesional homologous ROI. ROI1 and ROI2 did not show delayed TTP compared to normal tissue.
Figure 3.

Comparison of group (a) OC percent changes and (b) TTP of normal, mismatch (at-risk), ROI1 and ROI2. While mismatch ROI, ROI1 and ROI2 all showed exaggerated BOLD responses, only the mismatch ROI showed a delayed TTP compared to normal tissue. ROI1 and ROI2 did not show delayed TTP compared to normal tissue. ROI1 and ROI2 represented the area that showed exaggerated OC responses in the contralateral normal hemisphere (ROI1) and along the midline (ROI2). * indicates statistical significant from normal tissue.
Reperfusion occurred at 60 min after MCAO onset. The OC TTP and percent-change maps at 150 min after MCAO (after reperfusion) are shown in Figure 4(a). After reperfusion, the initially defined at-risk tissue showed normal TTP and the initially defined ischemic core showed mildly delayed TTP. OC percent changes were normal in the at-risk tissue and mildly elevated in the ischemic core. The majority of the tissue with delayed TTP did not infarct based on 24-h T2. Figure 4(b) shows the group-averaged ADC, CBF, OC percent-change and OC TTP values at 150 min for the normal, mismatch (at-risk) and core ROIs. The ADC and CBF values of the initial at-risk tissue were mildly reduced and those of the initial ischemic core tissue were markedly reduced. Consistent with the individual animal data, the initial at-risk tissue showed normal TTP and the initial core showed mildly delayed TTP. OC percent changes were normal in the initial at-risk tissue and mildly elevated in the initial core.
Figure 4.

(a) ADC, CBF, OC percent-change and OC TTP maps at 150 min after MCAO. Reperfusion occurred at 60 min after MCAO. After reperfusion, the initially defined at-risk tissue showed normal TTP and the initially defined ischemic core showed mildly delayed TTP. OC percent changes were normal in the at-risk tissue and mildly elevated in the ischemic core. (b) Group-averaged ADC, CBF, OC percent-change and OC TTP values at 150 min for the normal, mismatch (at-risk) and core ROIs. * indicates statistical significant from normal tissue.
ADC, CBF, OC percent change, OC TTP maps and T2-weighted MRI of 24-h after MCAO are shown in Figure 5(a) and the group-averaged ADC, CBF, OC percent-change, OC TTP and T2 values at 24 hr for the normal, mismatch (at-risk) and core ROIs are shown in Figure 5(b). The initially defined at-risk tissue showed normal ADC, OC percent change, OC TTP, trending higher CBF (p = 0.13), and close to normal T2. Based on 24-h T2, the majority (83 ± 18%), but not all, of the initially defined at-risk tissue did not infarct at 24 h after MCAO in this 60-min MCAO model. The initially defined core tissue showed significantly lower ADC (p = 0.01), OC percent change (p = 0.02), and significantly higher CBF (p = 0.01) and T2 (p = 0.01). Because the OC responses of core tissue at 24 h showed small negative or positive percent changes, TTP could not be reliably determined.
Figure 5.

(a) ADC, CBF, OC percent-change, OC TTP maps and T2-weighted MRI at 24 h after MCAO. The initially defined core tissue showed significantly lower ADC, OC percent change, and significantly higher CBF (hyperperfusion) and T2. The initially defined at-risk tissue showed normal OC percent change and TTP. The majority of the at-risk tissue with delayed TTP did not infarct based on 24 h T2. (b) Group-averaged ADC, CBF, OC percent-change, OC TTP and T2 values at 24 h for the normal, mismatch (at-risk) and core ROIs. OC TTP of core tissue could not be reliably determined and was labeled as ‘not reliable’.
Discussion
This study explored the utility of time-to-peak of the T2*-weighted MRI of oxygen challenge to improve the identification of at-risk tissue in ischemic stroke. The major findings are: (1) Delayed OC TTP is localized to and corresponded well with the perfusion–diffusion mismatch. (2) By contrast, the exaggerated OC percent changes were less localized, with changes not only in the at-risk tissue but also in some areas of the contralateral normal hemisphere and along the midline. (3) The OC time-course of the perfusion–diffusion mismatch tissue appeared biphasic, with a faster initial increase followed by a slower increase. (4) At-risk tissue with delayed TTP and exaggerated OC was normal after reperfusion at 60 min post MCAO and the at-risk tissue was rescued by reperfusion as indicated by normal T2 24 h post-MCAO. These findings suggest that OC TTP offers additional information to the exaggerated OC percent changes to improve identification of at-risk tissue in ischemic stroke.
Magnitude of OC responses
As described previously,2–5 T2*-weighted MRI contrast of the oxygen challenge arises from regional changes in local deoxyhemoglobin concentration ([Hb]) in the brain, which is dependent on local cerebral metabolic rate of oxygen, arterial oxygen tension, CBF and cerebral blood volume. In the ischemic penumbra, the basal [Hb] is elevated because the tissue is still metabolically active (therefore producing Hb) but CBF is partially compromised. OC thus induces a significantly larger increase in the T2*-weighted signal intensity in at-risk tissue than normal tissue because the denominator of the at-risk tissue is small due to the high basal [Hb]. Quantitative analysis of possible metabolic and oxygen concentration changes is challenging because OC signal is dependent on many biophysical and physiological parameters. Nonetheless, tissue with exaggerated OC responses can be salvaged by reperfusion.5,7,8 Consistent with previous findings,2–5 the perfusion–diffusion mismatch showed exaggerated OC percent changes, and there was good correspondence between areas of exaggerated OC percent changes and the perfusion–diffusion mismatch in ischemic stroke.
TTP of the OC responses
The magnitude of the exaggerated OC responses, however, is ambiguous in that there were some exaggerated OC percent changes in the contralesional hemisphere and along the midline. ROI1 and ROI2 in Figure 1 also showed exaggerated OC responses but without delayed TTP. The signal sources are likely associated with vessels. The notion that these are vessels is supported by the exaggerated OC responses from region of high vascular density, the shape and location of these pixels (i.e. the cortical surface and known vascular structure in the caudate putamen). The sources of these signals are likely venules and veins, but not arteries because hemoglobins in the arteries are essentially fully saturated. There could be some contributions from arterioles but likely small. Note that the temporal resolution of the TTC OC could not distinguish between arteries and veins based on the temporal domain. The TTP in the at-risk tissue is markedly delayed (by 30 s) relative to normal tissue as a result of significantly compromised tissue perfusion. TTP returned toward normal after reperfusion.
It is also important to note that the post OC stimulus signals did not completely return to baseline compared to contralesional ROI. A possible explanation is that tissue oxygenation in the at-risk tissue after transient OC challenges remains elevated to a new steady state.
Biphasic OC TTP response
One of the major findings is that the OC response in the ischemic penumbra is biphasic, with a faster initial increase followed by a slower increase, whereas the OC response in the normal tissue was monophasic with a rapid rise time. A possible explanation is that the ROI includes two different tissue types (i.e. normal and at-risk tissue), which have two different TTPs. Another possible explanation is that there are two compartments within the at-risk tissue, one of large vessels, and the other of tissue/veins, with the latter being markedly delayed because it takes time for oxygenated blood to reach a new steady state where oxygen delivery and oxygen consumption is out of balance under significantly compromised perfusion condition. This is in contrast to normal tissue where the oxygen delivery and consumption is already in optimal steady state. T2*-weighted MRI of OC could offer valuable data to model oxygen transport into ischemic tissue at risk with additional measurements such as cerebral blood volume. Further investigation is needed.
After reperfusion and endpoints
After reperfusion, the at-risk tissue showed normal TTP and the ischemic core showed mildly delayed TTP, suggesting successful reperfusion and largely normalized delivery of oxygen to tissue. The at-risk tissue showed normal OC percent changes and in the ischemic core showed mildly elevated OC percent changes. These findings suggest that there is still some mismatch of oxygen delivery and consumption in the ischemic core compared to normal tissue after reperfusion, suggesting that initial ischemic core did not completely recover from its initial hemodynamic disturbance, and the tissue fate is still evolving. The majority of the tissue with delayed TTP in the ischemic penumbra did not infarct as indicated by normal 24-h T2. The majority of the initial ischemic core, which did not show delayed OC TTP nor exaggerated OC percent changes, became infarct tissue based on 24-h T2. The initially defined ischemic core tissue showed significant hyperperfusion which has been linked to worse outcome and increased hemorrhagic transformation.22–24 Some of initial mismatch (at-risk) pixels also showed hyperperfusion at 24 h, indicating tissue fate is still evolving and may become infarct later.22 The initially defined core tissue (which exhibited T2-weighted hyperintensity) showed no significant OC % changes at 24 h, suggesting that the tissue was already dead.
Shortcomings and future directions
There are some shortcomings of TTP approach. When the OC T2*-weighted signal change is very small (e.g. in the core during occlusion), the TTP calculation is not possible or prompted to errors. Combining percent change and TTP analysis is needed. For example, a minimum percent change threshold could be set and TTP of tissue with percent change lower than this threshold will not be calculated or set to zero. A TTP threshold can also be set and tissue with TTP lower than this threshold will not be considered to be at-risk. Another potential shortcoming is that the absolute TTP could be affected by the oxygen delivery rate (i.e. flow rate and pressure of oxygen tank), which could confound cross-laboratory comparison. This problem can be addressed by comparing the TTP of the affected brain regions with normal homologous brain regions. Another factor that could affect the accuracy of TTP is the repetition time (TR) of image acquisition. In this study, we used 10-s TR to avoid T1 effect of oxygen challenge.5 Shorter TR (with reduced flip angle to avoid inflow effect) will improve the TTP accuracy.
Conclusion
This study explored the utility of time-to-peak of the T2*-weighted MRI of oxygen challenge to improve the identification of at-risk tissue in ischemic stroke. Delayed OC TTP was highly co-localized with the perfusion–diffusion mismatch, and tissue with delayed OC TTP was salvaged by reperfusion. OC TTP maps overcome some of the limitations of OC percent-change maps in its ability to distinguish non-specific changes from the veins and venules in normal tissues. The time-course of the mismatch tissue appeared biphasic, with a faster initial increase followed by a slower increase, which could potentially offer important physiological information about at-risk tissue. Together these findings suggest that OC TTP offers additional information to the exaggerated OC percent changes to improve identification of at-risk tissue in ischemic stroke.
Funding
The author(s) disclosed receipt of the following financial support for the research, authorship, and/or publication of this article:
This work was supported by the NIH (grant no. R01-NS45879) and the American Heart Association (grant nos. EIA 0940104N, SDG 0830293N and 12BGIA9300047).
Declaration of conflicting interests
The author(s) declared no potential conflicts of interest with respect to the research, authorship, and/or publication of this article.
Authors’ contributions
QS and TD designed the study; QS, SH, and TD developed the methodology; QS and SH collected the data; QS and SH performed the analysis; and QS and TD wrote the manuscript.
References
- 1.Schlaug G, Benfield A, Baird AE, et al. The ischemic penumbra: operationally defined by diffusion and perfusion MRI. Neurology 1999; 53: 1528–1537. [DOI] [PubMed] [Google Scholar]
- 2.Shen Q, Huang S, Du F, et al. Probing ischemic tissue fate with BOLD fMRI of brief oxygen challenge. Brain Res 2011; 1425: 132–141. [DOI] [PMC free article] [PubMed] [Google Scholar]
- 3.Santosh C, Brennan D, McCabe C, et al. Potential use of oxygen as a metabolic biosensor in combination with T2*-weighted MRI to define the ischemic penumbra. J Cereb Blood Flow Metab 2008; 28: 1742–53. [DOI] [PMC free article] [PubMed] [Google Scholar]
- 4.Singhal AB, Ratai E, Benner T, et al. Magnetic resonance spectroscopy study of oxygen therapy in ischemic stroke. Stroke 2007; 38: 2851–2854. [DOI] [PubMed] [Google Scholar]
- 5.Shen Q, Du F, Huang S, et al. Effects of cerebral ischemic and reperfusion on T2*-weighted MRI responses to brief oxygen challenge. J Cereb Blood Flow Metab 2014; 34: 169–175. [DOI] [PMC free article] [PubMed] [Google Scholar]
- 6.Dani KA, Santosh C, Brennan D, et al. T2*-weighted magnetic resonance imaging with hyperoxia in acute ischemic stroke. Ann Neurol 2010; 68: 37–47. [DOI] [PubMed] [Google Scholar]
- 7.Robertson CA, McCabe C, Gallagher L, et al. Stroke penumbra defined by an MRI-based oxygen challenge technique: 1. Validation using [14C]2-deoxyglucose autoradiography. J Cereb Blood Flow Metab 2011; 31: 1778–1787. [DOI] [PMC free article] [PubMed] [Google Scholar]
- 8.Robertson CA, McCabe C, Gallagher L, et al. Stroke penumbra defined by an MRI-based oxygen challenge technique: 2. Validation based on the consequences of reperfusion. J Cereb Blood Flow Metab 2011; 31: 1788–1798. [DOI] [PMC free article] [PubMed] [Google Scholar]
- 9.Holmes WM, Lopez-Gonzalez MR, Gallagher L, et al. Novel MRI detection of the ischemic penumbra: direct assessment of metabolic integrity. NMR Biomed 2012; 25: 295–304. [DOI] [PubMed] [Google Scholar]
- 10.Deuchar GA, Brennan D, Griffiths H, et al. Perfluorocarbons enhance a T2*-based MRI technique for identifying the penumbra in a rat model of acute ischemic stroke. J Cereb Blood Flow Metab 2013; 33: 1422–1428. [DOI] [PMC free article] [PubMed] [Google Scholar]
- 11.Robertson CA, McCabe C, Lopez-Gonzalez MR, et al. Detection of ischemic penumbra using combined perfusion and T2* oxygen challenge imaging. Int J Stroke 2015; 10: 42–50. [DOI] [PMC free article] [PubMed] [Google Scholar]
- 12.Shen Q, Meng X, Fisher M, et al. Pixel-by-pixel spatiotemporal progression of focal ischemia derived using quantitative perfusion and diffusion imaging. J Cereb Blood Flow Metab 2003; 23: 1479–1488. [DOI] [PMC free article] [PubMed] [Google Scholar]
- 13.Duong TQ, Silva AC, Lee SP, et al. Functional MRI of calcium-dependent synaptic activity: cross correlation with CBF and BOLD measurements. Magn Reson Med 2000; 43: 383–92. [DOI] [PubMed] [Google Scholar]
- 14.Silva AC, Lee S-P, Yang C, et al. Simultaneous blood oxygenation level-dependent and cerebral blood flow functional magnetic resonance imaging during forepaw stimulation in the rat. J Cereb Blood Flow Metab 1999; 19: 871–879. [DOI] [PubMed] [Google Scholar]
- 15.Shen Q, Ren H, Cheng H, et al. Functional, perfusion and diffusion MRI of acute focal ischemic brain injury. J Cereb Blood Flow Metab 2005; 25: 1265–1279. [DOI] [PMC free article] [PubMed] [Google Scholar]
- 16.Shen Q, Fisher M, Sotak CH, et al. Effects of reperfusion on ADC and CBF pixel-by-pixel dynamics in stroke: Characterizing tissue fates using quantitative diffusion and perfusion imaging. J Cereb Blood Flow Metab 2004; 24: 280–290. [DOI] [PMC free article] [PubMed] [Google Scholar]
- 17.Shen Q, Ren H, Bouley J, et al. Dynamic tracking of acute ischemic tissue fates using improved unsupervised ISODATA analysis of high-resolution quantitative perfusion and diffusion data. J Cereb Blood Flow and Metab 2004; 24: 887–897. [DOI] [PMC free article] [PubMed] [Google Scholar]
- 18.Liu ZM, Schmidt KF, Sicard KM, et al. Imaging oxygen consumption in forepaw somatosensory stimulation in rats under isoflurane anesthesia. Magn Reson Med 2004; 52: 277–285. [DOI] [PMC free article] [PubMed] [Google Scholar]
- 19.Schmidt KF, Febo M, Shen Q, et al. Hemodynamic and metabolic changes induced by cocaine in anesthetized rat observed with multimodal functional MRI. Psychopharmacology 2006; 185: 479–486. [DOI] [PMC free article] [PubMed] [Google Scholar]
- 20.Shen Q, Duong TQ. Quantitative prediction of ischemic stroke tissue fate. NMR Biomed 2008; 21: 839–848. [DOI] [PMC free article] [PubMed] [Google Scholar]
- 21.Tatlisumak T, Carano RAD, Takano K, et al. A novel endothelin antagonist, A-127722, attenuates ischemic lesion size in rats with temporal middle cerebral artery occlusion: A diffusion and perfusion MRI study. Stroke 1998; 29: 850–858. [DOI] [PubMed] [Google Scholar]
- 22.Shen Q, Du F, Huang S, et al. Spatiotemporal characteristics of postischemic hyperperfusion with respect to changes in T1, T2, diffusion, angiography, and blood-brain barrier permeability. J Cereb Blood Flow Metab 2011; 31: 2076–2085. [DOI] [PMC free article] [PubMed] [Google Scholar]
- 23.Yu S, Liebeskind DS, Dua S, et al. Postischemic hyperperfusion on arterial spin labeled perfusion MRI is linked to hemorrhagic transformation in stroke. J Cereb Blood Flow Metab 2015; 35: 630–637. [DOI] [PMC free article] [PubMed] [Google Scholar]
- 24.Tanaka Y, Nagaoka T, Nair G, et al. Arterial spin labeling and dynamic susceptibility contrast CBF MRI in postischemic hyperperfusion, hypercapnia, and after mannitol injection. J Cereb Blood Flow Metab 2011; 31: 1403–1411. [DOI] [PMC free article] [PubMed]