

Abstract
We present a system of nonlinear ordinary differential equations used to quantify the complex dynamics of the interactions between tumor growth, vasculature generation, and antiangiogenic treatment. The primary dataset consists of longitudinal tumor size measurements (1,371 total observations) in 105 colorectal tumor‐bearing mice. Mice received single or combination administration of sunitinib, an antiangiogenic agent, and/or irinotecan, a cytotoxic agent. Depending on the dataset, parameter estimation was performed either using a mixed‐effect approach or by nonlinear least squares. Through a log‐likelihood ratio test, we conclude that there is a potential synergistic interaction between sunitinib when administered in combination with irinotecan in preclinical settings. Model simulations were then compared to data from a follow‐up preclinical experiment. We conclude that the model has predictive value in identifying the therapeutic window in which the timing between the administrations of these two drugs is most effective.
Study Highlights.
WHAT IS THE CURRENT KNOWLEDGE ON THE TOPIC? ☑ The therapeutic combination of antiangiogenic drugs with chemotherapies is used to treat patients with colorectal cancer. The action of the antiangiogenic drug leads to a modification of the properties of the intratumoral vascular network. Some studies have shown that antiangiogenic drugs can induce a normalization of the intratumoral vasculature followed by a reduction of blood flow. Since chemotherapy, which has a direct cytotoxic effect on tumor cells, reaches cancer cells by the blood vessel network, an interaction, favorable or unfavorable, between these two drugs is possible. • WHAT QUESTION DID THIS STUDY ADDRESS? ☑ The objective was to quantify the dynamics of this interaction by using mathematical modeling in order to identify the best protocols of administration of an antiangiogenic drug, sunitinib, combined with a chemotherapy, irinotecan. • WHAT THIS STUDY ADDS TO OUR KNOWLEDGE ☑ In the preclinical conditions we explored, there is a weak synergistic interaction between these drugs and, given a specific combination protocol, an optimal timing for the administration of irinotecan during sunitinib treatment. • HOW THIS MIGHT CHANGE CLINICAL PHARMACOLOGY AND THERAPEUTICS ☑ The model will be up‐scaled to human in order to suggest new delivery protocols of this combination for improving the treatment of colorectal cancer patients.
The seminal work of Folkman describes the “angiogenic switch” that details how the growth of a tumor greatly depends on its ability to induce a vascular network capable of sustaining its growth.1 Without initiating angiogenesis, tumors are destined to remain dormant at a diameter of 1–3 mm. Work in this area has progressed through the identification of vascular endothelial growth factor (VEGF) as a key factor in tumor growth and angiogenesis. This signaling protein promotes endothelial cell proliferation and migration and is overproduced by many types of cancer cells.2
A number of therapies designed to target angiogenesis have been developed. Bevacizumab, an antibody targeting the VEGF receptor, is approved for use in the treatment of different types of cancers.3 Multitarget tyrosine kinase inhibitors (TKIs) such as sunitinib4 and sorafenib5 are also potent antiangiogenic agents. While the potential benefits of targeting the angiogenesis process are apparent, the effects of combining such treatments with chemotherapeutic agents have yielded mixed results. For instance, in separate studies both Allegra et al. and Kindler et al. saw no significant improvement in disease‐free survival or progression‐free survival when bevacizumab was administered alone or in conjunction with chemotherapy in colon and pancreatic advanced cancer.6, 7 Some multitargeted TKIs, such as sunitinib, have been shown to be effective both as monotherapy and when used in conjunction with chemotherapy, but only in some solid tumors.8
The dynamics associated with treating cancer with antiangiogenic drugs are complex, in particular because of their potential to modify the properties of tumor vasculature. Some studies have reported a drug‐induced vascular normalization within the tumor, leading to more effective drug delivery.9, 10 As an example, bevacizumab has been shown to increase the penetration of topotecan into a tumor by 81%.11 On the other hand, these treatments also have the potential to destroy vasculature to the point of rendering the vasculature incapable of drug delivery.8 These two phenomena, vasculature normalization and vasculature destruction, occur simultaneously. Thus far, scientific investigations have been insufficient to uncover the underlying mechanics of such complex phenomena. This motivates a model‐based approach designed to understand the dynamic interactions between tumor progression, antiangiogenic drugs, and chemotherapeutic drugs. Using such an approach enables one to propose evidence‐based combined therapeutic treatments designed to optimize the effectiveness of such treatments.
A number of mathematical models employing a number of different techniques have been developed that describe tumor growth with a theoretical antiangiogenic treatment.12, 13, 14, 15, 16, 17 Extensive work has been done in modeling tumor growth and treatment with a chemotherapeutic agent (see reviews18, 19). Of particular relevance to this work, Simeoni et al.20 present a model of tumor growth and treatment with the cytotoxic agent irinotecan. This work was followed by work in which synergistic interactions between the antiangiogenic agent bevacizumab and a number of chemotherapeutic compounds were evaluated using the Simeoni model.21
In the current work, we focus on the dynamics of tumor growth of HT‐29 colorectal cancer (CRC) cells when two types of treatment are administered: the cytotoxic agent, irinotecan, and an antiangiogenic agent, sunitinib. This drug combination is of particular interest for a number of reasons: sunitinib failed a phase II clinical trial for the treatment of CRC,22 thus leading to a stoppage in further clinical investigation of the drug in this indication. However, one can speculate that knowing how to optimally combine sunitinib with a chemotherapeutic agent could result in a synergistic effect caused by a proactive modification of the tumor vasculature enhancing chemotherapy accessibility within the tumor.
Our aim was to look closely to the preclinical properties of the antiangiogenic drug sunitinib to evaluate if optimally designed combination with a chemotherapy agent could result in a significant synergistic effect.
Given the common use of irinotecan in CRC (part of the FOLFIRI regimen) and given that irinotecan efficacy in xenografted mice has also been extensively modeled (see ref. 20 as an example), we selected this drug as a potential combination partner for sunitinib in CRC.
In patients eligible for sunitinib treatment (for example, in renal cell carcinoma), sunitinib is given orally on a daily basis. In the FOLFIRI regimen, irinotecan is given with slow intravenous infusion, one at a time, per chemotherapy cycle. Given these practical considerations, the question we addressed is the following: Is there an optimal time to deliver a single dose of irinotecan during a 12‐day administration of sunitinib?
METHODS
Overview
We first performed in vitro experiments to investigate the cytotoxic effects of sunitinib on HT‐29 cells. The same HT‐29 cells have been successively implanted in nude mice and interstitial fluid pressure—a marker of vasculature normalization10—has been measured (see Supplementary Materials). We developed a model that consists of a system of nonlinear ordinary differential equations (ODEs) and describe tumor growth and angiogenesis. We analyzed a dataset consisting of longitudinal tumor size measurements (1,371 total observations) in 105 colorectal tumor‐bearing mice. Mice received single or combination administration of sunitinib and/or irinotecan. In the combination groups, sunitinib was given once daily for 12 days, with a single dose of irinotecan at day 2 or day 15. Sunitinib is modeled as acting by reducing the carrying capacity of the tumor, while irinotecan directly reduces the size of the tumor. Model parameters are estimated using a population approach using a stochastic approximation of the expectation‐maximization algorithm (SAEM) using a simple least squares approach. We then evaluate the hypothesis that sunitinib and irinotecan interact synergistically when administered together. Finally, the model is used to predict the optimal timing of combined irinotecan and sunitinib treatment. The predictive ability of this model is validated with data from a follow‐up experimental study. In the following sections we describe our methods in greater detail.
In vivo experiment
Experimental subjects were athymic male mice, 5–6 weeks of age, weighing about 20 g each. Mice were maintained in cages with filter paper covers, sterilized food and bedding, and acidified water. All animal experiments were conducted in accordance with the Guide for the Care and Use of Laboratory Animals (NIH publication #85‐23, revised 1985). HT‐29 human colorectal adenocarcinoma cells were grown in advance, trypsinized, counted, washed, and resuspended in serum for subcutaneous injection into the flank of mice. The injection condition was 3.0 × 10⁶ cells in 200 μL. After injection, tumor measurements were made in each mouse once every 2–3 days for up to 9 weeks (Figure 1). Data collection consisted of three orthogonal tumor diameter measurements: length: l, width: w, and height: h, made using a slide caliper.
Figure 1.
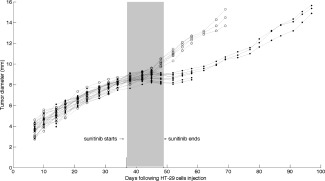
Mean tumor diameter time course in HT‐29 xenografted mice treated with sunitinib 40 mg/kg daily for 12 days (filled circles) or placebo (empty circles) in Experiment 1.
Drug treatments
Treated animals were administered one or both of two therapeutic agents: irinotecan administered at 90 mg/kg 5‐minute intravenous infusion or sunitinib administered at 40 mg/kg oral gavage. Two experiments were conducted for the purpose of model building. The first experiment was designed to determine the effectiveness of sunitinib monotherapy (see Supplemental Table S1 for experimental protocol). This experiment included two arms: control and sunitinib treated (Figure 1). For the treatment arm of this experiment, sunitinib was administered once daily for 12 days. A second experiment was conducted to investigate the effects of combined therapy with sunitinib and irinotecan on tumor growth (see Supplemental Table S2 for experimental protocol). There are five arms to this experiment: control, sunitinib monotherapy, irinotecan monotherapy, and two arms in which a combination of the two drugs was administered. In the combination groups, sunitinib was given once daily for 12 days, with a single dose of irinotecan at day 2 or day 15.
One experiment was conducted for the purpose of model evaluation. Here, sunitinib was administered for 12 consecutive days, during which there was a single administration of irinotecan on the 0th, 3rd, 6th, 9th, or 12th day of sunitinib treatment. The detailed protocol for this experiment is given in Supplemental Table S4.
Modeling of tumor size
Following the logic presented previously,16 we chose to model the mean of the three tumor diameter measurements. The use of mean tumor diameter is motivated by the fact that we intend that this model be used as the basis for a translational model, moving from the preclinical to the clinical setting. Because RECIST classifications of solid tumors in humans refer to linear tumor dimensions, we also use linear tumor dimensions here. Differing from the previous study,16 however, we have chosen to consider the geometric mean of the length, width, and height measurements, , as opposed to their arithmetic mean, . This is motivated by the fact that the geometric mean incorporates information about the “height” of the tumor (the distance the tumor extends in the direction perpendicular to the body of the mouse) but also normalizes for the fact that this measurement typically lies in a different numerical range than those of the length and width of the tumor.
Parameter estimation
The SAEM (Stochastic Approximation of the Expectation Maximization) algorithm was developed as an approach to solve the expectation maximization (EM) problem. Given a mathematical model, the goal is to determine the parameter values that maximize the corresponding likelihood function. When appropriate, we use a naïve pooled mixed‐effect approach. We utilize the SAEM algorithm implemented within the Monolix (Lixoft) software to estimate both population and individual parameters.
When the data were not amenable to mixed‐effect parameter estimation techniques, we used standard least squares regression with the median tumor size data to estimate typical parameter values. To obtain least squares parameter estimations, ordinary differential equation solvers were coupled with minimization algorithms from the standard library of MatLab (MathWorks, Natick, MA).
Model structure, selection, and evaluation
A number of model structures were considered. This included a number of tumor growth models such as exponential, linear, logistic, and Gompertzian growth. The current model is a modification of the classic model of Hahnfeldt et al.,14 which includes tumor growth that is determined by a rate‐limiting carrying capacity.
Model selection was done using a number of model evaluation criteria (Bayesian Information Criteria, Visual Predictive Check, likelihood values, standard errors on the parameters). The Bayesian Information Criteria (BIC) was used to compare and select between non‐nested models. Candidate models resulting in lower BIC were selected over those with higher BIC. For a comparison between nested models, the log‐likelihood ratio test was used to compare whether the likelihoods of two candidate models differ significantly from one another. After model selection was completed, the predictive value of the model was evaluated by comparing model simulations to a validation dataset.
RESULTS
Model of vascular tumor growth with sunitinib treatment
As an outcome of the same experiment, we report in Figure 1 the time course of tumor size—measured as the mean tumor diameter—in mice treated with sunitinib (12 oral doses of 40 mg/kg daily) or not (control). Sunitinib is shown to produce a sustainable inhibition of tumor growth. There is clear evidence of tumor growth inhibition (i.e., treatment effectiveness) in the sunitinib group (filled circles) when compared to the control group (empty circles) with ∼20‐day delay in the time it takes for a tumor to reach a diameter of 10 mm. Given the results highlighting the non‐cytotoxicity of sunitinib (see Supplemental Data), we can assume that sunitinib is primarily acting on the tumor endothelium and vasculature rather than on the HT‐29 tumor cells to induce a strong inhibition of tumor growth. This noncytotoxic action is associated with a drop in the tumor interstitial fluid pressure (IFP) synonymous with a normalization of tumor vasculature, thus suggesting the existence of a potential optimal window to combine the sunitinib treatment with a classical chemotherapy agent (Supplemental Data).
Following the spirit of the Hahnfeldt Model,14 the model equations for the proposed model of tumor growth are as follows:
| (1) |
The mean tumor diameter D is assumed to grow following a generalized logistic growth law with varying carrying capacity. The tumor growth rate is represented by λ. The parameter α is fixed to a value of 0.1, implying that the growth law is “nearly” Gompertzian. The variable K, known as the carrying capacity, describes the maximum capacity of tumor size. This variable represents tumor endothelium and vasculature providing nutrient and oxygen to tumor cells to grow. The rate constant associated with the creation of new vessels is b. The values of each of these parameters are given in Supplementary Table S2.
Next, we consider this model with the addition of antiangiogenic treatment. The variable S represents the total amount of sunitinib in the system. Due to the lack of pharmacokinetic data, we assume an exponential decay of sunitinib after each dose.23 The model (1) together with the components related to sunitinib pharmacokinetic and pharmacodynamics are presented below:
| (2) |
Given previous results where sunitinib was shown not to induce HT‐29 cells death in vitro, we assumed the drug only to affect the tumor vasculature variable K.
The activity of sunitinib is proportional to its dosing rate . The elimination constant associated with sunitinib is and the effectiveness of sunitinib is represented by . Sunitinib treatment is given once a day for 12 consecutive days. Due to the lack of pharmacokinetic data, we consider each dose as having a normalized magnitude of 1.
Parameters of this model are estimated using the SAEM algorithm. The values of the parameters can be seen in Supplementary Table S2. Figure 2 a shows a comparison of the model simulation to the average data in both the control (black) and treatment (blue) cases. There is good agreement between the data and simulations, leading us to believe that we have captured important dynamics associated with antiangiogenic therapy. Further model diagnostics are shown in Figure 2 b. Here we show the visual predictive check associated with the two arms of the experiment. The dashed line outlines the 95% confidence interval determined by model simulation. Later timepoints (past 20 day) might show some level of misclassification due to the lack of data for these timepoints. Despite this, the experimental data are shown to be well confined by this interval in both the control (upper panel) and treated (lower panel) cases. Also, the individual parameter estimation is associated with an epsilon shrinkage of 7.6%, giving confidence to the notion that the data have not been overfit.
Figure 2.
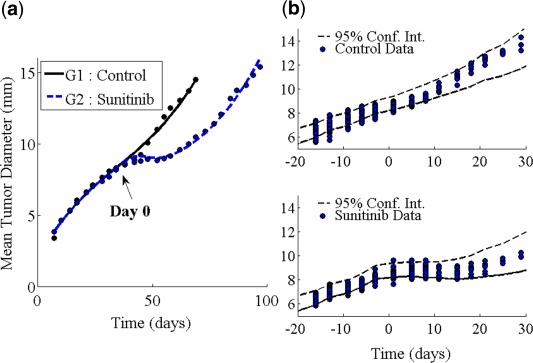
Sunitinib monotherapy model simulations. (a) Model simulation using average parameters. (b) Visual predictive check showing the 95% confidence interval generated by model simulation (dashed lines) and the tumor size data (circles) for the two experiment arms described in Table S1.
Model of vascular tumor growth with combined sunitinib‐irinotecan treatment
The natural way to model the combination of sunitinib‐irinotecan is to assume simple additivity of the effect. We model the effects of irinotecan by following the work of Simeoni et al.20 The variable C represents the total amount of irinotecan in the system. In a similar fashion to how sunitinib is modeled, the activity of irinotecan is proportional to its dosing rate . The elimination constant associated with irinotecan is and the effectiveness of irinotecan is represented by . We consider that irinotecan kills tumor cells through a three‐stage death process represented mathematically by tumor cells passing through three transit compartment equations ( ) prior to leaving the system. The resulting model, schematically represented in Figure 3 and for which equations are given below, is called the “noninteraction” model.
| (3) |
Figure 3.
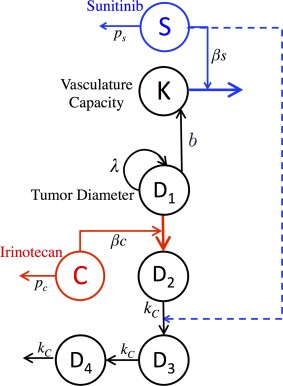
Schematic representation of sunitinib‐irinotecan combination model. Inclusion of the dashed line represents the final model in which the two drugs interact, while exclusion of this line represents a model in which irinotecan and sunitinib are assumed to act independently of each other.
Given the evidence of a decrease in tumor IFP during sunitinib treatment—thus potentially indicating tumor vasculature normalization—we also considered a model in which these two drugs interact with each other within the system, referred to as the “interaction model.” If sunitinib acts by normalizing tumor vasculature, it may result in an improved blood flow within the tumor. As cells need energy and oxygen to induce programmed cell death following DNA injuries by a cytotoxic agent, we hypothesized that sunitinib could increase the speed by which cells die once affected by irinotecan. We thus assumed that when the drugs are given concurrently, is proportional to the cumulated exposure to sunitinib prior to the dose of irinotecan. The time of the administration of irinotecan is represented by the variable . The “interaction model” has the same representation as model (3) where:
| (4) |
The exponential in expression 4 was chosen to produce a relation similar to that of an exponential covariate in the mixed‐effect approach. While this approach is empirical in the current modeling context, should we be able to use the mixed‐effect approach with a similar dataset in the future, we hypothesize that the exponential covariate would be the most likely relation between these two quantities.
To estimate model parameters, we performed a new experiment described in Supplemental Table S3. Parameters were fit to the median data of each experimental group using nonlinear least squares regression. The final parameter values are given in Table 1.
Table 1.
Parameter estimates of experiment #2
| Parameter | Estimate (% RSE) |
|---|---|
| D (t = 0) (mm) | 0.29 (fixed) |
| K (t = 0) (mm) | 7.43 (fixed) |
| λ (day−1) | 1.34 (10) |
| b (mm−1 · day−1) | 0.0027 (0.04) |
| pS (day−1) | 2.12 (fixed) |
| βS (conc. unit−1) | 0.0317 (0.31) |
| pC (day−1) | 0.0850 (fixed) |
| βC (conc. unit−1) | 0.3847 (5) |
| kS (unitless) | 0.155 (6) |
Figure 3 provides a schematic view of the sunitinib‐irinotecan combination model, while Figure 4 shows a comparison of the noninteraction and the interaction models. In Figure 4 a, we show a comparison of the simulations of both the noninteraction and interaction models along with the data of Group 4 (combination sunitinib with irinotecan on day 2). In Figure 4 b, we show a comparison of the simulations of both the noninteraction and interaction models along with the data of Group 5 (combination sunitinib with irinotecan on day 15). While the argument can be made for both models accurately describing the data of Group 4, it is clear that the noninteraction model does not capture the phenomenon observed for the data of Group 5. We continue by quantifying the observation that the interaction model more accurately describes our data. We show the observed tumor sizes vs. the simulated tumor sizes for the noninteraction model (Figure 4 d) and interaction model (Figure 4 c). We then consider the least squares linear fit of these data. Visually, it is clear that the regression line of the interaction model (Figure 4 d) is more closely aligned with the identity line than the noninteraction model (Figure 4 c). This is evidence that the interaction model might be better suited to our data. Since the interaction model is nested within the noninteraction model, a log‐likelihood ratio test was performed to determine if the difference in likelihoods is statistically significant. The result of the test shows a change in likelihood equal to −5.99. This indicates that the interaction model fits the data significantly better (P < 0.05) than the noninteraction model. The simulation of Experiment 2 with the interaction model is shown in Figure 5, where we see good concordance between model and data in all five arms of the experiment.
Figure 4.
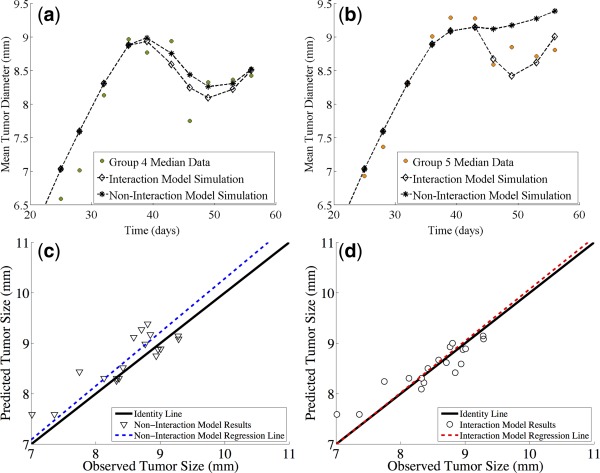
Experiment 2. A comparison of the predictions of the noninteraction and interaction models. (a) Comparison of the simulations of both the noninteraction and interaction models along with the data of Group 4 (combination sunitinib with irinotecan on day 2). (b) Comparison of the simulations of both the noninteraction and interaction models along with the data of Group 5 (combination sunitinib with irinotecan on day 15). (c) Observed tumor sizes vs. the simulated tumor sizes for the noninteraction model. (d) Observed tumor sizes vs. the simulated tumor sizes for the interaction model.
Figure 5.
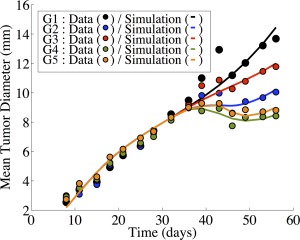
Numerical simulation of Experiment 2 (Supplementary Table S2). Simulations are the result of the interaction model. The five arms to this experiment are as follows: control (black), sunitinib monotherapy (blue), irinotecan monotherapy (red), and two combination protocols. Group 4 (green) involves sunitinib being given once daily for 12 days, with a single dose of irinotecan at day 2. Group 5 (orange) involves sunitinib being given once daily for 12 days, with a single dose of irinotecan at day 15.
Model evaluation
To further evaluate the model, we tested the ability of the model to adapt to the data arising from a separate experiment involving the same types of tumors and treatments. Following the experimental protocol given in Supplemental Table S4, sunitinib was administered for 12 consecutive days, during which there was a single administration of irinotecan on the 0th, 3rd, 6th, 9th, or 12th day of sunitinib treatment. Both simulation and experiment agree on the same optimal treatment protocol: the one in which irinotecan is administered on the 6th day of sunitinib treatment. In Figure 6 we show the minimal tumor size achieved after treatment is started (nadir), with interindividual variability (one standard error) with respect to the day of irinotecan starts within the 12 days of sunitinib treatment. The continuous line represents the results of the simulation of the experiment using parameters in Table 1. Despite different tumor size values, the model qualitatively correctly predicts that the best day for irinotecan administration was day 6.
Figure 6.
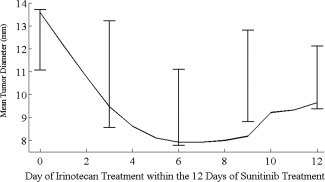
Experiment 3. Minimal tumor diameter achieved (y‐axis) in mice treated with sunitinib 40 mg/kg daily for 12 days in combination with irinotecan 90 mg/kg (unique 5‐minute intravenous infusion) given at different time (x‐axis) in the evaluation experiment (Supplemental Table S4). Error bars represent one standard deviation of experimental data, while continuous line represents the model prediction.
DISCUSSION
In this work we developed a model of tumor growth in the case of combined therapy with antiangiogenic and chemotherapeutic drugs. Model development was guided by preclinical in vivo experiments with HT‐29 colorectal tumor cells treated with sunitinib and irinotecan. Our model describes the growth of the tumor diameter as a generalized logistic function with a varying carrying capacity and can be viewed as a simplification of the model by Hahnfeldt et al.14 Treatment with the antiangiogenic drug is modeled as decreasing the carrying capacity of the tumor, while treatment with irinotecan is modeled as a three‐stage death process taking place directly on the tumor cells, as described in ref. 20.
One of the major questions when modeling multiple treatments is whether or not the treatments interact synergistically, antagonistically, or independently from each other. Our model, combined with a log‐likelihood ratio test suggests that, in this setting, there is a possible weak synergistic interaction between sunitinib and irinotecan. While the findings of a drug interaction are consistent with the findings described,24 it is inconsistent with some other modeling work (Terranova et al., 24 who found no interaction. These varied conclusions are unsurprising, in that they reflect the mixed findings concerning the effectiveness of sunitinib in the clinical setting. These results highlight the need for more work to be done to understand how these drugs work individually and in combination. Furthermore, there is no single way to define synergism and antagonism. Depending on the definition the results might be different.25
Given that our model accurately models our data, it is possible to ask questions about the best timing of the two treatments. In both data and simulations, we found that the minimum final tumor size is reached when irinotecan was administered on the 6th day of sunitinib administration. This supports the notion that a “vasculature‐normalizing window” occurs in the range between the 4th and 8th day of sunitinib treatment, with the best time for administering chemotherapy occurring during this window. Biologically, our experiments are consistent with the findings of Jain et al., who detail evidence of such a treatment window in antiangiogenic drugs.8 The numerical result is similar to the results of ref. 15, where the model indicated that the ideal time frame for chemotherapy administration existed in the range of 4–7 days after the start of sunitinib administration.
There are a number of ways in which this model may be modified or improved. First, the addition of pharmacokinetic data from our drugs could foster the development of a full pharmacokinetic‐pharmacodynamic (PK‐PD) model. We suspect that the addition of pharmacokinetic models will not significantly change the timescales or the nature of the interaction. However, we feel that the qualitative information gleaned from this model will hold even with the full PK‐PD framework. However, a full PK‐PD model would be needed to predict things like dose magnitude and toxicity. The model could be made more complex to investigate more biologically complex questions. For instance, one could consider a heterogeneous tumor consisting of different types of cells,16 or even a more spatial model.15
It is also of note that we investigate “one cycle” of treatment. Now that we have identified the optimal combined treatment for a single cycle of irinotecan/sunitinib treatment, it would be of interest to investigate both experimentally and numerically whether this treatment protocol remains optimal when given in multiple cycles.
Despite drastic simplification of the representative biological mechanisms, much can be gleaned from mechanistic models such as the one presented here. Our model suggests that synergism between irinotecan and sunitinib might be a consideration for future studies. In the future, this model could be used as a simulation tool to guide future preclinical experiments concerning these two drugs. Finally, this model could also be used to guide the development of a clinical model of CRC treatment with sunitinib and irinotecan. Information gleaned from this preclinical model could aid in increasing overall treatment efficacy by suggesting protocols based on the identification of optimal treatment windows between antiangiogenic and chemotherapeutic drugs.
Supporting information
Supplemental Table S1: Experimental protocol for sunitinib monotherapy experiment. This experiment aimed at developing the model for sunitinib alone and for evaluating the effect of the drug on the interstitial fluid pressure (IFP).
Supplemental Table S2: Sunitinib model parameter values in the monotherapy experiment (see Supplemental Table S1 for corresponding experimental protocol).
Supplemental Table S3: Experimental protocol for sunitinib and irinotecan combined therapy experiment.
Supplemental Table S4: Experimental protocol for sunitinib and irinotecan combined therapy experiment in the evaluation study.
Supporting Information
Supporting Information
Supporting Information
Supporting Information
Supporting Information
Supporting Information
Supporting Information
Supporting Information
Supporting Information
Supporting Information
Supporting Information
Acknowledgments
The research leading to these results received support from INSERM (grant from Physicancer 2011). The work was also partly funded by the Innovative Medicines Initiative Joint Undertaking under grant agreement no. 115156, resources of which are composed of financial contributions from the European Union's Seventh Framework Program (FP7/2007‐2013) and EFPIA companies' in kind contribution. The DDMoRe project is also supported by financial contributions from Academic and SME partners. This work does not necessarily represent the view of all DDMoRe partners.
Conflict of Interest
No conflicts of interest to declare.
Author Contributions
B.R., S.W., M.T., and A.O. wrote the article; B.R., S.W., M.T., A.O., Y.Y., A.A.B., M.X.W., G.F., B.Y., and E.G. designed the research; B.R., S.W., M.T., A.O., A.E., Y.Y., A.A.B., S.K., and M.X.W. performed the research; B.R., S.W., M.T., A.O., A.E., and Y.Y. analyzed the data.
References
- 1. Folkman, J. Role of angiogenesis in tumor growth and metastasis. Semin. Oncol. 29(6 suppl. 16), 15–18 (2002). [DOI] [PubMed] [Google Scholar]
- 2. Hicklin, D.J. & Ellis, L.M. Role of the vascular endothelial growth factor pathway in tumor growth and angiogenesis. J. Clin. Oncol. 23(5), 1011–1027 (2005). [DOI] [PubMed] [Google Scholar]
- 3. Ferrara, N. , Hillan, K.J. , Gerber, H.P. & Novotny, W. Discovery and development of bevacizumab, an anti‐VEGF antibody for treating cancer. Nat Rev Drug Discov 3(5), 391–400 (2004). [DOI] [PubMed] [Google Scholar]
- 4. Chow, L.Q. & Eckhardt, S.G. Sunitinib: from rational design to clinical efficacy. J. Clin. Oncol. 25(7), 884–896 (2007). [DOI] [PubMed] [Google Scholar]
- 5. Hasskarl, J. Sorafenib: targeting multiple tyrosine kinases in cancer. Recent Results Cancer Res. 201, 145–164 (2014). [DOI] [PubMed] [Google Scholar]
- 6. Allegra, C.J. et al Phase III trial assessing bevacizumab in stages II and III carcinoma of the colon: results of NSABP protocol C‐08. J. Clin. Oncol. 29(1), 11–16 (2011). [DOI] [PMC free article] [PubMed] [Google Scholar]
- 7. Kindler, H.L. et al Gemcitabine plus bevacizumab compared with gemcitabine plus placebo in patients with advanced pancreatic cancer: phase III trial of the Cancer and Leukemia Group B (CALGB 80303). J. Clin. Oncol. 28(22), 3617–3622 (2010). [DOI] [PMC free article] [PubMed] [Google Scholar]
- 8. Jain, R.K. , Duda, D.G. , Clark, J.W. & Loeffler, J.S. Lessons from phase III clinical trials on anti‐VEGF therapy for cancer. Nat. Clin. Pract. Oncol. 3(1), 24–40 (2006). [DOI] [PubMed] [Google Scholar]
- 9. Koukourakis, M.I. et al Early antivascular effects of bevacizumab anti‐VEGF monoclonal antibody on colorectal carcinomas assessed with functional CT imaging. Am. J. Clin. Oncol. 30(3), 315–318 (2007). [DOI] [PubMed] [Google Scholar]
- 10. Willett, C.G. et al Direct evidence that the VEGF‐specific antibody bevacizumab has antivascular effects in human rectal cancer. Nat. Med. 10(2), 145–147 (2004). [DOI] [PMC free article] [PubMed] [Google Scholar]
- 11. Dickson, P.V. et al Bevacizumab‐induced transient remodeling of the vasculature in neuroblastoma xenografts results in improved delivery and efficacy of systemically administered chemotherapy. Clin. Cancer Res. 13(13), 3942–3950 (2007). [DOI] [PubMed] [Google Scholar]
- 12. Anderson, A.R. & Chaplain, M.A. Continuous and discrete mathematical models of tumor‐induced angiogenesis. Bull. Math. Biol. 60(5), 857–899 (1998). [DOI] [PubMed] [Google Scholar]
- 13. d'Onofrio, A. , Gandolfi, A. & Rocca, A. The dynamics of tumour‐vasculature interaction suggests low‐dose, time‐dense anti‐angiogenic schedulings. Cell Prolif. 42(3), 317–329 (2009). [DOI] [PMC free article] [PubMed] [Google Scholar]
- 14. Hahnfeldt, P. , Panigrahy, D. , Folkman, J. & Hlatky, L. Tumor development under angiogenic signaling: a dynamical theory of tumor growth, treatment response, and postvascular dormancy. Cancer Res. 59(19), 4770–4775 (1999). [PubMed] [Google Scholar]
- 15. Lignet, F. et al Theoretical investigation of the efficacy of antiangiogenic drugs combined to chemotherapy in xenografted mice. J. Theor. Biol. 320: 86–99 (2013). [DOI] [PubMed] [Google Scholar]
- 16. Ribba, B. et al A model of vascular tumour growth in mice combining longitudinal tumour size data with histological biomarkers. Eur. J. Cancer 47(3), 479–490 (2011). [DOI] [PubMed] [Google Scholar]
- 17. Sachs, R. , Hlatky, L. & Hahnfeldt, P. Simple ODE models of tumor growth and anti‐angiogenic or radiation treatment. Math. Comput. Model. 33(12‐13), 1297–1305 (2001). [Google Scholar]
- 18. Ribba, B. et al A review of mixed‐effects models of tumor growth and effects of anticancer drug treatment used in population analysis. CPT Pharmacometrics Syst Pharmacol. 3: e113 (2014). [DOI] [PMC free article] [PubMed] [Google Scholar]
- 19. Simeoni, M. , De Nicolao, G. , Magni, P. , Rocchetti, M. & Poggesi, I. Modeling of human tumor xenografts and dose rationale in oncology. Drug Discov. Today Technol. 10(3), e365–372 (2013). [DOI] [PubMed] [Google Scholar]
- 20. Simeoni, M. et al Predictive pharmacokinetic‐pharmacodynamic modeling of tumor growth kinetics in xenograft models after administration of anticancer agents. Cancer Res. 64(3), 1094–1101 (2004). [DOI] [PubMed] [Google Scholar]
- 21. Rocchetti, M. et al Predictive pharmacokinetic‐pharmacodynamic modeling of tumor growth after administration of an anti‐angiogenic agent, bevacizumab, as single‐agent and combination therapy in tumor xenografts. Cancer Chemother. Pharmacol. 71(5), 1147–1157 (2013). [DOI] [PubMed] [Google Scholar]
- 22. Saltz, L.B. et al Phase II trial of sunitinib in patients with metastatic colorectal cancer after failure of standard therapy. J. Clin. Oncol. 25(30), 4793–4799 (2007). [DOI] [PubMed] [Google Scholar]
- 23. Jacqmin, P. et al Modelling response time profiles in the absence of drug concentrations: definition and performance evaluation of the K‐PD model. J. Pharmacokinet. Pharmacodyn. 34(1), 57–85 (2007). [DOI] [PubMed] [Google Scholar]
- 24. Terranova, N. , Germani, M. , Del Bene, F. & Magni, P. A predictive pharmacokinetic‐pharmacodynamic model of tumor growth kinetics in xenograft mice after administration of anticancer agents given in combination. Cancer Chemother. Pharmacol. 72(2), 471–482 (2013). [DOI] [PMC free article] [PubMed] [Google Scholar]
- 25. Greco, W.R. , Bravo, G. & Parsons, J.C. The search for synergy: a critical review from a response surface perspective. Pharmacol. Rev. 47(2), 331–385 (1995). [PubMed] [Google Scholar]
Associated Data
This section collects any data citations, data availability statements, or supplementary materials included in this article.
Supplementary Materials
Supplemental Table S1: Experimental protocol for sunitinib monotherapy experiment. This experiment aimed at developing the model for sunitinib alone and for evaluating the effect of the drug on the interstitial fluid pressure (IFP).
Supplemental Table S2: Sunitinib model parameter values in the monotherapy experiment (see Supplemental Table S1 for corresponding experimental protocol).
Supplemental Table S3: Experimental protocol for sunitinib and irinotecan combined therapy experiment.
Supplemental Table S4: Experimental protocol for sunitinib and irinotecan combined therapy experiment in the evaluation study.
Supporting Information
Supporting Information
Supporting Information
Supporting Information
Supporting Information
Supporting Information
Supporting Information
Supporting Information
Supporting Information
Supporting Information
Supporting Information