Abstract
DNA double-strand breaks (DSBs) are formed as a result of genotoxic insults, such as exogenous ionizing radiation, and are among the most serious types of DNA damage. One of the earliest molecular responses following DSB formation is the phosphorylation of the histone H2AX, giving rise to γH2AX. Many copies of γH2AX are generated at DSBs and can be detected in vitro as foci using well-established immuno-histochemical methods. It has previously been shown that anti-γH2AX antibodies, modified by the addition of the cell-penetrating peptide TAT and a fluorescent or radionuclide label, can be used to visualize and quantify DSBs in vivo. Moreover, when labelled with a high amount of the short-range, Auger electron-emitting radioisotope, 111In, the amount of DNA damage within a cell can be increased, leading to cell death. In this report, we develop a mathematical model that describes how molecular processes at individual sites of DNA damage give rise to quantifiable foci. Equations that describe stochastic mean behaviours at individual DSB sites are derived and parametrized using population-scale, time-series measurements from two different cancer cell lines. The model is used to examine two case studies in which the introduction of an antibody (anti-γH2AX-TAT) that targets a key component in the DSB repair pathway influences system behaviour. We investigate: (i) how the interaction between anti-γH2AX-TAT and γH2AX effects the kinetics of H2AX phosphorylation and DSB repair and (ii) model behaviour when the anti-γH2AX antibody is labelled with Auger electron-emitting 111In and can thus instigate additional DNA damage. This work supports the conclusion that DSB kinetics are largely unaffected by the introduction of the anti-γH2AX antibody, a result that has been validated experimentally, and hence the hypothesis that the use of anti-γH2AX antibody to quantify DSBs does not violate the image tracer principle. Moreover, it provides a novel model of DNA damage accumulation in the presence of Auger electron-emitting 111In that is supported qualitatively by the available experimental data.
Keywords: radiobiology, mathematical model, DNA damage repair
1. Introduction
DNA double-strand breaks (DSBs), one of the most lethal types of DNA damage, can be caused by factors such as oncogenic stress, genomic instability, several anti-cancer treatments and ionizing radiation including radiation therapy (IR). Moreover, in vitro analyses have shown that the ability of various treatments to cause DSBs is directly related to treatment efficacy [1,2]. Therefore, the ability to measure the extent of DSB damage in tumour tissue could provide a prognostic biomarker during cancer therapy.
Although DSBs cannot be measured directly, several assays that provide a secondary marker of the extent of DNA damage can be used to visualize and quantify the cell's response to DSB damage and the signalling pathways of DNA damage response (DDR). One of the earliest and universal events during DDR is the phosphorylation, by the kinases ATM, ATR and DNK-PKcs, of the histone isoform H2AX on serine residue 139 (P-S139) to form γH2AX [3]. γH2AX forms foci of up to a few thousand copies around sites of DSB, and γH2AX foci are widely used to monitor DSB repair in vitro and ex vivo (for reviews, see [4–9]). The phosphorylation event is essential, as in its absence DDR occurs significantly slower [10,11]. P-S139-H2AX acts as a scaffold for the recruitment of other DNA damage repair proteins, including the MRN complex, MDC1, ATM and BRCA1 [4].
Previously, Cornelissen et al. [12] developed a method for imaging DSBs in vivo in which anti-γH2AX antibodies were conjugated to the cell-penetrating peptide TAT, to allow cellular internalization, and to radionuclides or fluorophores, to allow SPECT and fluorescence microscopy, respectively. Here, we present a framework that describes dynamic behaviour in this system and allows us to study perturbations.
Previous mathematical models of DSB repair mechanisms (e.g. [13–15]) have described the sequential construction of complexes that are essential for DSB repair. Typically, systems of ordinary differential equations are used to describe concentrations of relevant complexes. However, as there is not currently a robust quantification of molecular behaviours at individual foci, these models are typically over-parametrized. Moreover, when they are parametrized, the link between available experimental data, made by counting the numbers of DSBs and γH2AX foci across populations of cells, and underlying molecular networks is not formalized. In another body of work, Foray and co-workers (e.g. [16]) develop models that describe the phenomenology of foci appearance and disappearance. These models attempt to describe observations without explicitly accounting for molecular details. As the models have relatively few parameters, they offer a framework for robustly quantifying foci kinetics.
In this paper, we develop a framework in which the simulation of underlying molecular processes can be formally related to experimental observations. The resulting differential equation models differ from previous works in that explicit assumptions made at the molecular scale emerge in the resulting population-scale equations. The model is parametrized using available data from two cancer cell lines and two case studies are considered in which the model is used to study experimentally motivated perturbations in which cell populations are treated with an anti-γH2AX antibody.
2. Methods
2.1. Experimental methods
MCF7 and MDA-MB-468 human breast cancer cells (LGC Standards, Teddington, Middlesex, UK) were cultured as previously described [12]. Cells were tested and authenticated by the provider and their cumulative time in culture was less than six months following retrieval. Rabbit polyclonal anti-γH2AX antibodies (Calbiochem), or non-specific rabbit IgGs were conjugated to TAT-peptide (GRKKRRQRRRPPQGYG; Cambridge peptides, Cambridge, UK), to produce anti-γH2AX-TAT and rabbit IgG-TAT (rIgG-TAT), as previously described [12,17]. The bispecific metal ion chelator, pSCN-BnDTPA, was conjugated to antibody-TAT, to allow radiolabelling with varying amounts of 111In to produce 111In-anti-γH2AX-TAT or 111In-rIgG-TAT of a range of specific activities (the amount of 111In per gram of antibody), as previously described [12,17].
To determine the influence of anti-γH2AX-TAT on γH2AX foci kinetics after irradiation, cells were grown in 96-well plates and exposed to 111In-labelled (1–4 MBq µg−1) or non-labelled (0 MBq µg−1) anti-γH2AX-TAT, rIgG-TAT (0–0.5 mg ml−1) or a molar equivalent of TAT-peptide (0–0.06 mg ml−1). After incubation at 37°C for 1 h, cells were irradiated (4 Gy) using a 137Cs irradiator (1.0 Gy min−1; Gulmay). To avoid DDR signalling pathway activation during irradiation, cells were irradiated on ice. At selected times, cells were washed, fixed and stained for γH2AX using mouse anti-γH2AX antibodies (Millipore; 1 : 1500; 1 h, 37°C) and Alexa fluor 488-labelled goat anti-mouse antibodies (Invitrogen; 1 : 250; 1 h, 37°C) as previously described [12]. Nuclei were counterstained with DAPI. Images were acquired using an IN Cell Analyser (GE Healthcare) and the number of γH2AX foci per cell was determined using proprietary IN Cell Analyser analysis software.
To measure the influence of anti-γH2AX-TAT on the extent of DNA DSB damage, cell suspensions (5 × 10⁵ cells in 500 µl of cell medium) were exposed to anti-γH2AX-TAT or rIgG-TAT (0.5 µg ml−1). After incubation for 1 h at 37°C, cells were irradiated on ice (4 Gy) or sham-irradiated. After incubation at 37°C, neutral comet assays (NCA) were performed at selected time points, using the Trevigen COMETS kit (Trevigen, Helgerman, CT, USA), according to the manufacturer's guidelines. The Olive tail moment (OTM), a measure of the number of DNA DSBs, was determined using software developed in-house, as previously described [17].
To measure the influence of 111In-anti-γH2AX-TAT on clonogenic survival, cell suspensions (2 × 10⁵ cells in 200 µl of medium) were incubated with 111In-anti-γH2AX-Tat or 111In-rIgG-TAT (0.05 µg ml−1, specific activities 0–4 MBq µg−1) for 1 h at 37°C to allow internalization and nuclear accumulation of radioimmunoconjugates (RICs). Cells were exposed to γ-radiation (0 or 10 Gy) and incubated for 24 h at 37°C. An aliquot of cells was plated in DMEM with 10% fetal bovine serum (FBS) (20% for MDA-MB-468 cells) and incubated at 37°C and 5% CO2. Colonies were counted after one to two weeks and the surviving fraction calculated, as previously described [17].
2.2. Model development
Although there are multiple molecular components (e.g. ATM, ATR, H2AX, BRCA1, the MRN complex, MDC1, DNA-PKcs) and processes (e.g. diffusion, binding, phosphorylation) involved in the repair of a DSB, in this study our approach is to develop a theoretical framework that describes fundamental processes that can be constrained by currently available data.
We let the variable X(t) represent a telegraph-like signal that describes whether or not there is a DSB at a particular site such that when a DSB is present, the telegraph signal is on (X = 1) and repair processes can occur. Conversely, when the telegraph signal is off (X = 0), recruitment of repair signalling molecules does not occur. Crucially, the switch from the on to off states is coupled to the dynamics of repair processes at a given site. The second dependent variable, Z(t), represents the number of phosphorylated H2AX molecules at a given site. It is chosen as γH2AX is known to play a crucial role in DSB repair and γH2AX foci are a measurable quantity.
In contrast to histones, which are fixed in a reference frame with DNA, numerous molecules that diffuse in the local environment accumulate at DSB sites to initiate and advance repair (e.g. pATM, ATR, DNA-PKcs). As time-series quantification for each of these variables are not readily available, they are grouped together in the variable Y(t) which denotes the number of bound, activated diffusible molecules at a given DSB site (e.g. pATM). We assume that the presence of bound and activated diffusible molecules is necessary for DSB repair and that the accumulation of such molecules is part of a positive feedback loop with H2AX such that Y both causes the phosphorylation of H2AX (forming γH2AX) and is upregulated by phosphorylated H2AX. Additionally, we assume that the unphosphorylated H2AX is in abundance, hence its concentration is approximately constant. As phosphorylation is many times faster than recruitment, the recruitment and (auto-)phosphorylation of these species is treated as one single step. We note that for brevity below, the variable Y(t) is referred to as pATM but stress that it could represent any diffusible species that binds at DSB site and is necessary for DNA repair.
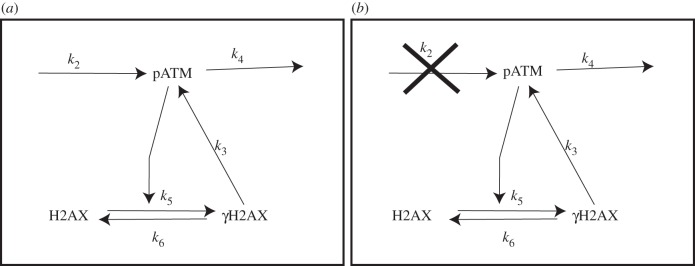
The interactions described above are formalized as follows (see figure 1 for a schematic illustration). In the time interval [t, t + Δt]: (i) DSB repair is dependent on the number of recruited pATM molecules such that the probability of a repair occurring in time Δt is k1Y(t)Δt; (ii) pATM molecules are recruited to a DSB site with probability k2X(t)Δt such that in the presence of a DSB (X = 1), recruitment occurs at rate k2 and upon repair (X = 0), recruitment stops; (iii) pATM molecules are recruited by phosphorylated H2AX with probability k3Z(t)Δt; (iv) H2AX gets phosphorylated to γH2AX with probability k5Y(t)Δt and (v) dissociation of pATM from the DSB site and dephosphorylation of γH2AX occur with probabilities k4Y(t)Δt and k6Z(t)Δt, respectively.
Figure 1.
A schematic of the γH2AX–pATM interaction network. In the presence of a DSB (a), pATM molecules are recruited to the DSB site at rate k2, dissociate at rate k4 and are further recruited by γH2AX at rate k3. H2AX gets phosphorylated and γH2AX dephosphorylated at rates k5 and k6, respectively. In the absence of a DSB (b), a stable steady-state exists in which the concentrations of pATM and γH2AX are zero.
Defining P(X, Y, Z; t) to be the probability that at time t, a DNA site is in state X, with Y molecules of bound pATM and Z molecules of phosphorylated H2AX, the stochastic processes outlined in the previous paragraph are described by the master equation
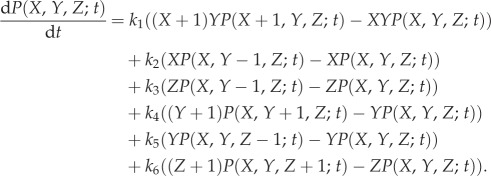 |
2.1 |
Note that we use the convention that P(2, Y, Z; t) = 0.
Using Gillespie's stochastic simulation algorithm (SSA), solutions of equation (2.1) for initial conditions in which there is a DSB at a given site and zero molecules of pATM and γH2AX were calculated (figure 2). In a typical simulation, the diffusible molecules bind at the DSB site, leading to the accumulation of γH2AX and further accumulation of pATM. Eventually, as a consequence of the presence of diffusible molecules, the telegraph signal is switched off. Consequently, dissociation and dephosphorylation of repair molecules become the dominant processes and the system eventually reaches a steady state where the telegraph signal is off and there are no longer any bound repair molecules.
Figure 2.
Sample realizations of equation (2.1). Lines depict five different stochastic simulations. (a) The presence of a DSB, X(t) is plotted against time, t. (b) The number of pATM molecules, Y(t), is plotted against time, t. (c) The number of γH2AX molecules, Z(t), is plotted against time, t. Parameter values as in table 1. (Online version in colour.)
Given that experiments are typically performed over thousands of DSBs (approx. 40 DSBs per cell per Gy [18]), we define the stochastic means
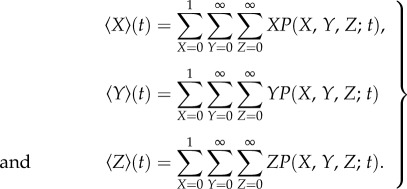 |
2.2 |
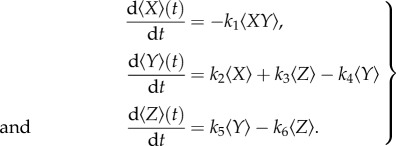
Upon differentiation of the above quantities with respect to time, we obtain, using equation (2.1) and some standard manipulations,
 |
2.3 |
2.3. Moment closure
The first of equations (2.3) contains a nonlinear term that requires a further approximation to define a closed model.
2.3.1. An ad hoc closure
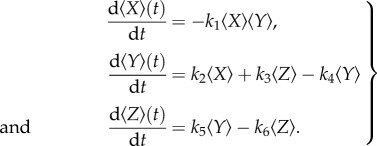
The simplest closure is to assume that
| 2.4 |
which would be the case if 〈X〉 and 〈Y〉 were independent (uncorrelated). Equations (2.3) then take the form
 |
2.5 |
2.3.2. Conditional means
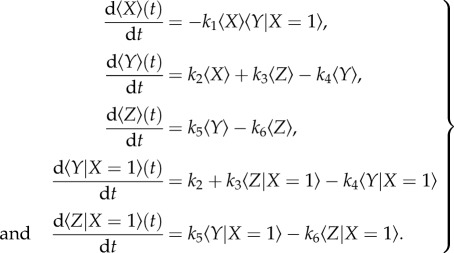
We can perform a higher-order closure by introducing conditional means. We have
 |
2.6 |
where  is the conditional mean value of the variable Y when X = 1. Defining governing equations for the conditional means yields
 |
2.7 |
Closing the model by assuming that the conditional (co)variances are negligible, we obtain
 |
2.8 |
3. Results
3.1. Examining stochastic model behaviour
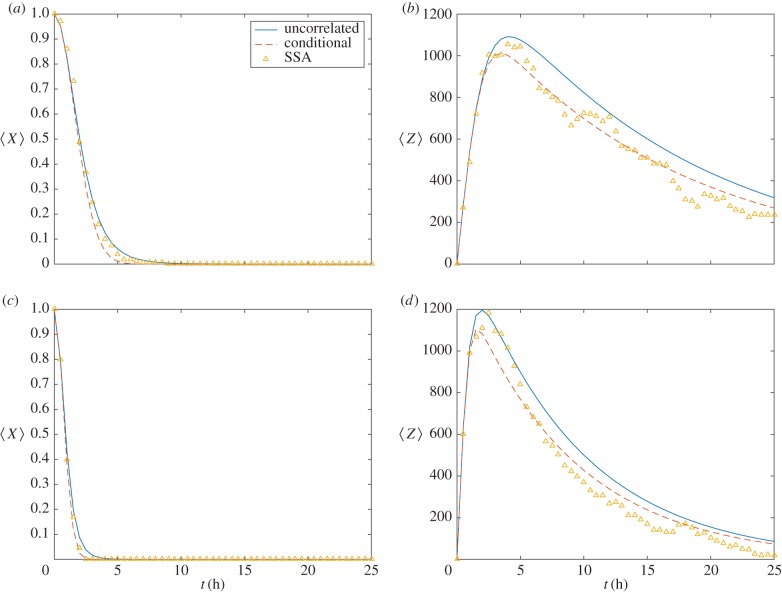
To ensure that the closures presented in §2.3 provide a sufficiently accurate description of the mean behaviours of the solutions presented in figure 2, sample means, calculated from averaging over 1000 stochastic realizations, are compared with solutions of the differential equation model (figure 3). These numerical results illustrate that, at least for the parameter values chosen, the differential equation model is an accurate representation of the underlying stochastic model.
Figure 3.
Investigating the moment closure approximation used to derive equations (2.5). (a,c) Expected number of DSBs,  is plotted against time, t. (b,d) Expected number of γH2AX molecules,
  , is plotted against time, t. Realizations of equation (2.1) are averaged (markers) and compared with solutions of equations (2.8) (dashed lines) and (2.5) (solid lines). Parameter values defined in table 1. MDA-MB-468 (a,b); MCF7 (c,d). (Online version in colour.)
3.2. Parameter identification
Defining χ1(t) and χ2(t) to be the time-series measurements for the average numbers of DSBs and γH2AX foci per cell, respectively (e.g. see §2.1 for further details), we seek the optimal parameter set {k1, k2, …,k6} that describes the observations for a given cell line.
The variable  which represents the expected number of γH2AX molecules at a given focus, is related to the experimentally measured quantity χ2(t), the number of observable γH2AX foci, by assuming that
| 3.1 |
thus ensuring that the model solution recapitulates the number of γH2AX molecules thought to be at a typical focus. Notably, previous authors have made similar assumptions to fit molecular models to foci kinetic data. In §3.1, we will use the SSA to check the validity of this assumption a posteriori.
The observation that DSB repair occurs significantly slower (approx. 10 times) in the absence of H2AX [10,11] is captured by defining, in the absence of explicit time-series measurements,
| 3.2 |
To represent the case of no γH2AX, this quantity is fitted to the model by solving equations (2.5) with the parameter k5 = 0. We denote such solutions using a barred notation (i.e. the number of DSBs in a model solution representing the case of no γH2AX is given by  ).
).
Combining the above assumptions, the least-squares error, given by
 |
3.3 |
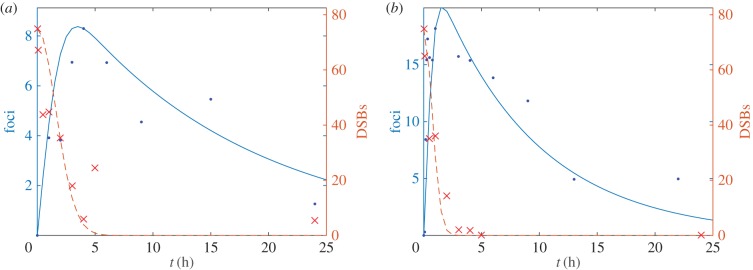
is minimized using the Nelder–Mead simplex direct search method implemented via Matlab's fminsearch function. In table 1 and figure 4, the parameter values fitted to the MCF7 and MDA-MB-468 cell lines are presented. We note that the values for the constants presented in table 2 are estimated counts of molecules at individual foci.
Table 1.
Numerical values for fitted rate parameters. Solutions of equations (2.8) were calculated and the parameter set {k1, k2, … , k6,} that minimizes equation (3.3) was determined. All rate constants have unit h−1.
| parameter | MDA-MB-468 | MCF7 |
|---|---|---|
| k1 | 0.0032 | 0.02 |
| k2 | 159 | 1236 |
| k3 | 14 | 220 |
| k4 | 71 | 687 |
| k5 | 1056 | 1765 |
| k6 | 211 | 565 |
Figure 4.
γH2AX foci (solid lines, dots) and DSB (dashed lines, crosses) number are plotted against time for (a) MDA-MB-468 and (b) MCF7 cells. Experimental data are denoted by markers. The solution of the averaged model (2.8) (lines) was computed using the optimized parameter sets presented in table 1. (Online version in colour.)
Table 2.
A priori assumed quantities used in the fitting of the rate constants defined in table 1.
| parameter | value | description |
|---|---|---|
| Ymax | 300 | maximum number of bound pATM molecules per DSB |
| Zmax | 1000 | number of γH2AX molecules in focus |
| Z* | 200 | number of γH2AX molecules needed to make focus detectable |
3.3. Number measured foci is proportional to mean number of γH2AX molecules
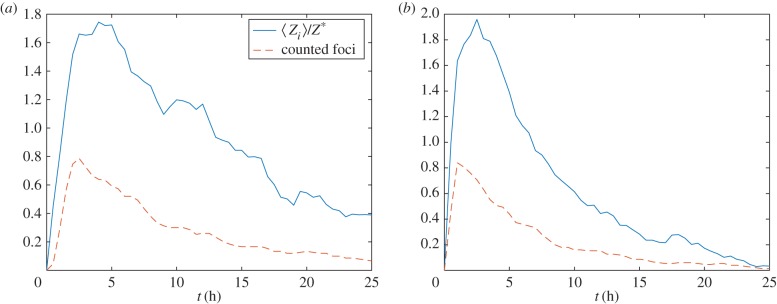
Both in the parametrization described in §3.2 and in previous studies, it has been assumed that the experimentally measured number of observable foci is proportional to the total number of γH2AX molecules counted across a number of NDSB foci and averaged over an ensemble of realizations [13]. The stochastic model is used to investigate this assumption as follows: in a given stochastic realization, we determine that a γH2AX focus is detectable under the microscope if the number of γH2AX molecules exceeds some threshold, Z*, and calculate the expected number of visible foci in a population of NDSB DSBs over an ensemble of realizations. In figure 5, we show, that for the parameter values chosen, the counted number of foci is proportional to the mean number of γH2AX molecules.
Figure 5.
The average number of detectable γH2AX foci ( , solid line) and γH2AX molecules (〈Z〉(t), dashed line) are plotted against time. (a) MDA-MB-468 and (b) and MCF7. Realizations of equation (2.1) were calculated using Gillespie's algorithm. Parameter values as in table 1. (Online version in colour.)
4. Case study
In this case study, we explore how the proposed framework can be used to understand modulation of the DSB repair system by exogenous agents. In each of the subsections below, we present an experimentally motivated problem, apply the model developed above, and interpret the biological implications of the results.
4.1. Influence of γH2AX-TAT
4.1.1. Model extension and application
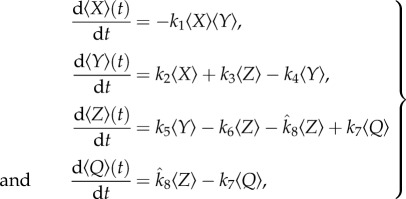
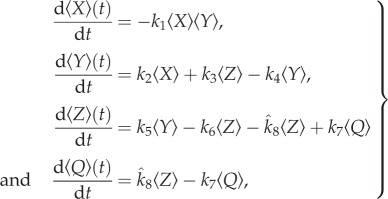
To account for the effect of the anti-γH2AX-TAT antibody, it is assumed that anti-γH2AX-TAT binds reversibly to γH2AX and that the bound complex is inert (i.e. it prevents interaction of γH2AX with pATM, see schematic diagram presented in figure 6). Following a similar procedure to that outlined in §2.2 (see appendix A), we obtain
 |
4.1 |
where 〈Q〉(t) is the expected numbers of bound antibody–γH2AX molecules,
| 4.2 |
[TAT]0 is the concentration of anti-γH2AX-TAT antibody, and k7 and k8 are dissociation and binding rates, respectively.
Figure 6.
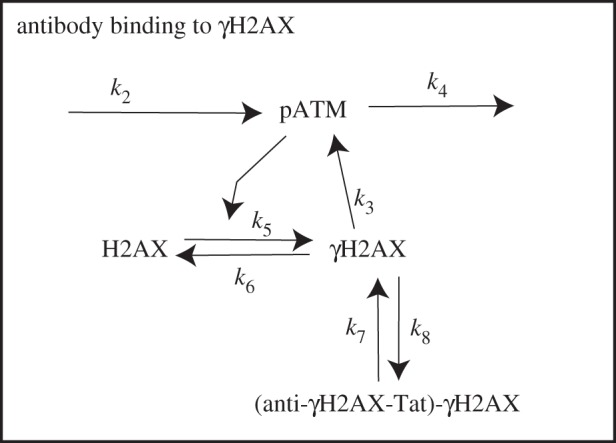
A schematic of inclusion of the anti-γH2AX antibody.
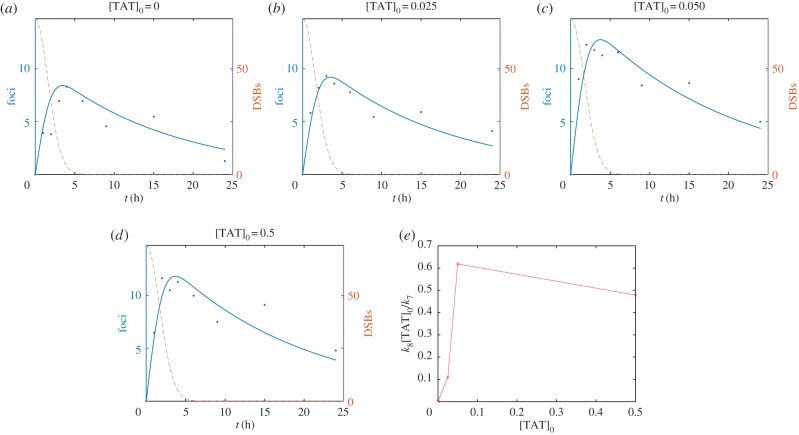
Given the fitted values for parameters k1, k2, … , k6 defined in table 1, a prediction of the model is that the parameter combination  should increase linearly with the amount of anti-γH2AX-TAT ([TAT]0) added to cells. In figure 7, this prediction is tested by fitting the parameter
  to foci data measured at different antibody concentrations. Notably, at low antibody concentration the model prediction is observed but at the high antibody concentration there is a saturation effect that is not predicted by the model. A further prediction of the model is that DSB kinetics are largely unaffected by introduction of the antibody. This predicted behaviour has been validated experimentally using neutral comet experiments (see appendix B). The model therefore supports the hypothesis that the use of anti-γH2AX antibody to quantify DSBs does not violate the image tracer principle.
Figure 7.
γH2AX foci (solid lines, dots) and DSB (dashed lines) number are plotted against time. (a) [TAT]0 = 0, (b) [TAT]0 = 0.025, (c) [TAT]0 = 0.05 and (d) [TAT]0 = 0.5 µg ml−1. Lines represent solution to equations (4.1). Markers represent experimental observations from MDA-MB-468 cell line. (e) Fitted value of the parameter grouping k8[TAT]0/k7 is plotted against [TAT]0. (Online version in colour.)
4.2. Auger electron therapy
4.2.1. Problem outline
In addition to γ photons that allow SPECT imaging, 111In emits short-pathlength, densely ionizing Auger electrons that have the potential to cause complex DNA damage when radionuclide decay occurs in the nucleus [19]. In previous experimental work, it has been demonstrated that when 111In-anti-γH2AX-TAT, labelled to high specific activity (i.e. a large amount of 111In per unit of antibody), accumulates at DSB sites, it amplifies the DNA damage, decreases clonogenicity, and inhibits tumour growth [17]. In this section, we use the parametrized model defined in §2.2 to investigate this phenomenon.
4.2.2. Model extension and application
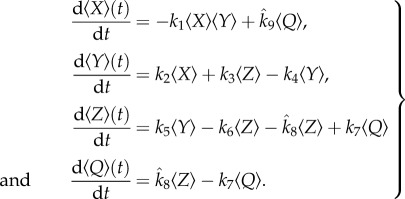
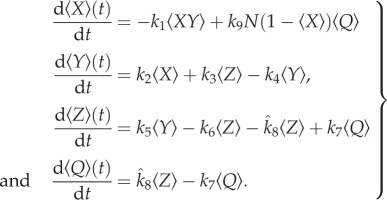
To investigate DSB and γH2AX foci dynamics upon introduction of 111In-anti-γH2AX-TAT antibody, the model developed in §2.2 is extended to include the formation of de novo DSBs as a result of Auger electron irradiation from 111In-anti-γH2AX. By considering a population of N DNA sites and assuming that each molecule of antibody bound γH2AX initiates new DSBs at rate k9, we obtain, after following a similar procedure to that outlined in §2.2 (see appendix C):
 |
4.3 |
We make the assumption that the probability a given 111In-anti-γH2AX-TAT molecule initiates a DSB is proportional to the specific activity of 111In, R. Hence
| 4.4 |
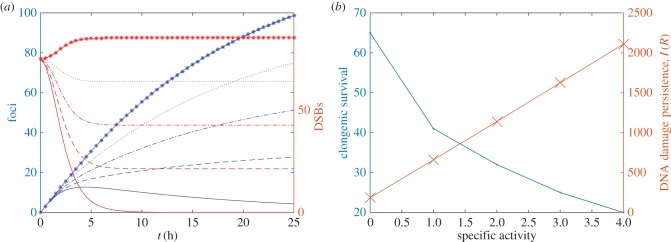
Numerical solutions of equations (4.3) for different values of specific activity R are presented in figure 8.
Figure 8.
(a) Number of DSBs and γH2AX foci are plotted against time at increasing values of parameter  Equations (4.3) and (4.5) were solved for different values of R. Solid lines, R = 0; dashed line, R = 2; dot-dashed line, R = 4, dotted line, R = 6, asterisked line R = 8. (b) Experimental measurements of clongenic survival (crosses) and model calculations of AUC (dots) are plotted against specific activity. (Online version in colour.)
4.2.3. Results and interpretation
To compare the model results presented in figure 8a with experimental observations, we define the quantity
| 4.5 |
as a measure of the amount and persistence of DSBs. In figure 8b, we show that persistence and specific activity are positively correlated.
While DNA damage persistence cannot be measured directly experimentally, we note that cell survival has previously been reported to be inversely correlated with levels of DNA damage (e.g. [20,21]). Furthermore, we have previously measured an inverse correlation between the clonogenic survival of MCF7 cells after exposure to 111In-anti-γH2AX-TAT and specific activity of 111In (figure 8) (R2 = 0.97). These observations suggest that the number of DSBs is positively correlated with specific activity, hence providing qualitative support for the model prediction.
5. Discussion
During the process of DNA damage repair, numerous molecules in the repair pathway enter an activated state, recognize DNA damage site, initiate repair and disassemble. Via the use of, for example, antibodies that recognize repair processes, the kinetics of repair can be measured. From such data, one can attempt to formulate models of the crucial events that underly the repair process.
Mathematical models allow one to unambiguously formulate and test hypotheses. In the context of the modelling of the DNA repair pathway, there are two well-developed schools. In the first of these, multiple steps in the repair pathway are described. This approach allows one to account for what is known about the numerous molecular players in the system and formulate hypotheses about their mutual interaction. In the latter, the kinetics of foci appearance/disappearance are described but not explicitly the molecular detail.
This study was motivated by a set of experiments in which the introduction of an antibody alters the kinetics of γH2AX foci. To investigate this behaviour, we developed a minimal, stochastic model of essential interactions at the molecular scale. Given that experiments are averaged over thousands of DSBs, we derived ODEs that describe average behaviour within the stochastic model. Using existing experimental data from two cancer cell lines, the parameters in the stochastic model were determined for both cases. We note that the MCF-7 breast cancer cells conform to the repair behaviour observed in most cancer cell lines, where foci appear soon after irradiation, as shown in figure 4b. On the other hand, the MDA-MB-468 cells show much delayed repair kinetics, evident from figure 4a, and consistent with our earlier data regarding this cell line [12,17,22].
Having developed a model that can explain observations in a non-perturbed case, we extended it to investigate behaviour upon the introduction of anti-γH2AX antibody. A prediction of the model is that the measured rate of formation of antibody-bound γH2AX ought to increase linearly with antibody concentration. This behaviour was found in the experiments at low antibody concentrations. Importantly, the model predicts that the modified foci kinetics are not accompanied by significant changes to the DSB kinetics. This behaviour is also observed experimentally. Hence the model supports the hypothesis that the use of anti-γH2AX antibody to image DNA damage does not violate the image tracer principle. Interestingly, the model indicated the existence of a feedback mechanism, whereby more H2AX is phosphorylated to compensate for γH2AX masked through anti-γH2AX-TAT binding. These effects are consistent with and account for the increased number of foci found after exposure of irradiated cells to anti-γH2AX-TAT.
The presence of 111In-labelled anti-γH2AX-TAT can deliver short pathlength, highly ionizing Auger electron irradiation specifically to sites of existing DNA damage, resulting in the induction of new DNA damage. To investigate this phenomenon, we developed the existing model to allow for new DSB induction at a rate proportional to the amount of labelled anti-γH2AX-TAT antibody. By assuming that the induction rate is proportional to the specific activity of the 111In, the model can predict the DNA damage load as a function of specific activity. Although this quantity cannot be measured directly in experiments, we used measurements of the clonogenic survival of MCF7 cells as a proxy for DNA damage and found good qualitative agreement between the model and experimental observations.
An assumption made, both in this study and others, while fitting model parameters to experimental counts of γH2AX foci number is that the number of observable foci is proportional to the total number of γH2AX molecules. Using the SSA, we tested this assumption by assuming a γH2AX focus becomes visible under the microscope when the number of γH2AX molecules at a site exceeds a certain threshold. Hence, within the context of the stochastic model, we could count the number of observed foci and the mean number of γH2AX molecules. In our approximation, we found that these quantities did scale with one another, thereby validating this assumption. However, this point raises the issue that in this and similar studies, foci kinetics, which depend on, for example, imaging parameters that determine whether or not a focus is detected, are used to infer details of underlying molecular networks. Measurement of absolute molecule numbers would allow models to be further tested and, for example, the parameters in table 2 to be explicitly measured.
The theoretical framework adopted in this study could be readily extended to account for a more accurate representation of molecular networks regulating DSB repair. For example, instead of assuming there is a single diffusible species that binds to a DSB site, phosphorylates H2AX and is solely responsible for the rate of DNA repair, the variable Y(t) could represent a vector of N molecular species that contribute to the DNA repair rate. Furthermore, our treatment of DNA repair could be modified to account for persistent DSBs that do not appear to undergo repair. We have not addressed these issues in the current work as there are not currently data to constrain the additional parameters.
While modelling the induction of new DSBs as a result of the presence of 111In-anti-γH2AX-TAT antibodies, we have used a mean-field assumption in which new sites of DNA damage are independent of the spatial location of current DSBs. In reality, one would expect that new sites of DNA damage are strongly correlated with the spatial location of current sites as Auger electrons decay over short distances. This topic will be explored in a future publication.
Acknowledgements
The authors would like to thank Prof. Peter O'Neill for the interactive discussions and supporting comments.
Appendix A. Model development for anti-γH2AX antibody
We assume that the probabilities of antibody binding and unbinding with γH2AX in the time interval [t, t + Δt] are given by
| A 1 |
and
| A 2 |
respectively, where T(t), Z(t) and Q(t) are the numbers of unbound anti-γH2AX-TAT, anti-γH2AX-TAT bound to γH2AX, and γH2AX molecules, respectively, at time t; and k7 and k8 are rate parameters.
We define P(X, Y, Z, Q; t) to be the probability that at time t, a DNA site is in state X, with Y molecules of bound pATM, Z molecules of phosphorylated H2AX and Q molecules of antibody-bound phosphorylated H2AX. Given the stochastic processes outlined in the main text, a master equation describing the evolution of P(X, Y, Z, Q; t) is given by
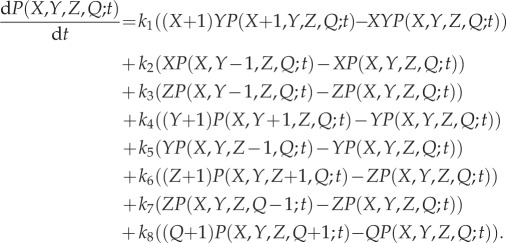 |
A 3 |
Following the procedure outlined in §2.2,  and
and  are defined to be the mean numbers of free antibody and bound antibody–γH2AX complex, respectively. Making the additional assumption that the total amount of antibody is conserved,
| A 4 |
where [TAT]0 is the total antibody concentration, and following a similar procedure to that outlined in §2.2, we obtain:
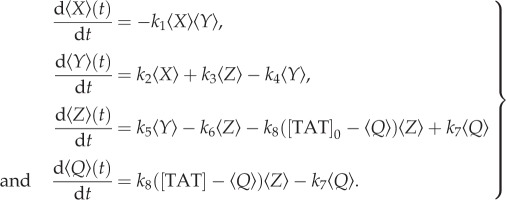 |
A 5 |
Making the further additional assumption that free anti-γH2AX-TAT antibody is always in excess of its substrate (γH2AX), i.e.
| A 6 |
equations (A 5) simplify to
 |
A 7 |
where we define
| A 8 |
Appendix B. Neutral comet assay following anti-γH2AX-TAT treatment
Using a neutral comet assay as a readout for the relative amount of DNA DSBs, we did not observe a significant difference in the Olive tail moment after irradiation following treatment of MCF-7 cells with or without the addition of 0.5 µg ml−1 anti-γH2AX-TAT (p = 0.29, figure 9).
Figure 9.
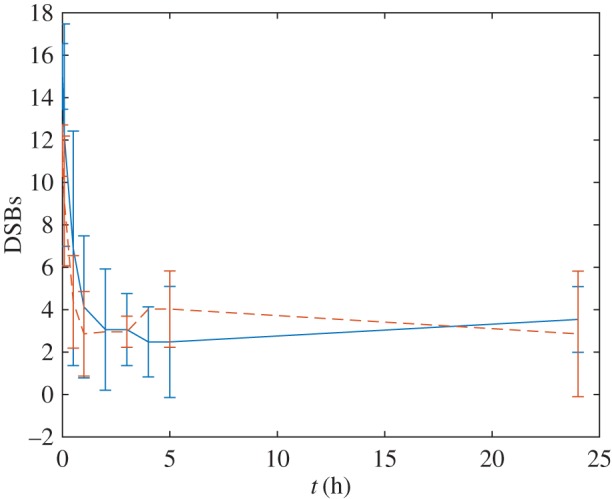
Amount of DNA DSBs, measured using a neutral comet assay, plotted against time post-irradiation for control (solid line) and 0.5 µg ml−1 anti-γH2AX-TAT (dashed line). (Online version in colour.)
Appendix C. Model development for anti-γH2AX antibody tagged with 111In.
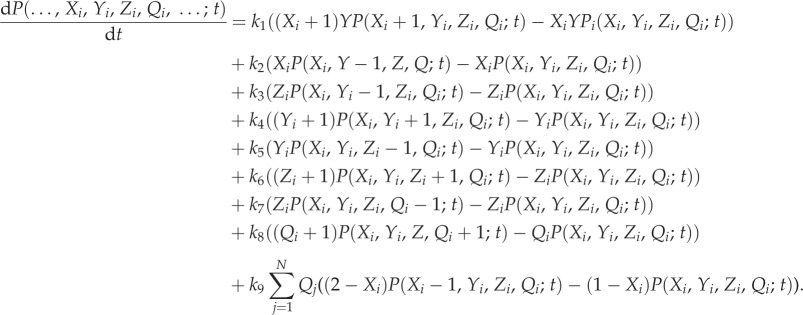
To consider the induction of new DSBs, we consider a population of N DNA sites and define P(…, Xi, Yi, Zi, Qi,…;t) to be the probability that at time t, the ith DNA site is in state Xi, with Yi molecules of bound pATM, Zi molecules of phosphorylated H2AX and Qi molecules of antibody-bound phosphorylated H2AX. Given the stochastic processes outlined in the previous paragraph, a master equation describing the evolution of P(Xi,Yi,Zi,Qi;t) is given by
 |
C 1 |
Assuming that each site has an equal initial probability of being a DSB, the ensemble average at each of the i sites will be identical. Hence, dropping the subscripted notation, the governing equations are given by
 |
C 2 |
Assuming that 
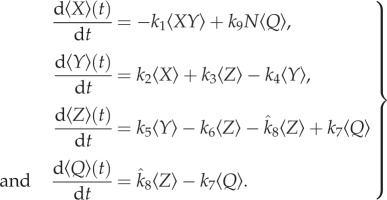 |
C 3 |
Authors' contributions
P.J.M. and B.C. wrote the manuscript. P.J.M., B.C., S.J.C. and K.A.V. developed the model. B.C. performed the laboratory experiments and P.J.M. the computations.
Competing interests
We declare we have no competing interests.
Funding
This research was supported financially by Cancer Research-UK and the CRUK/EPSRC/MRC/NIHR Oxford Cancer Imaging Centre. Funding bodies had no role in study design; in the collection, analysis and interpretation of data; in the writing of the report; or in the decision to submit the article for publication.
References
- 1.Banáth JP, Klokov D, MacPhail SH, Banuelos CA, Olive PL. 2010. Residual H2AX foci as an indication of lethal DNA lesions. BMC Cancer 10, 4 ( 10.1186/1471-2407-10-4) [DOI] [PMC free article] [PubMed] [Google Scholar]
- 2.Nikolova T, Dvorak M, Jung F, Adam I, Krämer E, Gerhold-Ay A, Kaina B. 2014. The H2AX assay for genotoxic and non-genotoxic agents: comparison of H2AX phosphorylation with cell death response. Toxicol. Sci. 140, 103–117. ( 10.1093/toxsci/kfu066) [DOI] [PubMed] [Google Scholar]
- 3.Rogakou EP, Pilch DR, Orr AH, Ivanova VS, Bonner WM. 1998. DNA double-stranded breaks induce histone H2AX phosphorylation on serine 139. J. Biol. Chem. 273, 5858–5868. ( 10.1074/jbc.273.10.5858) [DOI] [PubMed] [Google Scholar]
- 4.Ivashkevich A, Redon CE, Nakamura AJ, Martin RF, Martin OA. 2011. Use of the γ-H2AX assay to monitor DNA damage and repair in translational cancer research. Cancer Lett. 327, 123–133. ( 10.1016/j.canlet.2011.12.025) [DOI] [PMC free article] [PubMed] [Google Scholar]
- 5.Jeggo P, Lavin MF. 2009. Cellular radiosensitivity: how much better do we understand it? Int. J. Radiat. Biol. 85, 1061–1081. ( 10.3109/09553000903261263) [DOI] [PubMed] [Google Scholar]
- 6.Kinner A, Wu W, Staudt C, Iliakis G. 2008. γ-H2AX in recognition and signaling of DNA double-strand breaks in the context of chromatin. Nucleic Acids Res. 36, 5678–5694. ( 10.1093/nar/gkn550) [DOI] [PMC free article] [PubMed] [Google Scholar]
- 7.Martin OA, Bonner WM. 2006. H2AX in cancer cells: a potential biomarker for cancer diagnostics, prediction and recurrence. Cell Cycle 5, 2909–2913. ( 10.4161/cc.5.24.3569) [DOI] [PubMed] [Google Scholar]
- 8.Redon CE, Dickey JS, Bonner WM, Sedelnikova OA. 2009. γ-H2AX as a biomarker of DNA damage induced by ionizing radiation in human peripheral blood lymphocytes and artificial skin. Adv. Space Res. 43, 1171–1178. ( 10.1016/j.asr.2008.10.011) [DOI] [PMC free article] [PubMed] [Google Scholar]
- 9.Redon CE, et al. 2011. γ-H2AX detection in peripheral blood lymphocytes, splenocytes, bone marrow, xenografts, and skin. Methods Mol. Biol. 682, 249–270. ( 10.1007/978-1-60327-409-8_18) [DOI] [PubMed] [Google Scholar]
- 10.Celeste A, et al. 2002. Nussenzweig. Genomic instability in mice lacking histone H2AX. Sci. Signalling 296, 922. [DOI] [PMC free article] [PubMed] [Google Scholar]
- 11.Bassing CH, et al. 2002. Increased ionizing radiation sensitivity and genomic instability in the absence of histone H2AX. Proc. Natl Acad. Sci. 99, 8173–8178. ( 10.1073/pnas.122228699) [DOI] [PMC free article] [PubMed] [Google Scholar]
- 12.Cornelissen B, Kersemans V, Darbar S, Thompson J, Shah K, Sleeth K, Hill MA, Vallis KA. 2011. Imaging DNA damage in vivo using H2AX-targeted immunoconjugates. Cancer Res. 71, 4539–4549. ( 10.1158/0008-5472.CAN-10-4587) [DOI] [PMC free article] [PubMed] [Google Scholar]
- 13.Cucinotta FA, Pluth JM, Anderson JA, Harper JV, O'Neill P. 2008. Biochemical kinetics model of DSB repair and induction of γ-H2AX foci by non-homologous end joining. Radiat. Res. 169, 214–222. ( 10.1667/RR1035.1) [DOI] [PubMed] [Google Scholar]
- 14.Taleei R, Nikjoo H. 2013. The non-homologous end-joining (NHEJ) pathway for the repair of DNA double-strand breaks: I. A mathematical model. Radiat. Res. 179, 530–539. ( 10.1667/RR3123.1) [DOI] [PubMed] [Google Scholar]
- 15.Taleei R, Girard PM, Sankaranarayanan K, Nikjoo H. 2013. The non-homologous end-joining (NHEJ) mathematical model for the repair of double-strand breaks: II. Application to damage induced by ultrasoft x rays and low-energy electrons. Radiat. Res. 179 540–548. ( 10.1667/RR3124.1) [DOI] [PubMed] [Google Scholar]
- 16.Bodgi L, et al. 2013. A single formula to describe radiation-induced protein relocalization: towards a mathematical definition of individual radiosensitivity. J. Theor. Biol. 333, 135–145. ( 10.1016/j.jtbi.2013.05.020) [DOI] [PubMed] [Google Scholar]
- 17.Cornelissen B, Darbar S, Kersemans V, Allen D, Falzone N, Barbeau J, Smart S, Vallis KA. 2012. Amplification of DNA damage by a H2AX-targeted radiopharmaceutical. Nuclear Med. Biol. 39, 1142–1151. ( 10.1016/j.nucmedbio.2012.06.001) [DOI] [PubMed] [Google Scholar]
- 18.Rothkamm K, Löbrich M. 2003. Evidence for a lack of DNA double-strand break repair in human cells exposed to very low X-ray doses. Proc. Natl Acad. Sci. USA 100, 5057–5062. ( 10.1073/pnas.0830918100) [DOI] [PMC free article] [PubMed] [Google Scholar]
- 19.Cornelissen B, Vallis KA. 2010. Targeting the nucleus: an overview of Auger-electron radionuclide therapy. Curr. Drug Disc. Technol. 7, 263–279. ( 10.2174/157016310793360657) [DOI] [PubMed] [Google Scholar]
- 20.Ng CE, Mazaheri K, Payant C, Raaphorst GP. 2001. Evaluation of cell survival, DNA double strand breaks, and DNA synthesis during concurrent camptothecin and X-radiation treatments. Int. J. Cancer 96, 277–285. ( 10.1002/ijc.1031) [DOI] [PubMed] [Google Scholar]
- 21.Menegakis A, Yaromina A, Eicheler W, Dörer A, Beuthien-Baumann B, Thames HD, Baumann M, Krause M. 2009. Prediction of clonogenic cell survival curves based on the number of residual DNA double strand breaks measured by H2AX staining. Int. J. Radiat. Biol. 85, 1032–1041. ( 10.3109/09553000903242149) [DOI] [PubMed] [Google Scholar]
- 22.Cornelissen B, Waller A, Able S, Vallis KA. 2013. Molecular radiotherapy using cleavable radioimmunoconjugates that target EGFR and H2AX. Mol. Cancer Ther. 12, 2472–2482. ( 10.1158/1535-7163.MCT-13-0369) [DOI] [PubMed] [Google Scholar]


