Abstract
Purpose:
The purpose was to examine the relationship between neurocognitive function and two distinct forms of retinopathy in sickle cell disease.
Materials and Methods:
Patients with sickle cell disease (n = 44, age range: 19-56 years, 70% female) were prospectively recruited for this cross-sectional study. Retinopathy was characterized by: (1) Presence of focal retinal thinning on spectral domain optical coherence tomography and (2) determination of the sickle retinopathy stage on funduscopic exam based on Goldberg classification. Neurocognitive function was assessed using the Philadelphia Brief Assessment of Cognition (PBAC), a validated test of cognition. Univariate and multivariate analyses for PBAC score outcomes were performed. Retinal thinning and retinopathy stage were primary variables of interest and age, gender, genotype, education, and history of stroke were covariates.
Results:
Univariate analysis revealed associations with total PBAC score and age (P = 0.049), history of stroke (P = 0.04), and genotype (P < 0.001). Focal retinal thinning and Goldberg retinopathy stage were not associated with each other in this sample. Neither the presence of focal retinal thinning nor degree of retinopathy was associated with total PBAC score in univariate or multivariate analyses.
Conclusions:
We find an association between lower cognitive function and older age, history of stroke and sickle cell genotype SS in patients with sickle cell disease. Our data do not provide evidence to support an association between cognitive function and retinopathy in sickle cell patients.
Keywords: Neurocognitive Testing, Optical Coherence Tomography, Sickle Cell Disease, Sickle Retinopathy
INTRODUCTION
Patients with sickle cell anemia (SCA) suffer from manifestations of vascular occlusive disease throughout the body, including the retina and brain, which results from sickling of erythrocytes, increased blood viscosity, and veno-stasis in the setting of hypoxia, acidosis, and inflammation.1 Neurologic complications include both overt and silent ischemic strokes as well as neurocognitive decline.2,3,4 Global cerebral ischemia in children with no evidence of ischemic strokes on conventional magnetic resonance imaging (MRI) has been proposed as the cause of neurocognitive impairment in this population.5,6 Adults with SCA have also been shown to have cognitive performance below that of control subjects which are associated with a degree of anemia and age.4
In the retina, hypoxia due to sickling of erythrocytes is thought to be the cause of sickle retinopathy,7 which is classified by the Goldberg staging system based on funduscopic examination.8 In recent years, spectral domain optical coherence tomography (SDOCT), a noninvasive imaging technique that provides high resolution cross-sectional in vivo images, has become an integral tool in the field of ophthalmology for studying diseases of the retina and choroid. Previous studies from our group using SDOCT showed a retinal pathology in the form of focal macular thinning that is distinct from classic sickle retinopathy (Chau et al. IOVS 2010;51:ARVO E-Abstract 3554). It is present in about 50% of SCA eyes without clinically significant retinopathy on funduscopic exam, and it is predominantly in the inner retinal layers. In those who do not have obvious focal thinning, subclinical thinning is present in the outer retinal layers and extrafoveal regions compared to age-matched controls by manual segmentation.9 The thin regions correlate with decreased retinal sensitivities by microperimetry, though subjective and objective vision testing is otherwise typically normal.10 The diagnostic and prognostic implications of these areas of focal thinning have yet to be elucidated. The etiology is hypothesized to be microvascular occlusive disease.
There is a growing body of literature to support retinopathy and retinal blood vessel changes associated with non-SCA vascular disease states such as hypertension and diabetes mellitus as possible markers for cerebral vascular disease.11,12,13,14 Furthermore, the association between arterial oxygen saturation and the larger retinal venule diameter, especially in patients with low cerebral perfusion pressure, was observed in the Rotterdam Study patient population.15 Most recently, Haan et al. showed that the presence of retinopathy was associated with poorer scores on mini-mental status exam over a 10-year follow-up period.11 This suggests that retinopathy may serve as a marker for cerebrovascular disease that is reflected in decreased cognitive performance.
We hypothesized that both retinal thinning on SDOCT and degree of retinopathy in patients with SCA are markers for cerebral vasculopathy and therefore will be associated with reduced cognitive function. The purpose of this investigation was to compare cognitive function in SCA patients with and without focal retinal thinning as well as in patients with mild versus severe sickle retinopathy.
MATERIALS AND METHODS
The Institutional Review Board approved this study prior to enrollment. Informed consent was obtained from all subjects before their participation in this prospective observational study.
Patient selection
Subjects were recruited from patients undergoing evaluations for sickle retinopathy. Inclusion criteria were 18 years of age or older and electrophoretic confirmation of sickle cell disease (SS) or sickle cell-hemoglobin C disease (SC). Exclusion criteria were neurological disease other than cerebrovascular disease. Medical histories, sickle hemoglobinopathy type, gender, and age were recorded from the medical record. Level of education was self-reported and categorized into two groups: High school education and education beyond high school level. History of stroke was determined for each patient by self-report and medical record review.
Neurocognitive testing
Cognitive testing was performed by two of the authors (E.O. and T.W.) who were blinded to the patient's ophthalmic exam and optical coherence tomography (OCT) images. Training and oversight were provided by a board-certified neurologist with experience in administration of the tests used (H.M.). The Philadelphia Brief Assessment of Cognition (PBAC) was selected for use in this study in order to minimize the time burden to the subject and maximize enrollment in this pilot study. This validated screen takes approximately 10-15 min to administer and includes eleven tests that assess four cognitive domains (executive function, visual spatial operations, language, and episodic memory).16 Total scores range from 0 to 75, where higher numbers indicate better performance. Maximum subscore values are 17 (executive), 21 (memory), 18 (visual-spatial), and 19 (language). A fifth domain (behavioral/social comportment) was not included in the analysis because it was not abnormal in any subject.
Macular optical coherence tomography measurements
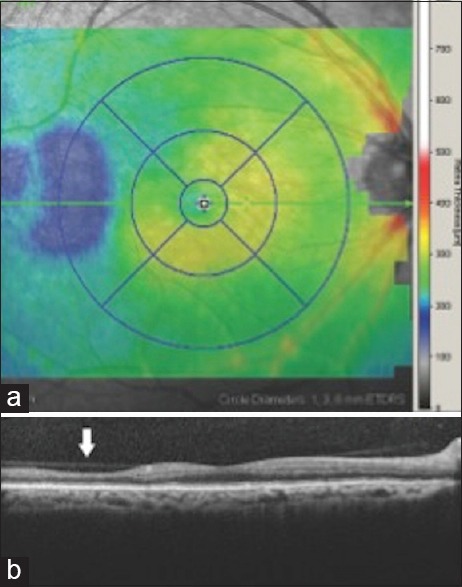
All patients underwent SDOCT imaging (Spectralis, Heidelberg Engineering, Inc., Carlsbad, CA) of the macula by trained ophthalmic photographers. Macular scans (9 mm × 7.5 mm, 31 line scans) encompassing the entire early treatment diabetic retinopathy study subfields as well as the neighboring temporal regions was taken. Focal macular thinning was defined as an abrupt decrease in retinal thickness seen on the thickness map [Figure 1]. The patients were grouped into those with and those without focal macular thinning.
Figure 1.

(a) Representative macular spectral domain optical coherence tomography retinal thickness map of right eye showing 9 early treatment diabetic retinopathy study subfields and demonstrating temporal thinning (blue area). (b) Spectral domain optical coherence tomography cross-sectional image through macula in the same patient showing focal temporal retinal thinning (arrow) that corresponds to retinal thinning on above thickness map
Grading of retinopathy
Sickle retinopathy grade was determined on the same day of OCT imaging by two of the authors (J.L. and F.C.) using the staging system described by Goldberg based on funduscopic exam. This includes five stages of sickle retinopathy (Stage I: Peripheral arteriolar occlusions; Stage II: Arteriovenular anastomoses; Stage III: Sea fan neovascularization; Stage IV: Vitreous hemorrhage; Stage V: Is tractional and/or rhegmatogenous retinal detachment).8 All patients in this study had at least Stage I retinopathy. Stage of retinopathy for each patient was determined by the eye with the higher stage. Patients were grouped by low grade (Grade I-II) and high grade (Grade III-V) retinopathy.
Analysis
Univariate statistical analysis was performed to determine associations between total PBAC score, the variables of interest (retinopathy and focal retinal thinning) and each potential covariate (age, education, history of stroke, and hemoglobinopathy genotype) using t-test for independent samples for dichotomous variables and linear regression for continuous variables. For any PBAC subscores demonstrating a normal distribution, a similar analysis was performed.
Two sets of multiple regression analysis models were built. Each included covariates of age, gender, genotype, education, history of stroke, and either focal retinal thinning or severity of sickle retinopathy. Variables were eliminated in a backward manner with a criterion of P < 0.1 required for inclusion in the final model. For any PBAC subscores demonstrating a normal distribution, a similar analysis was performed.
RESULTS
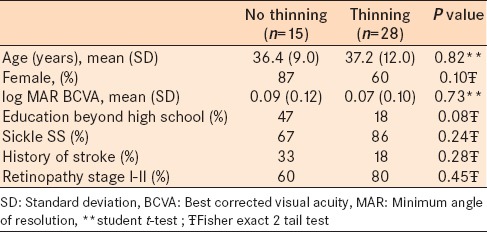
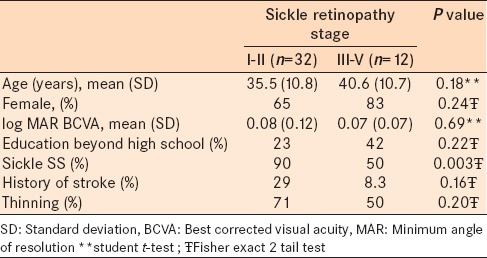
Forty-four subjects were enrolled (age 36.7 ± 10.9 years, 31 female). All were African American, had at least a high school education, and 12 (27%) had at least some postsecondary education. 35 (80%) had sickle SS genotype with the remaining having SC genotype. 11 subjects (25%) had evidence of prior cerebral infarct based either on patient history, medical record, or cerebral MRI. The vision of all subjects ranged from logMAR − 0.10 to 0.30 (20/15 to 20/40) with the average being 0.04 in the better eye. 28 subjects had focal retinal thinning, while 15 did not on SDOCT. The SDOCT did not include the area of interest for one patient who was, therefore, excluded from SDOCT analysis. 32 patients had low-grade (Stage I or II) sickle retinopathy while 12 had high-grade (Stage III or IV) sickle retinopathy. There was no association between focal retinal thinning and retinopathy stage (P = 0.2, Chi-square). Demographic variables did not differ between groups defined using either definition of retinopathy, with the exception of more patients with sickle SS in the low grade retinopathy group (90% vs. 50%, P = 0.003, Fisher's exact) [Tables 1 and 2].
Table 1.
Patient characteristics and demographics in sickle cell patients with and without macular focal thinning

Table 2.
Patient characteristics and demographics in patients with sickle retinopathy stage I-II versus stage III-V

Philadelphia Brief Assessment of Cognition cognitive testing was completed by all subjects. Total score was 53.4 ± 8.4 for all subjects. Subscores for the group were 10.0 ± 2.6 (executive), 16.14 ± 2.5 (language), 15.8 ± 2.4 (visuospatial) and 15.85 ± 3.5 (memory). Distributions for total score and executive subscore were normal. Memory, visual-spatial, and language subscores had negative skew associated with a ceiling effect.
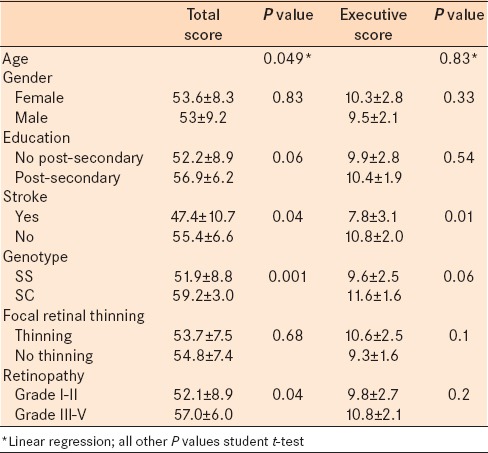
Univariate statistical analysis between PBAC total score, retinopathy variables, and potential covariates revealed associations with age (r2 = 0.09, P = 0.049, linear regression), history of stroke (55.4 ± 6.6 no stroke vs. 47.4 ± 10.7 stroke, P = 0.04, t-test), and genotype (59.2 ± 3.0 SC vs. 51.9 ± 8.8 SS, P < 0.001 t-test) [Table 3]. There were no associations between total PBAC score and gender or postsecondary education (P = 0.83, 0.06 respectively t-test). There was not an association between total PBAC score and presence of focal retinal thinning (P = 0.68, t-test). There was an association between total PBAC score and high grade sickle retinopathy (52.0 ± 8.9 low grade, 57.0 ± 6 high grade, P = 0.04 t-test).
Table 3.
Neurocognitive testing univariate analyses

Univariate statistical analysis between executive function subscore, retinopathy variables, and potential covariates revealed an association with history of stroke (10.8 ± 2.0 no stroke vs. 7.9 ± 3.1 stroke, P = 0.01, t-test). There were no associations between executive function subscore and age (P = 0.83, linear regression), gender (P = 0.33, t-test) presence of postsecondary education (P = 0.54, t-test), or genotype (P = 0.06 t-test) [Table 3]. There were no associations between executive function subscore and presence of focal retinal thinning or high grade sickle retinopathy (P = 0.10, P = 0.22, t-test).
The final multiple regression model for total PBAC score included age (coefficient − 0.29, 95% CI − 0.46 to − 0.12, P = 0.001), history of stroke (coefficient − 4.8, 95% CI − 9.2 to − 0.42, P = 0.033) and SS genotype (coefficient − 6.1, 95% CI − 10.7 to − 1.6, −P = 0.01).
The final multiple regression model for executive function subscore included presence of focal thinning (coefficient 1.4, 95% CI − 0.1 - 2.9, P = 0.071), history of stroke (coefficient − 2.2, 95% CI − 2.85 to − 0.49, P = 0.013), and SS genotype (coefficient − 1.8, 95% CI: −3.6 to − 0.07, P = 0.04).
DISCUSSION
There is evidence that a homology exists between the retinal and cerebral microvasculature and evidence to support that changes in the retinal vasculature may reflect similar changes in the cerebral vasculature.17 In several large epidemiological studies in non-SCA population, presence of retinopathy was related to stroke, stroke mortality, white matter lesions, and cerebral atrophy.18,19,20 Given this homology between retinal vascular disease and cerebral small vessel disease, several studies have investigated the association between retinal microvascular abnormalities and cognitive impairment in the general population.11,12,13,14 While most studies in the literature show a positive correlation between retinopathy and cognition,11,12,13 Fergenbaum et al. was unable to show an association in a population-based study.14 A systematic review of studies examining the association between cognitive impairment or dementia and the presence of retinal microvascular abnormalities was performed by Ding et al. A total of six studies was reviewed and the presence of retinal vascular disease was mostly associated with poorer verbal memory, mental speed, and executive function in the general population, however, this was not consistent across all studies.21 While these studies included patients with retinopathy due to microvascular diseases such as diabetes and hypertension, ours is the first study to examine the relationship between sickle retinopathy and cognition.
The association between neurocognitive dysfunction and sickle cell disease has been well-established. While sickle cell patients are at high risk for cerebrovascular accidents which may have an effect on cognition, even neurologically intact children with normal MRIs have been shown to have global neurocognitive impairment which suggests that cognitive impairment is multifactorial and likely related to chronic brain hypoxia.6 In our study, we confirm neurocognitive impairment in sickle cell patients. Patients with sickle genotype SS had significantly lower PBAC scores than patients with sickle genotype SC which is consistent with the higher incidence of both overt and silent infarcts in sickle SS patients.22
The increased incidence of focal retinal thinning in sickle cell patients has been described by our group (Chau et al. IOVS 2010;51:ARVO E-Abstract 3554). The clinical significance of this focal thinning is not yet clear and currently being studied to identify if thinning correlates with clinical markers. Similar to the study by Kent et al.23 that did not find a correlation between sickle retinopathy and systemic complications, this study also did not find a clear relationship between focal retinal thinning or severity of sickle retinopathy and the systemic complication of cognitive impairment. On univariate analysis, there was an association with severity of sickle retinopathy with total PBAC score. However, this association was lost when accounting for covariates (age, gender, genotype, education, history of stroke, and retinopathy). These findings point to the complexity of how sickle cell hemoglobinopathies manifest differently in the eye and other organ systems. The study is limited by sample size with few patients having no thinning and few patients having moderate to severe retinopathy.
In our study, neurocognitive scores decreased with age, a finding consistent with previously published studies on cognition and aging.24 Neurocognitive scores were also significantly lower in patients with a history of stroke, which supports the use of the PBAC as a marker for cerebral vasculopathy.
Neurocognitive testing in sickle cell patients is complex because their performance may be limited by pain on the day of testing and the fact that early education is often affected by childhood illness. The PBAC was chosen as a screening test for cognition in this pilot study because it is an efficient tool that can be completed during a brief office visit. It has a strong correlation with the mini-mental status exam and is unique in that it allows the scoring of subscales that reflect performance within specific cognitive domains. The use of comprehensive neurocognitive evaluations may be considered in future efforts in studying cognition in this patient population.
This study should serve as a pilot for the study of neurocognitive function in relation to sickle retinopathy or OCT changes in sickle cell patients. Future studies might include other markers of cerebrovascular disease such as neuroimaging. While we did not demonstrate a cross-sectional relationship, future work is needed to determine the possibility of a relationship over time. We find that executive function impairment is more pronounced than other cognitive domains and suggest that cognitive tests focused on this domain are likely to be most promising in future studies of cognition in SCA.
Financial support and sponsorship
Illinois Society for the Prevention of Blindness, Research to Prevent, Blindness, NIH K12 EY02147.
Conflicts of interest
There are no conflicts of interest.
REFERENCES
- 1.Emerson GE, Harlan JB, Fekrat S, Lutty GA, Goldberg MF. Hemoglobinopathies. In: Ryan SJ, Hinton DR, Schachat AP, Wilkinson CP, editors. Retina. 4th ed. Philadelphia, PA: Elsevier; 2006. pp. 1429–45. [Google Scholar]
- 2.Ohene-Frempong K, Weiner SJ, Sleeper LA, Miller ST, Embury S, Moohr JW, et al. Cerebrovascular accidents in sickle cell disease: Rates and risk factors. Blood. 1998;91:288–94. [PubMed] [Google Scholar]
- 3.Pegelow CH, Macklin EA, Moser FG, Wang WC, Bello JA, Miller ST, et al. Longitudinal changes in brain magnetic resonance imaging findings in children with sickle cell disease. Blood. 2002;99:3014–8. doi: 10.1182/blood.v99.8.3014. [DOI] [PubMed] [Google Scholar]
- 4.Vichinsky EP, Neumayr LD, Gold JI, Weiner MW, Rule RR, Truran D, et al. Neuropsychological dysfunction and neuroimaging abnormalities in neurologically intact adults with sickle cell anemia. JAMA. 2010;303:1823–31. doi: 10.1001/jama.2010.562. [DOI] [PMC free article] [PubMed] [Google Scholar]
- 5.Steen RG, Xiong X, Mulhern RK, Langston JW, Wang WC. Subtle brain abnormalities in children with sickle cell disease: Relationship to blood hematocrit. Ann Neurol. 1999;45:279–86. doi: 10.1002/1531-8249(199903)45:3<279::aid-ana2>3.0.co;2-7. [DOI] [PubMed] [Google Scholar]
- 6.Steen RG, Fineberg-Buchner C, Hankins G, Weiss L, Prifitera A, Mulhern RK. Cognitive deficits in children with sickle cell disease. J Child Neurol. 2005;20:102–7. doi: 10.1177/08830738050200020301. [DOI] [PubMed] [Google Scholar]
- 7.Lim JI. Ophthalmic manifestations of sickle cell disease: Update of the latest findings. Curr Opin Ophthalmol. 2012;23:533–6. doi: 10.1097/ICU.0b013e328358b921. [DOI] [PubMed] [Google Scholar]
- 8.Goldberg MF. Classification and pathogenesis of proliferative sickle retinopathy. Am J Ophthalmol. 1971;71:649–65. doi: 10.1016/0002-9394(71)90429-6. [DOI] [PubMed] [Google Scholar]
- 9.Hoang QV, Chau FY, Shahidi M, Lim JI. Central macular splaying and outer retinal thinning in asymptomatic sickle cell patients by spectral-domain optical coherence tomography. Am J Ophthalmol. 2011;151:990–4.e1. doi: 10.1016/j.ajo.2010.12.010. [DOI] [PMC free article] [PubMed] [Google Scholar]
- 10.Chow CC, Genead MA, Anastasakis A, Chau FY, Fishman GA, Lim JI. Structural and functional correlation in sickle cell retinopathy using spectral-domain optical coherence tomography and scanning laser ophthalmoscope microperimetry. Am J Ophthalmol. 2011;152:704–11.e2. doi: 10.1016/j.ajo.2011.03.035. [DOI] [PMC free article] [PubMed] [Google Scholar]
- 11.Haan M, Espeland MA, Klein BE, Casanova R, Gaussoin SA, Jackson RD, et al. Cognitive function and retinal and ischemic brain changes: The Women's Health Initiative. Neurology. 2012;78:942–9. doi: 10.1212/WNL.0b013e31824d9655. [DOI] [PMC free article] [PubMed] [Google Scholar]
- 12.Lesage SR, Mosley TH, Wong TY, Szklo M, Knopman D, Catellier DJ, et al. Retinal microvascular abnormalities and cognitive decline: The ARIC 14-year follow-up study. Neurology. 2009;73:862–8. doi: 10.1212/WNL.0b013e3181b78436. [DOI] [PMC free article] [PubMed] [Google Scholar]
- 13.Wong TY, Klein R, Sharrett AR, Nieto FJ, Boland LL, Couper DJ, et al. Retinal microvascular abnormalities and cognitive impairment in middle-aged persons: The Atherosclerosis Risk in Communities Study. Stroke. 2002;33:1487–92. doi: 10.1161/01.str.0000016789.56668.43. [DOI] [PubMed] [Google Scholar]
- 14.Fergenbaum JH, Bruce S, Lou W, Hanley AJ, Greenwood C, Young TK. Window to the brain: Can retinopathy be used to assess cognitive function. Brain Inj. 2010;24:1448–54. doi: 10.3109/02699052.2010.523044. [DOI] [PubMed] [Google Scholar]
- 15.de Jong FJ, Vernooij MW, Ikram MK, Ikram MA, Hofman A, Krestin GP, et al. Arteriolar oxygen saturation, cerebral blood flow, and retinal vessel diameters. The Rotterdam Study. Ophthalmology. 2008;115:887–92. doi: 10.1016/j.ophtha.2007.06.036. [DOI] [PubMed] [Google Scholar]
- 16.Libon DJ, Rascovsky K, Gross RG, White MT, Xie SX, Dreyfuss M, et al. The Philadelphia Brief Assessment of Cognition (PBAC): A validated screening measure for dementia. Clin Neuropsychol. 2011;25:1314–30. doi: 10.1080/13854046.2011.631585. [DOI] [PMC free article] [PubMed] [Google Scholar]
- 17.Patton N, Aslam T, Macgillivray T, Pattie A, Deary IJ, Dhillon B. Retinal vascular image analysis as a potential screening tool for cerebrovascular disease: A rationale based on homology between cerebral and retinal microvasculatures. J Anat. 2005;206:319–48. doi: 10.1111/j.1469-7580.2005.00395.x. [DOI] [PMC free article] [PubMed] [Google Scholar]
- 18.Wong TY, Klein R, Couper DJ, Cooper LS, Shahar E, Hubbard LD, et al. Retinal microvascular abnormalities and incident stroke: The Atherosclerosis Risk in Communities Study. Lancet. 2001;358:1134–40. doi: 10.1016/S0140-6736(01)06253-5. [DOI] [PubMed] [Google Scholar]
- 19.Wong TY, Klein R, Sharrett AR, Couper DJ, Klein BE, Liao DP, et al. Cerebral white matter lesions, retinopathy, and incident clinical stroke. JAMA. 2002;288:67–74. doi: 10.1001/jama.288.1.67. [DOI] [PubMed] [Google Scholar]
- 20.Wong TY, Klein R, Sharrett AR, Manolio TA, Hubbard LD, Marino EK, et al. The prevalence and risk factors of retinal microvascular abnormalities in older persons: The Cardiovascular Health Study. Ophthalmology. 2003;110:658–66. doi: 10.1016/S0161-6420(02)01931-0. [DOI] [PubMed] [Google Scholar]
- 21.Ding J, Patton N, Deary IJ, Strachan MW, Fowkes FG, Mitchell RJ, et al. Retinal microvascular abnormalities and cognitive dysfunction: A systematic review. Br J Ophthalmol. 2008;92:1017–25. doi: 10.1136/bjo.2008.141994. [DOI] [PubMed] [Google Scholar]
- 22.Armstrong FD, Thompson RJ, Jr, Wang W, Zimmerman R, Pegelow CH, Miller S, et al. Cognitive functioning and brain magnetic resonance imaging in children with sickle Cell disease. Neuropsychology Committee of the Cooperative Study of Sickle Cell Disease. Pediatrics. 1996;97:864–70. [PubMed] [Google Scholar]
- 23.Kent D, Arya R, Aclimandos WA, Bellingham AJ, Bird AC. Screening for ophthalmic manifestations of sickle cell disease in the United Kingdom. Eye (Lond) 1994;8:618–22. doi: 10.1038/eye.1994.155. [DOI] [PubMed] [Google Scholar]
- 24.Graham JE, Rockwood K, Beattie BL, Eastwood R, Gauthier S, Tuokko H, et al. Prevalence and severity of cognitive impairment with and without dementia in an elderly population. Lancet. 1997;349:1793–6. doi: 10.1016/S0140-6736(97)01007-6. [DOI] [PubMed] [Google Scholar]


