Abstract
Objective:
To assess the predictive performance of Acute Physiologic and Chronic Health Evaluation II (APACHE II) software available on the hospital intranet and analyze interrater reliability of calculating the APACHE II score by the gold standard manual method or automatically using the software.
Materials and Methods:
An expert scorer not involved in the data collection had calculated APACHE II score of 213 patients admitted to surgical Intensive Care Unit using the gold standard manual method for a previous study performed in the department. The same data were entered into the computer software available on the hospital intranet (http://intranet/apacheii) to recalculate the APACHE II score automatically along with the predicted mortality. Receiver operating characteristic curve (ROC), Hosmer-Lemeshow goodness-of-fit statistical test and Pearson's correlation coefficient was computed.
Results:
The 213 patients had an average APACHE II score of 17.20 ± 8.24, the overall mortality rate was 32.8% and standardized mortality ratio was 1.00. The area under the ROC curve of 0.827 was significantly >0.5 (P < 0.01) and had confidence interval of 0.77-0.88. The goodness-of-fit test showed a good calibration (H = 5.46, P = 0.71). Interrater reliability using Pearson's product moment correlations demonstrated a strong positive relationship between the computer and the manual expert scorer (r = 0.98, P = 0.0005).
Conclusion:
APACHE II software available on the hospital's intranet has satisfactory calibration and discrimination and interrater reliability is good when compared with the gold standard manual method.
Keywords: Acute Physiologic and Chronic Health Evaluation II scoring system, Intensive Care Unit, software, validation
Introduction
Predictive scoring systems have been developed to measure the severity of the disease and the prognosis of patients in the Intensive Care Units (ICUs).[1] The modified Acute Physiologic and Chronic Health Evaluation II (APACHE II) scoring system[2] is widely used not only to monitor the severity of illness, but also to determine cohort groups in research, quality assurance and resource allocation. It requires the input of the worst values of 12 physiological variables and laboratory data along with age and chronic health status from the initial 24 h of ICU admission. For the manual calculation of the APACHE II scores a large amount of data has to be collected, reviewed and analyzed along with a number of precalculations. The complexity of these multiple tasks and staff time constraints often result in omission, unnecessary delay, variability and frequent calculation error.[3,4,5,6] Introduction of APACHE II software (Cerner®, APACHE®) improved compliance and reduced errors, but expense and availability preclude its use in developing countries. A number of web-based calculators are currently available to automatically calculate the APACHE score from manually entered values, but internet access or smart phones are required, and information cannot be saved to build a database. The information technology (IT) systems department of our university developed software to automatically calculate the APACHE II scores from manually entered values and build a database based on scoring guidelines outlined by Knaus and associates.[2] Before this software could be introduced for routine use in the ICU there was a need to evaluate its performance. The purpose of this study is to:
Describe the discrimination and calibration of the APACHE II software to predict mortality in a surgical ICU (SICU) and
Analyze interrater reliability of calculating the APACHE II score by the gold standard manual method or automatically using this software.
Materials and Methods
The study was exempted from ethical review by the Hospital Ethical Review Committee. A retrospective study was earlier conducted in the department in which medical records of all patients admitted to the SICU from January 2011 to December 2012 were reviewed.[7] Physiological variables and laboratory results of first 24 h after admission to SICU were taken from the ICU flow sheets and age and information about the chronic health status was retrieved from the patients’ medical record file. Information was entered on study specific forms in sections A, B and C respectively. APACHE II score (A + B + C) was calculated by an expert scorer not involved in the data collection using the gold standard manual method. The already collected data of 213 patients was entered into the computer software available on the university intranet (http://intranet/apacheii) to re-calculate the APACHE II score automatically. The IT department developed this software [Appendix I] based on information freely available on the internet websites [Appendix II] regarding the required variables and weightages assigned to each variable in order to automatically calculate the APACHE II score and the prediction models to be used in order to predict mortality. This custom-built APACHE II computerized scoring system was initially piloted in the Department by five consultants working in the SICU. These consultants gave their positive evaluation on the usefulness of this software and suggested minor changes.
Appendix I.
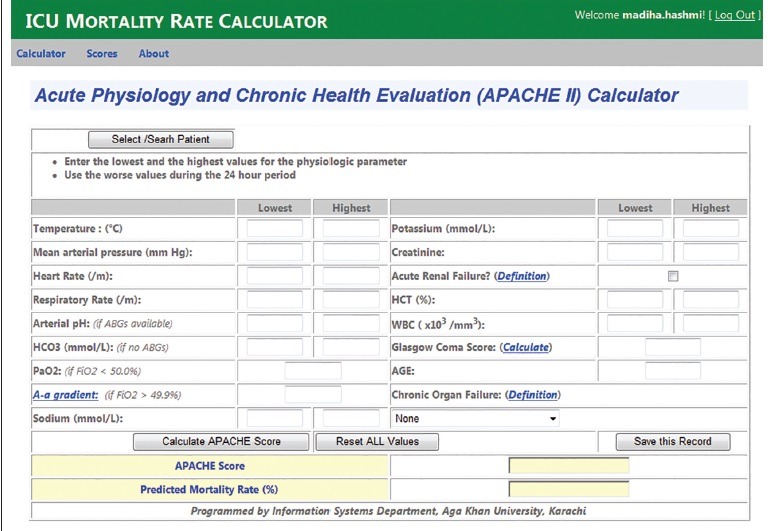
ICU mortality rate calculator
Appendix II.
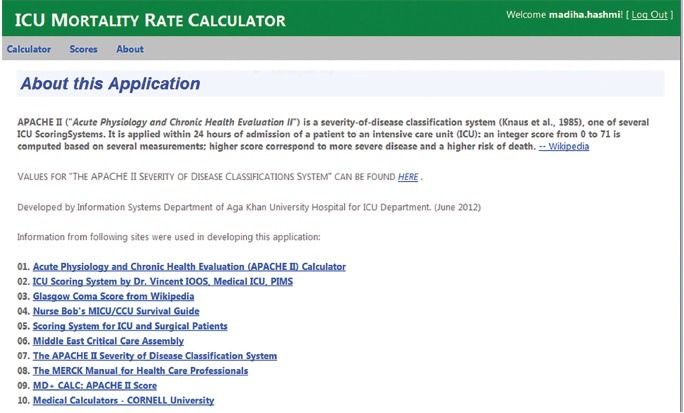
About the ICU mortality rate calculator
Statistical analysis was performed using Statistical Package for Social Sciences version-16 (SPSS, Chicago, IL, USA). Discrimination is the ability of the model to distinguish between survivals and nonsurvivals Receiver operating characteristic curve was used for testing the model discriminative power for mortality in ICU. Calibration refers to the accuracy of correlation between the observed mortality and that predicted by the model. The Hosmer-Lemeshow goodness-of-fit statistical test was used to evaluate the calibration of the model, which was considered satisfactory if the P > 0.05. Pearson's correlation coefficient was computed to determine the correlation of APACHE II score calculated manually and by the automated software. P < 0.05 was considered statistically significant. Sensitivity, specificity, positive and negative predictive value were also calculated along with the standardized mortality ratio (SMR) with 95% confidence interval.
Results
The demographic information along with the distribution of the patients according to the source and type of admission and the admitting service department are shown in Table 1. The mean APCHE II score of 213 patients was 17.20 (±8.24) as compared to 15.96 (±8.06) calculated manually. Overall mortality rate was 32.8%. Dividing observed mortality by predicted mortality gives the mortality ratio also known as SMR, which was 1.00. Mortality was predicted with 100% accuracy in low (APACHE II score 0-4) and high risk (APACHE II score >34) SICU population, but the outcome varied from that predicted for patients at moderate risk (APACHE II score 5-29), giving an overall accuracy of 78.87%. Average length of ICU stay was 6.54 days (±7.18). Table 2 compares the performance of the manual and IT-based models. Interrater reliability using Pearson's product moment correlations demonstrated a strong positive relationship between the computer and the manual expert scorer (r = 0.98, P = 0.0005) as shown in Figures 1 and 2.
Table 1.
Characteristics of the patients on admission to the ICU (n = 213)
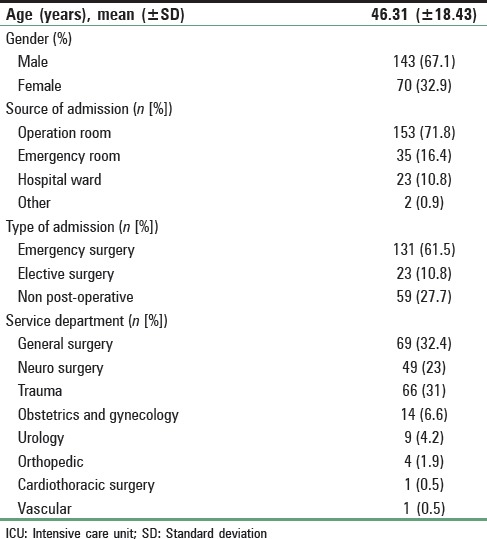
Table 2.
Performance of the models for prediction of ICU mortality
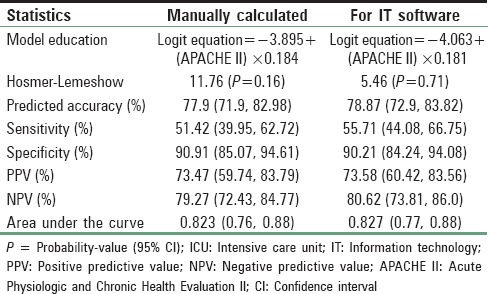
Figure 1.
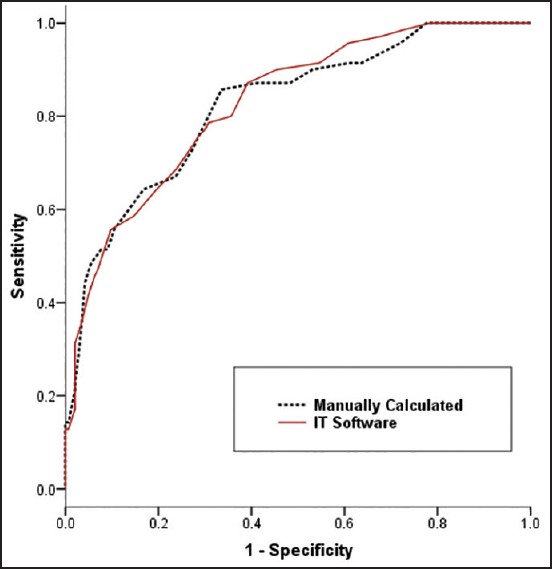
Receiver operating characteristic curves for Acute Physiologic and Chronic Health Evaluation II score calculated manually and using information technology software on prediction of Intensive Care Unit mortality
Figure 2.
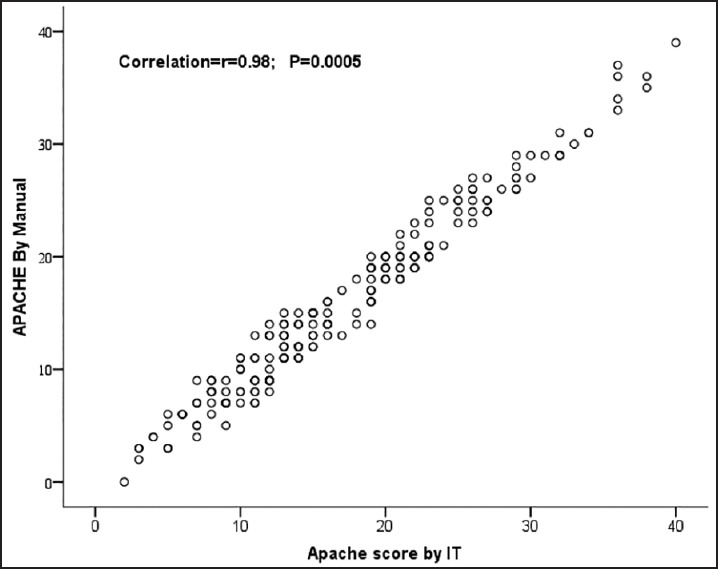
Correlation between Acute Physiologic and Chronic Health Evaluation II score calculated manually and by using information technology software
Discussion
Quantifying the disease severity across ICUs using various severity scoring systems based on physiological variables, therapeutic interventions or morbidity is limited to research purposes only, even in the tertiary care and university hospitals of Pakistan. This software was developed in an attempt to minimize a few of the common barriers that limit the routine use of manual APACHE II scoring system.
Human error
Complex data collection and decision making in the dynamic and stressful intensive care setting is prone to human error.[8] Each of the 12 physiological variables used to calculate the total acute physiology score (APS = A) generates a score on a scale from 0 to 4 for both a “high abnormal range” and a “low abnormal range.” For example, a heart rate of 110-139 gives a score of +2, but a heart rate of 40-54 generates a score of +3. The data collector must determine whether the high abnormal or the low abnormal value provides the highest score, and this decision requires careful consideration and may become confusing and a source of error. On the computer software highest and lowest values of each of the 12 physiological parameter over a period of first 24 h after admission are entered and the value that gives the highest score is automatically selected by the computer not only reducing the time of the data collector, but also the chance of error. Gooder et al. automated the process by developing a custom-built APACHE II computerized scoring system, using data stored in the computer-based patient health records.[8] The cost associated with such patient data management systems precludes their use in developing countries and this software is a cheaper alternative.
Complex precalculations
Polderman et al. noted that complex precalculations remain a persistent source of variability in the scoring process.[3] Mathematical precalculations are required to calculate A-aDO2 gradient in case FiO2 is more than 0.5. In the computer software values of FiO2 (if >0.5), PaO2 and PaCO2 are entered and A-aDO2 gradient is calculated automatically avoiding the reluctance to do the mathematical calculation and the associated error.
Addition error
The total APS (A), age points (B), and chronic health points (C) are added to give the final APACHE II score and there is a chance of calculation error. In the computer software APS is calculated automatically, age is entered manually, and chronic organ failure is defined and categorized as none, yes and nonoperative, yes and emergency postoperative and yes and elective postoperative with assigned weightage. Automatic calculation avoids the human error.
Saving the information
Less expensive alternatives for automatic APACHE II scoring in the form of APACHE calculators are readily available (Middle East Critical Care Assembly, GlobalRPH, MD + CALC, Medical Calculators-Cornell University), but don’t have the option to save the information in order to develop a database. This software saves the APACHE II score, predicted mortality, hospital discharge disposition (sent home, expired or transfer out) and length of ICU and hospital stay for all patients. Based on this information the average APACHE II score of SICU population and SMR was calculated to objectively evaluate the performance of the SICU.
Compliance and time-delay in reporting the scores
Gooder et al.,[8] reported a delay of 2-8 weeks to complete the scores in their ICU, due to staff time constraints. In our SICU it is mandatory for the trainee residents to have APACHE II scores available before the daily rounds and though it was not the objective of this study it was noted that it took 5-10 min to complete the task.
Sustainability
Usually, primary investigators collect data for a limited period for their research or hire research assistants at an additional cost. This hands-on activity contributes to learning and training of residents and brings to light the limitations of APACHE II scoring and sparks an interest and curiosity to look into other more scoring systems.
Conclusion
The software available on the university's intranet is accurate and reliable when compared to the gold standard manual method of calculating the APACHE II score. Use of software simplify the task of complex decision making in data collection, reduce the human error involved in mathematical calculations, improve compliance and timely reporting of scores and are a cheap and sustainable alternative to expensive patented software or web-based APACHE II calculators.
The limitation of this software is that it is only available on our university intranet and cannot be of benefit to other hospitals. In future computer programmers should develop APACHE II (and other more advanced scoring systems) mobile apps (applications software) that can be downloaded from the platform to a target device, like a mobile phone, laptop or desktop computer at minimum cost or fee in order to facilitate adoption of severity scoring systems in ICUs in resource-limited settings. This will in turn facilitate benchmarking, quality improvement initiatives and enhance the standard of research from developing countries.
Financial support and sponsorship
Nil.
Conflicts of interest
There are no conflicts of interest.
References
- 1.Keegan MT, Gajic O, Afessa B. Severity of illness scoring systems in the intensive care unit. Crit Care Med. 2011;39:163–9. doi: 10.1097/CCM.0b013e3181f96f81. [DOI] [PubMed] [Google Scholar]
- 2.Knaus WA, Draper EA, Wagner DP, Zimmerman JE. APACHE II: A severity of disease classification system. Crit Care Med. 1985;13:818–29. [PubMed] [Google Scholar]
- 3.Polderman KH, Jorna EM, Girbes AR. Inter-observer variability in APACHE II scoring: Effect of strict guidelines and training. Intensive Care Med. 2001;27:1365–9. doi: 10.1007/s001340101012. [DOI] [PubMed] [Google Scholar]
- 4.Chen LM, Martin CM, Morrison TL, Sibbald WJ. Interobserver variability in data collection of the APACHE II score in teaching and community hospitals. Crit Care Med. 1999;27:1999–2004. doi: 10.1097/00003246-199909000-00046. [DOI] [PubMed] [Google Scholar]
- 5.Polderman KH, Girbes AR, Thijs LG, Strack van Schijndel RJ. Accuracy and reliability of APACHE II scoring in two intensive care units Problems and pitfalls in the use of APACHE II and suggestions for improvement. Anesthesia. 2001;56:47–50. doi: 10.1046/j.1365-2044.2001.01763.x. [DOI] [PubMed] [Google Scholar]
- 6.Cowen JS, Kelley MA. Errors and bias in using predictive scoring systems. Crit Care Clin. 1994;10:53–72. [PubMed] [Google Scholar]
- 7.Hashmi M, Asghar A, Rashid S, Khan FH. APACHE II analysis of a surgical intensive care unit population in a tertiary care hospital in Karachi (Pakistan) Anaesth Pain Intensive Care. 2014;18:338–44. [Google Scholar]
- 8.Gooder VJ, Farr BR, Young MP. Accuracy and efficiency of an automated system for calculating APACHE II scores in an intensive care unit. Proceedings: a conference of The American Medical Informatics Association. AMIA Annual Fall Symposium. 1997:131–5. [PMC free article] [PubMed] [Google Scholar]


