

Abstract
This study was conducted as a part of the Chromosome-Centric Human Proteome Project (C-HPP) of the Human Proteome Organization. The main objective is to identify and evaluate functionality of a set of specific noncanonical isoforms expressed in HER2-neu positive, estrogen receptor negative (ER−), and progesterone receptor negative (PR−) breast cancers (HER2+/ER−/PR− BC), an aggressive subtype of breast cancers that cause significant morbidity and mortality. We identified 11 alternative splice isoforms that were differentially expressed in HER2+/ER−/PR− BC compared to normal mammary, triple negative breast cancer and triple positive breast cancer tissues (HER2+/ER+/PR+). We used a stringent criterion that differentially expressed noncanonical isoforms (adjusted p value < 0.05) and have to be expressed in all replicates of HER2+/ER−/PR− BC samples, and the trend in differential expression (up or down) is the same in all comparisons. Of the 11 protein isoforms, six were overexpressed in HER2+/ER−/PR− BC. We explored possible functional roles of these six proteins using several complementary computational tools. Biological processes including cell cycle events and glycolysis were linked to four of these proteins. For example, glycolysis was the top ranking functional process for DMXL2 isoform 3, with a fold change of 27 compared to just two for the canonical protein. No previous reports link DMXL2 with any metabolic processes; the canonical protein is known to participate in signaling pathways. Our results clearly indicate distinct functions for the six overexpressed alternative splice isoforms, and these functions could be specific to HER2+/ER−/PR− tumor progression. Further detailed analysis is warranted as these proteins could be explored as potential biomarkers and therapeutic targets for HER2+/ER−/PR− BC patients.
Keywords: Splice isoforms, noncanonical, Her2+ BC
Graphical abstract
INTRODUCTION
Splicing events are the results of a fine “balance of power” between numerous regulating factors, which vary from tissue to tissue, during development or in the presence of external stimuli; a disturbance in this balance can lead to pathological conditions.1,2 It is unclear to what extent alternative splicing functionally contributes to the initiation and progression of cancers.2 However, it is becoming clear that tumors exploit splicing for functional advantages. In recent years, studies have emerged showing the involvement of specific splice variants in different types of cancer or cancer-related processes. For example, M2 splice isoform of pyruvate kinase (PKM) expression is necessary for aerobic glycolysis, and it provides a selective growth advantage for tumor cells in vivo.3 Recently, a few studies show the direct effects of splice isoforms in breast cancers.4–7 For example, the relative expression of p53 isoforms is related to clinical features of breast cancer and prognosis. High levels of p53β were protective, particularly in patients with a mutation in p53 suggesting that it may counteract the damage inflicted by mutant p53.4
This study was conducted as a part of the Chromosome-Centric Human Proteome Project (C-HPP) of the Human Proteome Organization. US-based scientists of C-HPP are involved in characterizing the full set of proteins coded by chromosome 17.8 Despite its relatively small size, chromosome 17 is rich in protein-coding genes, ranking second in gene density; it contains many cancer-associated genes, including BRCA1, ERBB2 (HER2/Neu), and TP53. Recent studies have shown the significant role of HER2 in cancers through the activation of HER2 receptor signaling pathways affecting cancer metastasis-associated properties.9,10 For this Article, we focused our splice isoform analyses on HER2+/ER−/PR− breast cancers. Our goal was to find proteins specific to HER2+/ER−/PR− breast cancers even if their corresponding genes are not located in chromosome 17.
Breast tumors are classified by the status of the estrogen receptor (ER), the progesterone receptor (PR), and the HER2.11 Tumors lacking expression of all three receptors are defined as triple-negative breast cancer (TNBC); TNBC is often classified as basal-like breast cancer.11 HER2-positive (ER and PR negative) and triple positive (positive for all three receptors) tumors belong to the luminal-like subgroup.11 HER2-neu positive, estrogen receptor negative (ER−), and progesterone receptor negative (PR−) breast cancers are an aggressive subtype of breast cancer (BC) that cause significant morbidity and mortality. Her2+ BC accounts for up to 25% of all invasive breast carcinomas12 and are remarkably heterogeneous. HER2 (ERBB2) is a transmembrane tyrosine kinase receptor and a member of the ErbB protein family, more commonly known as the epidermal growth factor receptor (EGFR) family.13 Activation of this class of cellular receptors is known to result in increased activity of a variety of molecular events including cell motility, cell proliferation, and anti-apoptosis that are associated with tumor growth and progression.14 While targeted therapy has significantly improved patient outcomes in Her2+ disease, the development of resistance remains a therapeutic challenge. A significant number of patients with HER2+ BC treated with two approved therapies targeting HER2, trastuzumab and lapatinib, eventually develop recurrence and metastasis.15 Thus, a deeper understanding of the mechanisms driving Her2+ BC is needed.
In our previous study on the splice isoforms identified in HER2-overexpressed human breast cancer cell line models, SKBR3 and SUM190, we found mRNA splicing as one of the top ranked Gene Ontology Biological processes.16 Hence, we presume that HER2+ overexpression can influence mRNA splicing processes, which in turn can influence the expression levels of splice isoforms. Depending on the amino acid sequences, the noncanonical isoforms that are differentially expressed can have distinct structural and functional characteristics compared to that of the canonical proteins.4,5,7,17 Our hypothesis in this study is that a set of noncanonical splice isoforms with selective advantages such as increased cell proliferation, antiapoptotic, and enhanced cell motility are positively selected for tumor progression in HER2+/ER−/PR− BC.
The main objective of this study is to identify and evaluate functionality of a set of specific noncanonical isoforms overexpressed in aggressive HER2+/ER−/PR− breast cancers. We believe that these isoforms could be potential biomarkers and therapeutic targets that can have a great impact on improving outcomes in HER2+/ER−/PR− breast cancer patients.
MATERIALS AND METHODS
The annotation on splice isoforms varies from database to database; especially in Ensembl, the information on protein-coding transcripts for a gene is constantly updated or changed as the database version changes. In order to obtain a set of isoforms that are reliable and of high quality, for this study we used the Uniprot proteins (release 2015/03) (http://www.uniprot.org/) that are consistently annotated both in Ensembl (version 75) (http://www.ensembl.org/Homo_sapiens/Info/Index) and NCBI Refseq (release 70) (http://www.ncbi.nlm.nih.gov/refseq/) databases.
For this study, we focused on the noncanonical/alternative isoforms according to UniProt (http://www.uniprot.org/help/canonical_and_isoforms). UniProt chooses a canonical variant from all of the protein products encoded by one gene based on criteria including most prevalent, similar to orthologous sequences found in other species, or the amino acid sequence that allows the clearest description of domains, isoforms, polymorphisms, and post-translational modifications. If no other information is available, then the longest sequence is chosen as the canonical protein.
Analysis Workflow
The analysis workflow used in this study is illustrated in Figure 1; based on our hypothesis, we will focus our analyses on noncanonical isoforms that may have potential functional role in HER2+/ER−/PR− breast cancers. Most functional studies are done for the canonical protein of a gene; hence, the noncanonical proteins have poor or no functional annotations. An integrated computational approach with tools for sequence alignment, functional motif prediction, structure prediction, structure comparison, and splice isoform function prediction was used to study the potential functions of the noncanonical splice proteins compared to those of the canonical proteins.
Figure 1.
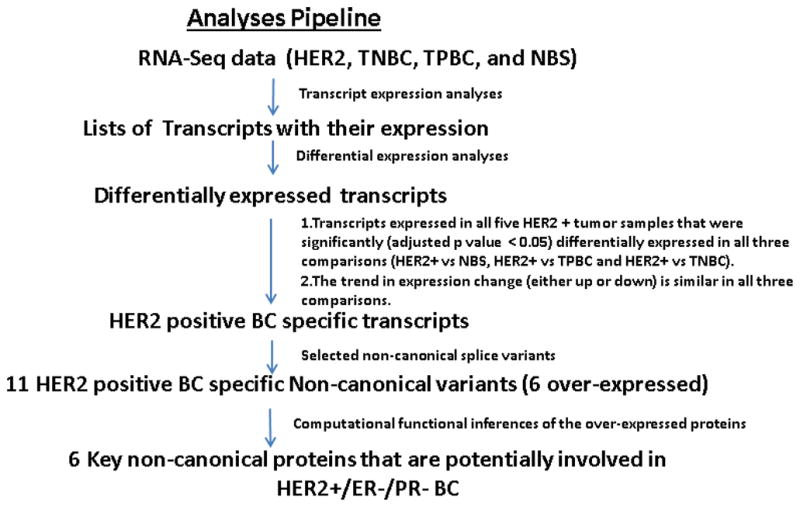
Analysis workflow used in this study.
RNA-Seq Data Analysis
RNA-Seq is a relatively recent approach to transcriptome profiling that uses deep-sequencing technologies, which provide a far more precise measurement of levels of transcripts and their isoforms than traditional microarrays.18 Human breast cancer RNA-Seq data SRP032789 based on Illumina HiSeq 2000 from different human breast tissues, including normal breast organoids (NBS) and three different tumor types (HER2+, TNBC, and Non-TNBC), was downloaded from NCBI Short Read Archive (http://www.ncbi.nlm.nih.gov/sra). The TNBC and Non-TNBC data sets had six biological replicates, whereas the HER2+ data set had five replicates.19 According to the original authors19,20 of SRP032789 data set, the Non-TNBC samples were all HER2+/ER+/PR+; hence, we referred to this group as triple positive breast cancer (TPBC) as per http://www.cancer.org/cancer/breastcancer/detailedguide/breast-cancer-classifying.
The RNA-Seq data was analyzed using Sailfish, an alignment-free algorithm for the estimation of isoform abundances.21 Sailfish first builds a unique index of all k-mers (short and consecutive sequences containing k nucleic acids) that appear at least once in the transcriptome, counts the occurrences of the k-mers in the RNA-Seq fragments, and quantifies the transcripts by the number of occurrences of the k-mers through an EM algorithm.21 The index file for the Sailfish quantification process was generated from Ensembl cDNA file (GRCh38 version).
Differential expression of the transcripts between the different tumor types was calculated using R package EdgeR.22 This method uses an overdispersed Poisson model to account for biological and technical variability. Multiple hypotheses corrections (Bonferroni correction) to the p values of the differentially expressed transcripts were done using p.adjust function in stats, R package (http://stat.ethz.ch/Rmanual/R-patched/library/stats/html/p.adjust.html). The estimated number of read counts for each transcript reported by Sailfish was used in the differential expression calculations. Distinct differential transcript expression analyses were done comparing HER2+ breast cancer data set (HER2+/ER−/PR−) against NBS, TNBC, and TPBC sample types.
It is important to note here that the TPBC tissue samples used in this study are all HER2+/ER+/PR+. Even though this sample type is HER2+, this triple positive receptor group is classified as luminal Her2 breast cancer type with distinct molecular characteristics compared to HER2 enriched (HER2+/ER−/PR−) group.23
Remaining analyses were focused on the following transcripts:
Transcripts expressed in all five HER2+/ER−/PR− tumor samples that were significantly (adjusted p value < 0.05) differentially expressed in all three comparisons (HER2+/ER−/PR− vs NBS, HER2+/ER−/PR− vs Non-TNBC, and HER2+/ER−/PR− vs TNBC).
The trend in expression change (either up or down) is similar in all three comparisons.
Function Inferences
The functional annotation of most genes is based on their widely studied canonical protein; there is very little annotation or information on the functions of noncanonical proteins. Hence, we used an integrated computational approach with tools for sequence alignment,24 motif prediction,25 structure prediction,26 structure comparison,27,17 and splice variant function prediction28–30 to study the potential functions of the noncanonical splice proteins compared to those of the canonical proteins. GeneCards was used for gene level annotations (http://www.genecards.org/).
Sequence Alignment
Using the NCBI sequence alignment blastp tool24 (http://blast.ncbi.nlm.nih.gov/Blast.cgi?PROGRAM=blastp&PAGE_TYPE=BlastSearch&LINK_LOC=blasthome), we compared the isoform sequence to the canonical form.
Functional Motif Prediction
Using publicly available tool ELM (http://elm.eu.org), we predicted the functional motifs present in the sequences that are unique to the noncanonical splice isoforms compared to their corresponding canonical proteins. ELM is a resource for predicting functional sites in eukaryotic proteins.25 For each ELM class, a probability score (expect cutoff) is calculated based on its regular expression, using the amino acid probabilities (derived from UniProt). This probability score reflects the probability of the regular expression to be found by chance in any given protein sequence. We used a probability cutoff of p < 0.01 for this study.
Structure Prediction and Comparison
The function of a protein is directly dependent on its three-dimensional structure, which is determined by its amino acid sequence. First, ThreaDom31 (Threading-based Protein Domain Prediction) was used to predict the protein domain boundaries. The 3D structural models for the entire splice variants or their domains of interest were then predicted using I-TASSER.26 In ITASSER, structural templates are first identified from the PDB (http://www.rcsb.org/pdb/home/home.do) by multiple threading approach LOMETS; full-length atomic models are constructed by iterative template fragment assembly simulations.26 Unaligned regions are built by ab initio modeling.26 A scoring function (C-score) based on the relative clustering structural density and the consensus significance score of multiple threading templates is introduced to estimate the accuracy of the I-TASSER predictions.26 C-score is strongly correlated with the similarity of the final model to the target structures and is typically in the range [−5, 2], wherein a more positive score reflects a model of better quality. Both false positive and false negative rates are below 0.1 when a C-score cutoff > −1.5 was used for the models of correct topology.26 All the predicted models used in this study had C-score > −1.5. We will use TM-align to compare the structural models of the splice variants from the same gene. TM-align is an algorithm for sequence-independent, automated structure comparison of different proteins (http://zhanglab.ccmb.med.umich.edu/TMalign).27 The regions where the predicted structures do not align are carefully analyzed for possible functional differences. We have previously benchmarked the I-TASSER pipeline for structure modeling of pairs of protein isoforms, which are known to have experimentally solved structures in PDB.17
Isoform Function Prediction
Utilizing Multiple Instance Learning (MIL) algorithms with an Supervised Vector Machine (SVM) classification model, fold changes of functions of alternatively spliced isoforms based on Gene Ontology (GO) terms were predicted.28–30 Briefly, by treating a gene as a “bag” of its isoforms of potentially different functions, MIL can build a model that is able to predict functions for isoforms using heterogeneous data and gene-level function annotation data. Essentially, instead of considering all isoforms of the genes annotated to a specific function, MIL selects a subset of these isoforms that show similar patterns to establish the classification model. Fold change is calculated as the ratio of rank probability of an isoform to the base probability. Isoforms are ranked based on the classification score from SVM software. Then, rank probability is calculated as the ratio of number of positive isoforms (isoforms of positive genes) to the number of isoforms in the subset that ranked higher than the isoform of interest in sorted list. Base probability is the ratio of the total number of positively annotated genes to the total number of genes. P values were calculated for the fold changes predicted for all transcripts linked to a particular GO term.
RESULTS
Figure 2 shows the multidimensional (MDS) plot of the samples based on RNA-seq data. Dimension 1 and dimension 2 separate the groups based on the read counts of the transcripts prior to differential gene expression analysis; the MDS plot reveals that the transcriptomics data of HER2+/ER−/PR− group are different from those of the other sample types studied. The transcript expression differences between the sample types studied are clearly evident in the boxplots shown in Figure 2b.
Figure 2.

(a) Multidimensional scale plot of HER2 (HER2+/ER−/PR−), NBS, TNBC, and TPBC (HER2+/ER+/PR+) samples based on RNA-seq read counts. The plot was generated using plotMDS function in edgeR R package. The function computes distances in terms of BCV between each pair of samples. Biological CV (BCV) is the coefficient of variation with which the true abundance of the gene varies between RNA samples. Dimension 1 is the direction that best separates the samples, without regard to whether they are treatments or replicates. Dimension 2 is the next best direction that separates the samples. TNBC is considered as highly heterogeneous, two TNBC samples were similar to TPBC. (b) Boxplots of transcript expression of the four groups studied, HER2+ (HER2+/ER−/PR−), NBS, TPBC (HER2+/ER+/PR+), and TNBC.
We identified 11 distinct noncanonical protein-coding transcripts (from 11 genes) that were significantly (adjusted p value < 0.05) differentially expressed in all HER2+/ER−/PR− BC samples compared to normal breast cells and TNBC and TPBC tumor cells (Table 1). Six out of the 11 differentially expressed isoforms showed overexpression compared to the other three groups (Figure 3). It is important to note here that except for RICTOR isoform 3 all the other five isoforms showed similar expression in NBS, TNBC, and TPBC groups. There was no transcript expression for RICTOR isoform 3 in the normal breast tissue (NBS).
Table 1.
Alternative or Noncanonical Isoforms Specific to HER2+/ER−/PR− Breast Cancers
| UniProtID | Ensembl Transcript ID | gene symbol | protein name | chromosome | expression in HER2+/ER−/PR− BC data set |
|---|---|---|---|---|---|
| sp|O15511-2|ARPC5_HUMAN | ENST00000294742 | ARPC5 | actin-related protein 2/3 complex subunit 5 isoform 2 | 1 | down |
| sp|Q8TDJ6-3|DMXL2_HUMAN | ENST00000543779 | DMXL2 | DmX-like protein 2 isoform 3 | 15 | up |
| sp|Q16665-3|HIF1A_HUMAN | ENST00000539097 | HIF1A | hypoxia-inducible factor 1-alpha isoform 3 | 14 | up |
| sp|Q07866-2|KLC1_HUMAN | ENST00000389744 | KLC1 | isoform C of kinesin light chain 1 | 14 | up |
| sp|Q86UP2-2|KTN1_HUMAN | ENST00000438792 | KTN1 | kinectin isoform 2 | 14 | down |
| sp|Q9UIQ6-2|LCAP_HUMAN | ENST00000395770 | LNPEP | leucyl-cystinyl aminopeptidase isoform 2 | 5 | up |
| sp|Q96G74-5|OTUD5_HUMAN | ENST00000376488 | OTUD5 | OTU domain-containing protein 5 isoform 5 | X | down |
| sp|Q96M27-3|PRRC1_HUMAN | ENST00000512635 | PRRC1 | protein PRRC1 isoform 3 | 5 | down |
| sp|Q6R327-3|RICTR_HUMAN | ENST00000296782 | RICTOR | rapamycin-insensitive companion of mTOR isoform 3 | 5 | up |
| sp|Q9NWF9-1|RN216_HUMAN | ENST00000389902 | RNF216 | E3 ubiquitin-protein ligase RNF216 isoform 2 | 7 | up |
| sp|Q8N0Y2-2|ZN444_HUMAN | ENST00000592949 | ZNF444 | zinc finger protein 444 isoform 2 | 19 | up |
Figure 3.

Relative transcript expression of the noncanonical splice isoforms.
Sailfish transcript quantification analyses found a total of 25 isoforms from the 11 genes in all four sample types studied. Except for KTN1, we found expression of the canonical protein forms for all other 10 genes in the breast tissues studied. The canonical forms of HIF1A and KLC1 were down in HER2+/ER−/PR− BC samples compared to normal breast tissue. However, only the 11 noncanonical transcripts passed our stringent criteria. As mentioned earlier, we used the stringent criteria that the differentially expressed noncanonical isoforms (adjusted p value < 0.05) have to be expressed in all five replicates of HER2+/ER−/PR− BC samples and the trend in differential expression (up or down) is the same in all comparisons (HER2+/ER−/PR− vs NBS, HER2+/ER−/PR− vs TNBC, and HER2+/ER−/PR− vs TPBC).
The rest of our analyses were focused on computational functional inferences of these six isoforms (DMXL2 isoform3, HIFA isoform 3, KLC1 isoform c, LNPEP isoform 2, RICTOR isoform 3, and RNF216 isoform1) that were specifically overexpressed in HER2+/ER−/PR− breast tumor tissues.
Sequence Differences from the Canonical Proteins
The sequence differences observed between the noncanonical and canonical proteins were as follows:
The DMXL2 isoform 3 differs from the canonical protein due to the insertion of serine residue at position 2278 (SER 2278).
The canonical HIF1a and the isoform 3 proteins have distinct first exons that could be due to alternate promoters or alternate translation start sites.
The translated peptide sequence from the first exon of Hif1a isoform 3 contains 35 amino acid (aa) residues, whereas the canonical protein has only 12 aa.
The last C-terminal exons are different for the KLC1 canonical and the isoform c proteins. In the canonical form the translated sequence from the last exon is 23 aa long compared to 10 aa in the isoform c.
LNPEP isoform 2 is missing 14 aa at the N-terminal end compared to the canonical form.
The canonical RICTOR protein is the translated sequence from the transcript with 38 exons, while the isoform 3 protein is from that of 39 exons. The additional exon (exon 32) translates to a peptide sequence of 24 amino acids.
The canonical RNF216 is 866 aa long, whereas the isoform 2 has an additional 57 aa (total 923 aa) due to alternate splice sites on exons 2 and 3.
Functional Motif Prediction
The predicted functional motifs with good confidence (ELM probability score < 0.01) for the noncanonical isoforms that are missing in their corresponding canonical proteins are shown in Table 2. Except for KLC1 isoform c and LNPEP isoform 2, potential functional motifs were predicted for the unique sequences observed in all the other four noncanonical isoforms.
Table 2.
Predicted Functional Motifs (p < 0.01) Found in the Unique Sequences of the Noncanonical Isoformsa
| noncanonical isoform | functional motif prediction |
|---|---|
| DMXL2 isoform3 | (1) 14–3–3 ligand (HSYSSQ; 2275–2280). (2) With the insertion of an additional serine at position 2278, YSSQ (YXXQ) motif is formed, which can bind to STAT3 SH2 domain. |
| HIF1A isoform 3 | The isoform 3 contains a NGR motif (34–36 aa), which upon deamidation forms a biologically active isoDGR motif that binds to various members of the integrin family. |
| KLC1 isoform c | The noncanonical KLC1 isoform c is missing two peptide amidation sites (559–562 aa and 568–571 aa) found in the canonical protein. |
| LNPEP isoform 2 | Calcineurin (PP2B)-docking motif found in the N-terminal end of the canonical protein is missing in isoform 2. |
| RICTOR isoform 3 | (1) Cyclin recognition site (1391–1394 aa); Functional site that interacts with cyclins and thereby increases the specificity of phosphorylation by cyclin/CDK complexes. (2) NEK2 phosphorylation motif (1389–1391 aa) plays a critical role in cell cycle control. (3) PKA phosphorylation site (1390–1396 aa); motifs phosphorylated by a subset of AGC group kinases including PKA. |
| RNF216 isoform 2 | Phosphopeptide motif (107–111 aa), which directly interacts with the BRCT (carboxy-terminal) domain of the Breast Cancer Gene BRCA1 with low affinity. BRCT domains recognize and bind specific phosphorylated serine (pS) sequences. This phospho-protein mediated interaction of the BRCT domain has a central role in cell-cycle check point and DNA repair functions. |
These motifs were not predicted for their corresponding canonical proteins. Eukaryotic Linear Motif (ELM) resource was used for the functional motif prediction (http://elm.eu.org/).
Structure Predictions
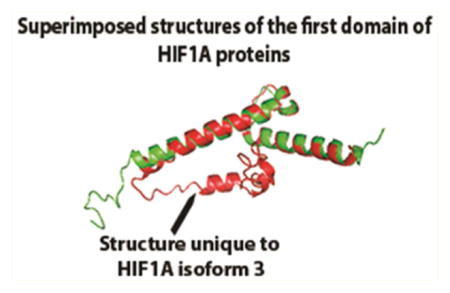
As the DMXL2 proteins differ only by a single amino acid residue, we did not predict their structures using I-TASSER. The predicted structures of the first domain of HIF1A proteins are shown in Figure 4a. TM-align superimposed structures display the structural differences between the HIF1A proteins with RMSD 1.88 Å (Figure 4a). As mentioned in the earlier section, KLC1 canonical and isoform c differ only at the C-terminal end. The three-dimensional structure predictions indicate similar overall structures (Figure 4b). However, the superimposed predicted structures of the C-terminal ends of the two proteins using TM-align showed structural misalignment from 530 to 543 residues (Figure 4b).
Figure 4.
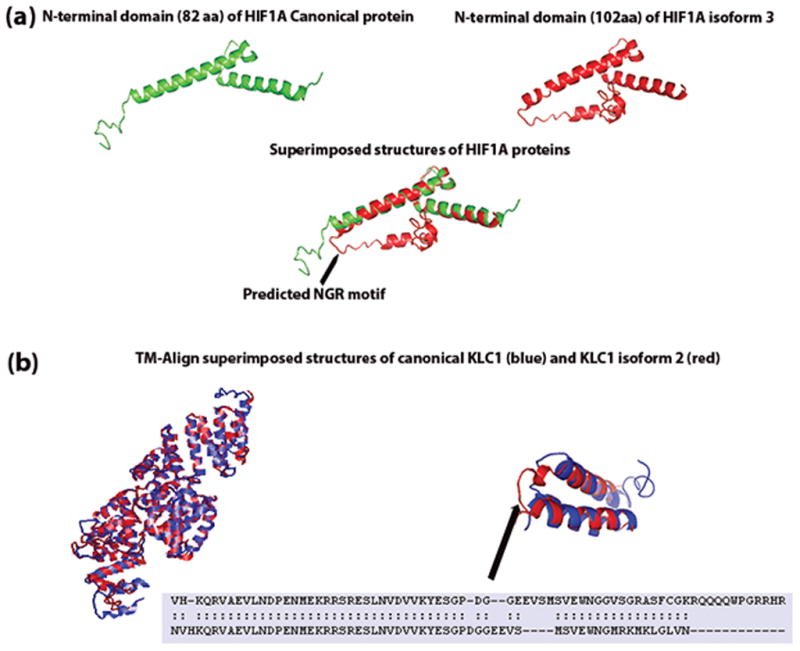
I-TASSER predicted structures of (a) first domain of HIF1A canonical and isoform 3 proteins. RMSD between the two predicted structures was 1.88 Å. The arrow points to the predicted NGR motif unique to HIF1A isform 3. (b) I-TASSER predicted structures of KLC1 canonical, and the isoform 2 proteins were aligned and superimposed using TM-align. Even though the two protein sequences differ at the c-terminal end, the superimposed structures reveal no structural differences. The overall RMSD between the two structures was 2.52 Å. Superimposed structures of the c-terminal ends (500–573 aa for KLC1 canonical protein and 500–560 aa for KLC1 isoform c) showed structural alignment differences at PDGG residues (534–537 aa).
The structure predictions of LNPEP, RICTOR, and RNF 216 proteins had TM-scores < 0.4, which indicated possible random folding. Hence, those predicted structures were not taken into account.
Isoform Function Predictions
Table 3 shows the top three GO terms (biological processes) predicted for each of the six noncanonical isoforms based on fold changes compared to baseline levels.
Table 3.
Top Three Gene Ontology Terms Predicted by MIL Algorithm for the Six Noncanonical Isoforms
| gene symbol | Gene Ontology ID | Gene Ontology Description | enrichment
|
|||
|---|---|---|---|---|---|---|
| canonical protein
|
noncanonical isoform
|
|||||
| p value | fold change | p value | fold change | |||
| DMXL2 | GO:0006096 | glycolysis | 0.57 | 2.00 | 0.00 | 26.84 |
| GO:0031058 | positive regulation of histone modification | 0.79 | 1.72 | 1 × 10⁻¹² | 21.88 | |
| GO:0048588 | developmental cell growth | 0.79 | 1.43 | 2 × 10⁻⁸ | 16.97 | |
| HIF1A | GO:0006614 | SRP-dependent cotranslational protein targeting to membrane | 0.35 | 3.98 | 0.00 | 31.54 |
| GO:0045047 | protein targeting to ER | 0.08 | 5.41 | 1 × 10⁻¹² | 21.23 | |
| GO:0031055 | chromatin remodeling at centromere | 0.79 | 1.93 | 2 × 10⁻⁸ | 16.27 | |
| KLC1 | GO:0072599 | establishment of protein localization to endoplasmic reticulum | 0.79 | 1.90 | 0.001 | 9.66 |
| GO:0006614 | SRP-dependent cotranslational protein targeting to membrane | 0.79 | 1.84 | 0.03 | 6.99 | |
| GO:0000184 | nuclear-transcribed mRNA catabolic process, nonsense-mediated decay | 0.81 | 1.23 | 0.08 | 5.64 | |
| LNPEP | GO:0019221 | cytokine-mediated signaling pathway | 0.35 | 3.85 | 3 × 10⁻⁶ | 13.04 |
| GO:0006096 | glycolysis | 0.35 | 3.43 | 0.0003 | 10.53 | |
| GO:0032940 | secretion by cell | 0.79 | 1.70 | 0.0003 | 10.49 | |
| RICTOR | GO:0000819 | sister chromatid segregation | 0.79 | 1.74 | 0.00 | 27.20 |
| GO:0006312 | mitotic recombination | 0.35 | 3.96 | 1 × 10⁻⁵ | 12.68 | |
| GO:0007059 | chromosome segregation | 0.79 | 1.57 | 0.001 | 9.80 | |
| RNF216 | GO:0060337 | type I interferon-mediated signaling pathway | 0.18 | 4.08 | 0.03 | 6.71 |
| GO:0072599 | establishment of protein localization in endoplasmic reticulum | 0.35 | 3.62 | 0.03 | 6.48 | |
| GO:0006614 | SRP-dependent cotranslational protein targeting to membrane | 0.57 | 2.60 | 0.03 | 6.16 | |
DMXL2 is known to be involved in signal transduction pathways. The canonical protein and isoform 3 showed similar fold changes for GO terms linked to GTPase-mediated signal transduction. However, the fold changes of regulation of DNA damage response, signal transduction by p53 class mediator (GO:0043516), cytokine-mediated signaling pathway (GO:0019221), and regulation of BMP signaling pathway (GO:0030510), were 8.5-, 10-, and 4-fold for DMXL2 isoform 3 compared to nonsignificant (p < 0.4) 1.6-, 3.5-, and 1.5-fold changes observed for the canonical protein. According to isoform function predictions, the top ranking functional process for DMXL2 isoform 3 was a glycolytic process (GO:0006096); isoform 3 had 27-fold change compared to 2-fold for the canonical protein (Table 3).
HIF1A gene is a transcription factor; GO terms that are linked to transcription related processes had higher fold changes for the canonical protein compared to HIF1A isoform 3. SRP-dependent cotranslational protein targeting to membrane (GO:0006614), protein targeting to ER (GO:0045047), and chromatin remodeling at the centromere (GO:0031055) were the functional processes with highest fold changes for HIF1A isoform 3 (Table 3). Another GO term with high fold change (~11-fold, p < 7 × 10⁻⁵) for the noncanonical protein was regulation of epithelial cell differentiation (GO:0030856) compared to 3-fold for the canonical protein.
Since the motif prediction indicated a NGR motif that upon deamidation forms a biologically active isoDGR motif that can bind to various members of the integrin family, we studied the GO term linked to integrin-mediated signaling for both canonical and noncanonical isoform 3 of HIF1A. Interestingly, HIF1A isoform 3 had ~4-fold change for this biological process (GO:0007229) compared to ~2-fold for the canonical protein.
KLC1 is a microtubule-associated protein that may play a role in organelle transport. GO terms linked to transport had higher fold changes for the noncanonical protein than for that of the canonical protein. Protein relocalization to ER (GO:0072599), SRP-dependent cotranslational protein targeting to membrane (GO:0006614) and nuclear-transcribed mRNA catabolic process, nonsense-mediated decay (GO:0000184) were the top ranked terms for the noncanonical isoform c.
LNPEP is known as an aminopeptidase; it degrades peptide hormones including angiotensin II, oxytocin, and vasopressin. Fold changes for GO terms linked to peptidase activity were higher for the canonical protein compared to that of the noncanonical proteins. Cytokine-mediated signaling pathway (GO:0019221) and glycolysis (GO:0006096) were the top ranking GO terms for LNPEP isoform 2.
RICTOR protein is a subunit of mTOR Complex 2 (mTORC2) that regulates cell growth and survival in response to hormonal signals. Cell cycle related events including sister chromatid segregation (GO:0000819), mitotic recombination (GO:0006312), and chromosome segregation (GO:0007059) were the top GO terms for the RICTOR isoform 3. With regard to response to hormone stimulus, the canonical and isoform 3 proteins had the same fold change for response to growth hormone stimulus (GO:0060416).
RNF216 gene encodes a cytoplasmic protein, which specifically colocalizes and interacts with the serine/threonine protein kinase, receptor-interacting protein (RIP). Zinc finger domains of the encoded protein are required for its interaction with RIP and for inhibition of TNF- and IL1-induced NF-kappa B activation pathways (GeneCards). Fold change for negative regulation of I-kappaB kinase/NF-kappaB signaling (GO:0043124) was higher for the canonical protein than the noncanonical protein. GO terms including type I interferon-mediated signaling pathway (GO:0060337), establishment of protein localization in endoplasmic reticulum (GO:0072599), and SRP-dependent cotranslational protein targeting to membrane (GO:0006614) were the top GO terms for the noncanonical RNF216 isoform 2.
DISCUSSION
Despite the growing evidence on the roles of specific isoforms in driving breast cancer, there is very little information on the expression of specific splice isoforms and their potential functions in Her2+ BC. In this study, we identified six alternative/noncanonical splice isoforms that were overexpressed in tumor tissues from HER2+/ER−/PR− BC patients compared to normal breast tissues, TNBC, and Non-TNBC tumor tissues.
One plausible explanation for the differential expression of noncanonical isoforms specific to HER2+/ER−/PR− BC could be that the HER2 overexpression somehow influences the splicing processes. HER2 overexpression/enrichment could lead to trans-acting mutations that affect the function of basal factors of the splicing machinery. In TPBC samples, the presence of ER/PR receptors along with HER2 could have a distinct effect compared to just HER2+/ER−/PR− BC. From our previous analyses on alternative splicing expressed in HER2+ cell lines, we have observed that mRNA splicing as one of the top enriched biological processes for the genes that are differentially expressed in cancer cells compared to normal cells.16
As the functional annotations on the noncanonical splice isoforms are not known, we used computational tools to infer their functional roles in HER2+/ER−/PR− BC. We were able to infer possible distinct functions for these six isoforms (DMXL2 isoform 3, HIF1A isoform 3, KLC1 isoform c, LNPEP isoform 2, RICTOR isoform 3, and RNF216 isoform 2) compared to their corresponding canonical forms. We identified unique reads for all of these six isoforms in the two HER2+ cell lines SKBR3 and SUM190 we studied16 at the transcript level. However, we found only LNPEP in SKBR3 at the proteomics level. This could be due to limits of sensitivity in the proteomics techniques used.
DMXL2 Isoform 3
According to motif predictions, the addition of a serine residue at position 2278 in DMXL2 isoform 3 created two potential functional motifs, a 14–3–3 ligand and another motif that can bind to STAT3-SH2 domain. Angrand et al. reported direct interaction between DMXL2 and YWHAZ (14–3–3 zeta) proteins in mouse using tandem affinity purification (TAP) and LC–MS.32,33 The TAP technology when coupled to MS efficiently permits the characterization of protein complexes. Angrand group did not do functional validation on the DMXl2-YWHAZ interaction; however, biochemical and functional characterization of a few other proteins, which they identified from TAP/MS analyses, revealed cell signaling pathways and cytoskeletal rearrangements as the major mechanisms involving YWHAZ protein–protein interactions.32 Function predictions using MIL algorithms for DMXL2 isoform 3 indicated high fold changes for signaling processes including cytokine-mediated signaling (10-fold, p < 0.0003), regulation of DNA damage response, signal transduction by p53 class mediator (8.5-fold, p < 0.003), and regulation of BMP signaling (4 fold, p < 0.1). In addition, the fold change for glycolytic process was 27 for the isoform 3 compared to just 2 for the canonical protein (Table 3); a probable explanation for this metabolic phenomenon could be via the STAT3-SH2 domain binding found in the noncanonical protein. Several recent studies have reported the nontranscriptional role of STAT3 in cellular metabolic processes.34–36 We believe that the functional motifs uniquely found in DMXL2 isoform 3 are involved in the biological processes predicted with high fold changes for this protein.
Even though DMXL2 has not been previously directly linked to HER2+/ER−/PR− BC the DMXL2–YWHAZ and DMXL2–STAT3 associations are interesting as both YWHAH and STAT3 are implicated in Her2+ BC.37,38 Moreover, it is interesting to note here that we found multiple isoforms of STAT3 in our analyses on HER2+ cell lines, SKBR3 and SUM190.16
HIF1A Isoform 3
HIF1A (Hypoxia Inducible Factor 1, Alpha Subunit) is a basic helix–loop–helix PAS domain containing protein and is considered the master transcriptional regulator of cellular and developmental response to hypoxia. It induces the expression of different genes whose products play an adaptive role for hypoxic cells and tissues; HIF1A is linked to several types of cancers.39,40 Computational functional inferences suggested distinct functions for HIF1A isoform 3 compared to the canonical protein. The differences in the translated sequences of the first exon of the HIF1A canonical and isoform 3 proteins produced structural differences that are evident from the three-dimensional structure predictions of their first domains (Figure 4a). Figure 4a shows the coil region containing the unique NGR motif of isoform 3. NGR motif prediction along with 4-fold change for the integrin-mediated signaling by function prediction indicates involvement of HIF1A isoform 3 in integrin signaling pathway (fold change for integrin signaling for the canonical protein was only 2). Beta integrin plays a critical role in HER2+ tumor progression.41
SRP-dependent cotranslational protein targeting to membrane was 31-fold increased for the HIF1A isoform 3 compared to 4-fold for the corresponding canonical protein (Table 3). SRP and its receptor initiate the transfer of the nascent polypeptide chain across the endoplasmic reticulum (ER) membrane. Higher fold changes for this process was also observed in KLC1 isoform c and RNF216 isoform 3 (Table 3). The exact functional role of these three noncanonical isoforms in this process is not clear and deserves further detailed investigation.
KLC1 Isoform c
Kinesin 2 is a microtubule-associated force-producing protein that may play a role in organelle transport. No previous reports link KLC1 with HER2+/ER−/PR− BC. It is interesting to note here that Human Protein Atlas (http://www.proteinatlas.org/) reports strong cytoplasmic immunohistochemical positivity for KLC1 in some human breast cancer tissues (receptor status not reported).
The superimposed three-dimensional structure predictions of canonical KLC1 and KLC1 isoform c indicated no major structural differences (Figure 4b) except for a short misalignment from 534 to 537 (PDGG residues). Interestingly, a caspase cleavage motif was predicted in the residues from 534 to 538; the structural difference between the two proteins observed in this region may have an impact on their cleavage. According to GeneCards, KLC1 is involved in transport; the fold changes for all GO terms linked to transport were higher for isoform c than the canonical protein. The absence of the two C-terminal amidation sites in isoform c protein could be a reason for this functional difference.
LNPEP Isoform 2
Leucyl/Cystinyl Aminopeptidase (LNPEP) that cleaves peptide hormones can be secreted in maternal serum and is involved in gestational diabetes. There are no previous studies linking this gene to human HER2+ BC. Again, Human Protein Atlas (http://www.proteinatlas.org/) reports strong cytoplasmic positivity for LNPEP in some human breast cancer tissues (HER2 status not reported). Carrera et al.42 reported the involvement of LNPEP (IRAP) in the promotion and progression of breast cancer in rats through peptide hormones and/or renin-angiotensin system (RAS) misregulation.
The only functional motif difference between the canonical and isoform 2 proteins was the absence of a calcineurin (PP2B)-docking motif in the shorter isoform. According to ELM resources (http://elm.eu.org/), this motif regulates a number of different pathways, including activation of the NFAT family of transcription factors, regulation of axonal guidance, Ca2+-dependent migration of neutrophils, synaptic plasticity, and apoptosis. Interestingly, we found response to calcium (GO:0051592) with higher fold change (~16-fold, p < 2 × 10⁻⁸) for canonical protein than the isoform 2 (~2-fold, p < 0.57). Absence of calcineurin (PP2B)-docking motif could be the probable cause for the low fold change for this process observed in isoform 2 protein.
GO terms linked to cytokine-mediated signaling pathway and glycolysis had high fold changes for the noncanonical LNPEP isoform 2 (13-fold (p < 3 × 10⁻⁶) and 11-fold (p < 7 × 10⁻⁵)) compared to those of the canonical protein (4- and 1-fold) (Table 3). The absence of calcineurin (PP2B)-docking motif may be one reason for the differences in fold changes for these biological processes.
RICTOR Isoform 3
There are multiple reports on the involvement of mTORC2 in HER2+ BC.43–45 Motif predictions for the unique peptide sequence of isoform 3 included motifs involved in cell division events (Table 2). This observation was further supported by the function predictions; top ranking GO terms based on fold changes were linked to cell cycle events (Table 3) including chromosome segregation and mitotic recombination. Recent study shows mTORC2 to regulate glycolysis in cancer.46 Glycolysis was two times higher in isoform 3 (~6-fold, p < 0.03) compared to canonical protein (~3-fold, p < 0.4). The computational predictions indicate that RICTOR isoform 3 may have a distinct role in HER2+/ER−/PR− BC through cell cycle events.
RNF216 Isoform 2
Functional annotations of RNF216 include proteosomal degradation, regulation of antiviral response, regulation of NF-kappa pathway, and apoptosis. Unlike the other five isoforms discussed above, for RNF216 isoform 2, there were no GO-terms predicted with very high fold change (≥10-fold) compared to corresponding canonical protein. The top ranking GO term for isoform 2 was type I interferon-mediated signaling pathway (GO:0060337) with fold change of 6.7 compared to 4 for canonical protein. This observation suggests that the two proteins may have similar function and the overexpression of isoform 2 in HER2+/ER−/PR− BC accentuates the function of the canonical protein. According to motif prediction, a BRCT phosphopeptide motif that binds with low affinity to the BRCT domain of BRCA1 is found in the unique peptide sequence of RNF216 isoform 2. BRCT domains are typically associated with cell cycle checkpoint functions responsive to DNA damage. Based on function prediction, for the isoform 2, regulation of DNA damage response (GO:0043516) had a 5-fold change (p < 0.08) compared to baseline, whereas the canonical protein had a fold change of 1.76. There are no previous reports linking RNF216 with HER2+ BC.
One caveat in this study is that even though computational inferences were all done on protein sequences, the isoform identifications were based on transcript expression. Our next step is to validate the protein expression of the six noncanonical isoforms in primary HER2+/ER−/PR− breast tumor samples using selected reaction monitoring (SRM) analyses and to experimentally validate the computational functional inferences.
In summary, computational analyses on the six isoforms that were overexpressed in HER2+ BC indicated distinct functions compared to their corresponding canonical proteins. Functional inferences pointed to involvement of most of these noncanonical proteins in cell cycle events and glycolysis. HER2 overexpression typifies an aggressive form of breast cancer that is associated with significantly shortened disease-free and overall survival compared with women whose tumors do not overexpress HER2. The six noncanonical proteins that we found in this study could be potential biomarkers and therapeutic targets for HER2+/ER−/PR− BC patients.
Acknowledgments
This work was supported in part by NIH grants RM-08-029, P30 U54ES017885, and UL1RR24986.
Footnotes
Notes
The authors declare no competing financial interest.
References
- 1.Buratti E, Baralle M, Baralle FE. Defective splicing, disease and therapy: searching for master checkpoints in exon definition. Nucleic Acids Res. 2006;34(12):3494–510. doi: 10.1093/nar/gkl498. [DOI] [PMC free article] [PubMed] [Google Scholar]
- 2.Tazi J, Bakkour N, Stamm S. Alternative splicing and disease. Biochim Biophys Acta, Mol Basis Dis. 2009;1792(1):14–26. doi: 10.1016/j.bbadis.2008.09.017. [DOI] [PMC free article] [PubMed] [Google Scholar]
- 3.Christofk HR, Vander Heiden MG, Harris MH, Ramanathan A, Gerszten RE, Wei R, Fleming MD, Schreiber SL, Cantley LC. The M2 splice isoform of pyruvate kinase is important for cancer metabolism and tumour growth. Nature. 2008;452(7184):230–233. doi: 10.1038/nature06734. [DOI] [PubMed] [Google Scholar]
- 4.Avery-Kiejda KA, Morten B, Wong-Brown MW, Mathe A, Scott RJ. The relative mRNA expression of p53 isoforms in breast cancer is associated with clinical features and outcome. Carcinogenesis. 2014;35(3):586–96. doi: 10.1093/carcin/bgt411. [DOI] [PubMed] [Google Scholar]
- 5.Wendt MK, Taylor MA, Schiemann BJ, Sossey-Alaoui K, Schiemann WP. Fibroblast growth factor receptor splice variants are stable markers of oncogenic transforming growth factor- beta1 signaling in metastatic breast cancers. Breast Cancer Res. 2014;16(2):R24. doi: 10.1186/bcr3623. [DOI] [PMC free article] [PubMed] [Google Scholar]
- 6.Khan S, Bennit HF, Turay D, Perez M, Mirshahidi S, Yuan Y, Wall NR. Early diagnostic value of survivin and its alternative splice variants in breast cancer. BMC Cancer. 2014;14:176. doi: 10.1186/1471-2407-14-176. [DOI] [PMC free article] [PubMed] [Google Scholar]
- 7.Niu Y, Wang Y, Wang S, Zhang J, Zhang F, Liu Z. Nek2C functions as a tumor promoter in human breast tumorigenesis. Int J Mol Med. 2012;30(4):775–82. doi: 10.3892/ijmm.2012.1069. [DOI] [PubMed] [Google Scholar]
- 8.Liu S, Im H, Bairoch A, Cristofanilli M, Chen R, Deutsch EW, Dalton S, Fenyo D, Fanayan S, Gates C, Gaudet P, Hincapie M, Hanash S, Kim H, Jeong SK, Lundberg E, Mias G, Menon R, Mu Z, Nice E, Paik YK, Uhlen M, Wells L, Wu SL, Yan F, Zhang F, Zhang Y, Snyder M, Omenn GS, Beavis RC, Hancock WS. A chromosome-centric human proteome project (C-HPP) to characterize the sets of proteins encoded in chromosome 17. J Proteome Res. 2013;12(1):45–57. doi: 10.1021/pr300985j. [DOI] [PMC free article] [PubMed] [Google Scholar]
- 9.Yu D, Hung MC. Overexpression of ErbB2 in cancer and ErbB2-targeting strategies. Oncogene. 2000;19(53):6115–21. doi: 10.1038/sj.onc.1203972. [DOI] [PubMed] [Google Scholar]
- 10.Berchuck A, Kamel A, Whitaker R, Kerns B, Olt G, Kinney R, Soper JT, Dodge R, Clarke-Pearson DL, Marks P, et al. Overexpression of HER-2/neu is associated with poor survival in advanced epithelial ovarian cancer. Cancer Res. 1990;50(13):4087–91. [PubMed] [Google Scholar]
- 11.Onitilo AA, Engel JM, Greenlee RT, Mukesh BN. Breast cancer subtypes based on ER/PR and Her2 expression: comparison of clinicopathologic features and survival. Clin Med Res. 2009;7(1–2):4–13. doi: 10.3121/cmr.2009.825. [DOI] [PMC free article] [PubMed] [Google Scholar]
- 12.Staaf J, Ringner M, Vallon-Christersson J, Jonsson G, Bendahl PO, Holm K, Arason A, Gunnarsson H, Hegardt C, Agnarsson BA, Luts L, Grabau D, Ferno M, Malmstrom PO, Johannsson OT, Loman N, Barkardottir RB, Borg A. Identification of subtypes in human epidermal growth factor receptor 2–positive breast cancer reveals a gene signature prognostic of outcome. J Clin Oncol. 2010;28(11):1813–20. doi: 10.1200/JCO.2009.22.8775. [DOI] [PubMed] [Google Scholar]
- 13.Wieduwilt MJ, Moasser MM. The epidermal growth factor receptor family: biology driving targeted therapeutics. Cell Mol Life Sci. 2008;65(10):1566–84. doi: 10.1007/s00018-008-7440-8. [DOI] [PMC free article] [PubMed] [Google Scholar]
- 14.Feigin ME, Muthuswamy SK. ErbB receptors and cell polarity: new pathways and paradigms for understanding cell migration and invasion. Exp Cell Res. 2009;315(4):707–16. doi: 10.1016/j.yexcr.2008.10.034. [DOI] [PubMed] [Google Scholar]
- 15.Rexer BN, Arteaga CL. Intrinsic and acquired resistance to HER2-targeted therapies in HER2 gene-amplified breast cancer: mechanisms and clinical implications. Crit Rev Oncog. 2012;17(1):1–16. doi: 10.1615/critrevoncog.v17.i1.20. [DOI] [PMC free article] [PubMed] [Google Scholar]
- 16.Menon R, Im H, Zhang EY, Wu SL, Chen R, Snyder M, Hancock WS, Omenn GS. Distinct Splice Variants and Pathway Enrichment in the Cell-Line Models of Aggressive Human Breast Cancer Subtypes. J Proteome Res. 2014;13(1):212–227. doi: 10.1021/pr400773v. [DOI] [PMC free article] [PubMed] [Google Scholar]
- 17.Menon R, Roy A, Mukherjee S, Belkin S, Zhang Y, Omenn GS. Functional implications of structural predictions for alternative splice proteins expressed in Her2/neu-induced breast cancers. J Proteome Res. 2011;10(12):5503–11. doi: 10.1021/pr200772w. [DOI] [PMC free article] [PubMed] [Google Scholar]
- 18.Wang Z, Gerstein M, Snyder M. RNA-Seq: a revolutionary tool for transcriptomics. Nat Rev Genet. 2009;10(1):57–63. doi: 10.1038/nrg2484. [DOI] [PMC free article] [PubMed] [Google Scholar]
- 19.Eswaran J, Cyanam D, Mudvari P, Reddy SD, Pakala SB, Nair SS, Florea L, Fuqua SA, Godbole S, Kumar R. Transcriptomic landscape of breast cancers through mRNA sequencing. Sci Rep. 2012;2:264. doi: 10.1038/srep00264. [DOI] [PMC free article] [PubMed] [Google Scholar]
- 20.Horvath A, Pakala SB, Mudvari P, Reddy SD, Ohshiro K, Casimiro S, Pires R, Fuqua SA, Toi M, Costa L, Nair SS, Sukumar S, Kumar R. Novel insights into breast cancer genetic variance through RNA sequencing. Sci Rep. 2013;3:2256. doi: 10.1038/srep02256. [DOI] [PMC free article] [PubMed] [Google Scholar]
- 21.Patro R, Mount SM, Kingsford C. Sailfish enables alignment-free isoform quantification from RNA-seq reads using lightweight algorithms. Nat Biotechnol. 2014;32(5):462–464. doi: 10.1038/nbt.2862. [DOI] [PMC free article] [PubMed] [Google Scholar]
- 22.Robinson MD, McCarthy DJ, Smyth GK. edgeR: a Bioconductor package for differential expression analysis of digital gene expression data. Bioinformatics. 2010;26(1):139–140. doi: 10.1093/bioinformatics/btp616. [DOI] [PMC free article] [PubMed] [Google Scholar]
- 23.Voduc KD, Cheang MC, Tyldesley S, Gelmon K, Nielsen TO, Kennecke H. Breast cancer subtypes and the risk of local and regional relapse. J Clin Oncol. 2010;28(10):1684–91. doi: 10.1200/JCO.2009.24.9284. [DOI] [PubMed] [Google Scholar]
- 24.Altschul SF, Gish W, Miller W, Myers EW, Lipman DJ. Basic local alignment search tool. J Mol Biol. 1990;215(3):403–10. doi: 10.1016/S0022-2836(05)80360-2. [DOI] [PubMed] [Google Scholar]
- 25.Gould CM, Diella F, Via A, Puntervoll P, Gemund C, Chabanis-Davidson S, Michael S, Sayadi A, Bryne JC, Chica C, Seiler M, Davey NE, Haslam N, Weatheritt RJ, Budd A, Hughes T, Pas J, Rychlewski L, Trave G, Aasland R, Helmer-Citterich M, Linding R, Gibson TJ. ELM: the status of the 2010 eukaryotic linear motif resource. Nucleic Acids Res. 2010;38(Database issue):D167–80. doi: 10.1093/nar/gkp1016. [DOI] [PMC free article] [PubMed] [Google Scholar]
- 26.Zhang Y. I-TASSER server for protein 3D structure prediction. BMC Bioinf. 2008;9(1):40. doi: 10.1186/1471-2105-9-40. [DOI] [PMC free article] [PubMed] [Google Scholar]
- 27.Zhang Y, Skolnick J. TM-align: a protein structure alignment algorithm based on the TM-score. Nucleic Acids Res. 2005;33(7):2302–2309. doi: 10.1093/nar/gki524. [DOI] [PMC free article] [PubMed] [Google Scholar]
- 28.Eksi R, Li HD, Menon R, Wen Y, Omenn GS, Kretzler M, Guan Y. Systematically differentiating functions for alternatively spliced isoforms through integrating RNA-seq data. PLoS Comput Biol. 2013;9(11):e1003314. doi: 10.1371/journal.pcbi.1003314. [DOI] [PMC free article] [PubMed] [Google Scholar]
- 29.Li HD, Menon R, Omenn GS, Guan Y. The emerging era of genomic data integration for analyzing splice isoform function. Trends Genet. 2014;30(8):340–7. doi: 10.1016/j.tig.2014.05.005. [DOI] [PMC free article] [PubMed] [Google Scholar]
- 30.Li HD, Menon R, Omenn GS, Guan Y. Revisiting the identification of canonical splice isoforms through integration of functional genomics and proteomics evidence. Proteomics. 2014;14(23–24):2709–18. doi: 10.1002/pmic.201400170. [DOI] [PMC free article] [PubMed] [Google Scholar]
- 31.Xue Z, Xu D, Wang Y, Zhang Y. ThreaDom: extracting protein domain boundary information from multiple threading alignments. Bioinformatics. 2013;29(13):i247–56. doi: 10.1093/bioinformatics/btt209. [DOI] [PMC free article] [PubMed] [Google Scholar]
- 32.Angrand PO, Segura I, Volkel P, Ghidelli S, Terry R, Brajenovic M, Vintersten K, Klein R, Superti-Furga G, Drewes G, Kuster B, Bouwmeester T, Acker-Palmer A. Transgenic mouse proteomics identifies new 14–3-3-associated proteins involved in cytoskeletal rearrangements and cell signaling. Mol Cell Proteomics. 2006;5(12):2211–27. doi: 10.1074/mcp.M600147-MCP200. [DOI] [PubMed] [Google Scholar]
- 33.Stark C, Breitkreutz BJ, Reguly T, Boucher L, Breitkreutz A, Tyers M. BioGRID: a general repository for interaction datasets. Nucleic Acids Res. 2006;34(Database issue):D535–9. doi: 10.1093/nar/gkj109. [DOI] [PMC free article] [PubMed] [Google Scholar]
- 34.Qi QR, Yang ZM. Regulation and function of signal transducer and activator of transcription 3. World J Biol Chem. 2014;5(2):231–9. doi: 10.4331/wjbc.v5.i2.231. [DOI] [PMC free article] [PubMed] [Google Scholar]
- 35.Shaw PE. Could STAT3 provide a link between respiration and cell cycle progression? Cell Cycle. 2010;9(21):4294–6. doi: 10.4161/cc.9.21.13677. [DOI] [PMC free article] [PubMed] [Google Scholar]
- 36.Demaria M, Camporeale A, Poli V. STAT3 and metabolism: how many ways to use a single molecule? Int J Cancer. 2014;135(9):1997–2003. doi: 10.1002/ijc.28767. [DOI] [PubMed] [Google Scholar]
- 37.Bergamaschi A, Christensen BL, Katzenellenbogen BS. Reversal of endocrine resistance in breast cancer: interrelationships among 14–3-3zeta, FOXM1, and a gene signature associated with mitosis. Breast Cancer Res. 2011;13(3):R70. doi: 10.1186/bcr2913. [DOI] [PMC free article] [PubMed] [Google Scholar]
- 38.Vadgama JV, Giehl N, Wu Y, Chung SS. STAT3 activation in HER2-overexpressing breast cancer promotes epithelial-mesenchymal transition and cancer stem cell traits. Int J Oncol. 2014;44(2):403–11. doi: 10.3892/ijo.2013.2195. [DOI] [PMC free article] [PubMed] [Google Scholar]
- 39.El-Naggar AM, Veinotte CJ, Cheng H, Grunewald TG, Negri GL, Somasekharan SP, Corkery DP, Tirode F, Mathers J, Khan D, Kyle AH, Baker JH, LePard NE, McKinney S, Hajee S, Bosiljcic M, Leprivier G, Tognon CE, Minchinton AI, Bennewith KL, Delattre O, Wang Y, Dellaire G, Berman JN, Sorensen PH. Translational Activation of HIF1alpha by YB-1 Promotes Sarcoma Metastasis. Cancer Cell. 2015;27(5):682–97. doi: 10.1016/j.ccell.2015.04.003. [DOI] [PubMed] [Google Scholar]
- 40.Wan L, Huang J, Chen J, Wang R, Dong C, Lu S, Wu X. Expression and significance of FOXP1, HIF-1a and VEGF in renal clear cell carcinoma. J BUON. 2015;20(1):188–95. [PubMed] [Google Scholar]
- 41.Huck L, Pontier SM, Zuo DM, Muller WJ. β1-integrin is dispensable for the induction of ErbB2 mammary tumors but plays a critical role in the metastatic phase of tumor progression. Proc Natl Acad Sci U S A. 2010;107(35):15559–15564. doi: 10.1073/pnas.1003034107. [DOI] [PMC free article] [PubMed] [Google Scholar]
- 42.Pilar Carrera M, Ramirez-Exposito MJ, Duenas B, Dolores Mayas M, Jesus Garcia M, De la Chica S, Cortes P, Ruiz-Sanjuan M, Martinez-Martos JM. Insulin-regulated aminopeptidase/placental leucil Aminopeptidase (IRAP/P-lAP) and angiotensin IV-forming activities are modified in serum of rats with breast cancer induced by N-methyl-nitrosourea. Anticancer Res. 2006;26(2a):1011–4. [PubMed] [Google Scholar]
- 43.Andrade-Vieira R, Goguen D, Bentley HA, Bowen CV, Marignani PA. Pre-clinical study of drug combinations that reduce breast cancer burden due to aberrant mTOR and metabolism promoted by LKB1 loss. Oncotarget. 2014;5(24):12738–52. doi: 10.18632/oncotarget.2818. [DOI] [PMC free article] [PubMed] [Google Scholar]
- 44.Lin MC, Rojas KS, Cerione RA, Wilson KF. Identification of mTORC2 as a necessary component of HRG/ErbB2-dependent cellular transformation. Mol Cancer Res. 2014;12(6):940–52. doi: 10.1158/1541-7786.MCR-13-0555. [DOI] [PMC free article] [PubMed] [Google Scholar]
- 45.Wilson-Edell KA, Yevtushenko MA, Rothschild DE, Rogers AN, Benz CC. mTORC1/C2 and pan-HDAC inhibitors synergistically impair breast cancer growth by convergent AKT and polysome inhibiting mechanisms. Breast Cancer Res Treat. 2014;144(2):287–98. doi: 10.1007/s10549-014-2877-y. [DOI] [PMC free article] [PubMed] [Google Scholar]
- 46.Masui K, Tanaka K, Akhavan D, Babic I, Gini B, Matsutani T, Iwanami A, Liu F, Villa GR, Gu Y, Campos C, Zhu S, Yang H, Yong WH, Cloughesy TF, Mellinghoff IK, Cavenee WK, Shaw RJ, Mischel PS. mTOR Complex 2 Controls Glycolytic Metabolism in Glioblastoma through FoxO Acetylation and Upregulation of c-Myc. Cell Metab. 2013;18(5):726. doi: 10.1016/j.cmet.2013.09.013. [DOI] [PMC free article] [PubMed] [Google Scholar]