Abstract
While in vitro studies have demonstrated that a glucocorticoid receptor (GR) splice isoform, β-isoform of human GR (hGRβ), acts as a dominant-negative inhibitor of the classic hGRα and confers glucocorticoid resistance, the in vivo function of hGRβ is poorly understood. To this end, we created an adeno-associated virus (AAV) to express hGRβ in the mouse liver under the control of the hepatocyte-specific promoter. Genome-wide expression analysis of mouse livers showed that hGRβ significantly increased the expression of numerous genes, many of which are involved in endocrine system disorders and the inflammatory response. Physiologically, hGRβ antagonized GRα's function and attenuated hepatic gluconeogenesis through downregulation of phosphoenolpyruvate carboxykinase (PEPCK) in wild-type (WT) mouse liver. Interestingly, however, hGRβ did not repress PEPCK in GR liver knockout (GRLKO) mice. In contrast, hGRβ regulates the expression of STAT1 in the livers of both WT and GRLKO mice. Chromatin immunoprecipitation (ChIP) and luciferase reporter assays demonstrated that hGRβ binds to the intergenic glucocorticoid response element (GRE) of the STAT1 gene. Furthermore, treatment with RU486 inhibited the upregulation of STAT1 mediated by hGRβ. Finally, our array data demonstrate that hGRβ regulates unique components of liver gene expression in vivo by both GRα-dependent and GRα-independent mechanisms.
INTRODUCTION
Glucocorticoids, the end products of the hypothalamic-pituitary-adrenal axis, are primary stress hormones that are essential for life. They are released into the circulation in response to environmental and physiological stress and regulate basal and stress-related homeostasis. The physiological and pharmacological actions of glucocorticoids are mediated by the ubiquitously expressed glucocorticoid receptor (GR) (NR3C1), a hormone-binding transcription factor of the nuclear receptor superfamily. The cellular response to glucocorticoids exhibits great variability in terms of sensitivity and specificity among individuals and even within tissues of the same individual. This diversity is mediated, at least in part, by multiple GR isoforms arising from alternative processing of the GR gene (1). The individual GR isoforms have unique expression and gene regulation profiles under specific physiological conditions (2). Since glucocorticoid signaling profiles reflect a comprehensive effect of all transcriptional and translational GR isoforms available in a given cell or a specific tissue, it is essential to understand the physiological role of each individual GR isoform in animal models.
The human glucocorticoid receptor gene consists of 9 exons. Alternative splicing in the C-terminal exon 9 produces the hormone-binding α-isoform of human GR (hGRα) and a non-hormone-binding splice isoform, hGRβ. While hGRα is the classic receptor and mediates most of the known actions of glucocorticoids, the physiological actions of hGRβ have not been explored in vivo. hGRβ shares the first 727 amino acids with hGRα, covering the N-terminal domain (NTD) and DNA binding domain (DBD). From the point of divergence at amino acid 728, hGRα contains an additional 50 amino acids forming a complete ligand binding domain (LBD), whereas the splice variant hGRβ encodes only an additional 15 nonhomologous amino acids in the C terminus, which is missing helices 11 and 12 of hGRα (3). Consequently, hGRβ cannot form a stable complex in the ligand binding pocket, does not bind glucocorticoid agonists, and cannot directly activate glucocorticoid-responsive reporter genes (4, 5). However, when coexpressed with hGRα in cell culture, hGRβ demonstrated a dominant-negative effect on GRα-induced transcription activity (5, 6). Importantly, expression of hGRβ is selectively induced by proinflammatory cytokines, and the increased expression of hGRβ has also been correlated with the attenuation of hGRα signaling activity and the development of glucocorticoid resistance in many inflammatory diseases (7). hGRβ has also been shown to be the predominant GR isoform expressed during inflammation in cell culture (7, 8). Furthermore, a polymorphism in hGRβ that leads to its overexpression has strong associations with human inflammatory diseases (9, 10). Epidemiological studies have shown that this polymorphism in hGRβ is also associated with the alteration of glucose and lipid homeostasis by glucocorticoids. Several mechanisms have been proposed to explain the antagonism mediated by hGRβ, including competition for the glucocorticoid response element (GRE), formation of inactive GRα/GRβ heterodimers, and competition for transcriptional coregulators to form a transcription complex in the promoter region of target genes (2).
Using genome-wide microarray analysis on cells selectively overexpressing hGRβ, recent studies have discovered that hGRβ also has intrinsic transcriptional activities and directly modulates the expression profiles of a large number of genes when hGRβ is transfected into cells that do not contain hGRα (6, 7). In addition, we have shown that, despite the lack of helix 12 in its ligand binding domain, hGRβ binds the antiglucocorticoid compound RU486 (mifepristone) but not glucocorticoid agonists. Binding of RU486 with hGRβ diminishes many changes in gene expression regulated by hGRβ expression in U2 OS cells (11). These in vitro studies suggested that hGRβ can indeed function as a transcription factor and regulate glucocorticoid responses through genomic actions distinct from its antagonism of GRα in the context of a transformed cell line. In the present studies, our goal was to understand the contributions of hGRβ to the actions of glucocorticoids in mice and to further define mechanisms of hGRβ regulation of gene expression. To accomplish this goal, we utilized an adeno-associated virus (AAV)-mediated gene delivery system under the control of the liver-specific human α1-antitrypsin (hAAT) promoter to achieve hepatocyte-specific hGRβ expression in both C57BL/6 wild-type (WT) and GR liver knockout (GRLKO) mice. Our approach resulted in hGRβ-specific expression in the livers of 3-month-old mice as early as 4 weeks after intravenous AAV injection. Genome-wide expression analysis showed that hGRβ significantly increased the expression of numerous genes in the AAV-hGRβ-injected WT mouse livers, many of which are involved in endocrine system disorders, immunological disease, and inflammatory response. In animals harboring wild-type glucocorticoid receptor in the liver, hGRβ antagonized GRα's function and attenuated hepatic gluconeogenesis through downregulation of phosphoenolpyruvate carboxykinase (PEPCK). However, this repression did not occur in the livers of GRLKO mice. hGRβ also had distinct intrinsic biological activity in both mouse models, as reflected by its binding to the intergenic GRE of the signal transducer and activator of transcription 1 (STAT1) gene and inducing STAT1 transcription in the liver. Our results reveal a scenario of GRα-dependent and -independent transcriptional activity of hGRβ in vivo.
MATERIALS AND METHODS
AAV vector construction and production.
Recombinant hAAT promoter-driven Flag-tagged human GRβ or green fluorescent protein (GFP) AAV vectors were constructed by the standard cloning protocols. The vector DNA was packaged into AAV9 particles by triple-plasmid transfection of HEK293 cells (12) and purified by polyethylene glycol precipitation followed by CsCl centrifugation (13). DNA dot blots were used to determine the titers of the purified viral stocks as viral genomes (vg) per milliliter.
Animals and vector administration.
Adult C57BL/6 mice (8 to 10 weeks of age) were purchased from Charles River Laboratories. For generation of GRLKO mice, loxP sites were inserted into the GR locus and covered exon 3 and exon 4 on a C57BL/6 background (14). Mice homozygous for the floxed GR allele (GRloxp loxp) were crossed with Albumin-Cre mice from the Jackson Laboratories. All experimental protocols were approved by the Animal Review Committee of the National Institute of Environmental Health Sciences (NIEHS), NIH, and were performed according to the guidelines for animal care and use. For vector administration, C57BL/6 mice were intravenously injected with AAV9-hAAT-Flag-hGRβ in 0.1 ml of solution via the retro-orbital venous sinus. Three different AAV dosages (low dose, 1 × 10¹¹ vg; medium dose, 5 × 10¹¹ vg; high dose, 2 × 10¹² vg) were tested in a pilot experiment to determine the optimal injection dosage. AAV injection with 5 × 10¹¹ vg resulted in a high level of hGRβ expression without producing hepatotoxicity. Therefore, this dosage was chosen for both AAV9-hAAT-Flag-hGRβ and AAV9-hAAT-Flag-GFP in subsequent experiments.
Histology, immunochemistry, and Western blot analysis.
Liver and other tissues were collected 1 month after vector injection. Paraformaldehyde-fixed and paraffin-embedded tissues were analyzed by hematoxylin and eosin (H&E) staining and immunohistochemical staining. Cryosectioned tissues with a thickness of 7 μm were analyzed by immunofluorescent staining with affinity-purified anti-hGRβ antibody, BShGR, prepared in our laboratory (15). Radioimmunoprecipitation assay (RIPA) buffer-lysed tissue extracts were resolved on 4 to 20% or 7.5% SDS-PAGE gels (Bio-Rad, CA) and transferred onto nitrocellulose membranes (Bio-Rad, CA). The dilutions of antibodies were as follows: rabbit anti-Flag (Sigma; F7425), 1:1,000; anti-GR 57, prepared in our laboratory (16), 1:1,000; anti-GR D8H2 (Cell Signaling; 3660), 1:1,000; anti-GAPDH (anti-glyceraldehyde-3-phosphate dehydrogenase) (Abcam; ab9485), 1:1,000.
Microarray analysis.
Gene expression analysis was performed on RNA from livers from different treatment groups using Whole Mouse Genome 4-by-44 multiplex format oligonucleotide arrays (Agilent Technologies; 014868) by following the Agilent 1-color microarray-based gene expression analysis protocol. Briefly, starting with 500 ng of total RNA, Cy3-labeled cRNA was produced according to the manufacturer's protocol. For each sample, 1.65 μg of Cy3-labeled cRNA was fragmented and hybridized for 17 h in a rotating hybridization oven. The slides were washed and scanned (Agilent). Data were obtained with the Agilent Feature Extraction software (v9.5), using the 1-color defaults for all parameters. The Agilent Feature Extraction software performed error modeling, adjusting for additive and multiplicative noise. The resulting data were processed using OmicSoft Array Studio (v7.0). Principal-component analysis (PCA) was performed with all samples and all probes to reduce dimensionality of the data while preserving the variations in the data sets. This allowed us to assess the similarities and differences of samples within a treatment group and between treatment groups. Three biological replicate microarrays were completed for each group. In order to identify differentially expressed probes, analysis of variance (ANOVA) was used to determine if there was a statistical difference between the means of groups. Specifically, an error-weighted ANOVA with a P value of <0.05 was performed using OmicSoft Array Studio (v7.0) software. As previously described (17), the lists of probe sets generated were visually sorted by using a Venn diagram generator (http://www.bioinformatics.lu/venn.php) and further analyzed with Pathway Analysis version 6.5 (Ingenuity Systems). For Ingenuity pathway analysis (IPA), a P value of <0.05 (Fisher exact test) was used as the cutoff for significant biological functions, networks, and pathways, and they were ranked by ratio. Canonical pathways were determined by applying Benjamini-Hochberg multiple-testing adjustments to the P values. These are represented as q values of <0.05 as an indication of significance.
PTTs.
Hepatic gluconeogenesis was estimated using pyruvate tolerance tests (PTTs). After 18 h of fasting, mice were intraperitoneally injected with sodium pyruvate in saline (Sigma; P5280; 1.5 g/kg body weight). Plasma samples were collected to measure circulating glucose concentrations with a glucometer at 0, 10, 20, 30, 45, 60, 90, and 120 min following pyruvate injection.
Liver tissue ChIP assays.
Liver tissue (0.20 g) from each treatment was used for chromatin immunoprecipitation (ChIP) assays according to the protocol of the ChIP assay kit (Millipore; 17-295), with minor modifications. Briefly, minced liver tissue was cross-linked with 1% paraformaldehyde–phosphate-buffered saline (PBS) for 20 min at room temperature. The liver tissue was then resuspended in SDS cell lysis buffer (Millipore; 20-163; 1% SDS, 10 mM EDTA, 50 mM Tris, pH 8.1) with proteinase inhibitor cocktails. After homogenization on ice, the liver chromatin was sonicated into 200- to 500-bp fragments. Then, 0.15 ml of the chromatin extracts was diluted in 1.5 ml of ChIP dilution buffer (Millipore; 20-153), followed by preclearance with 50 μl of salmon sperm DNA–protein A-agarose, 50% slurry (Millipore; 16-157C), for 30 min at 4°C with rotation. Immunoprecipitation was performed with either 5 μg rabbit anti-Flag antibody (Sigma; F7425) or 5 μg normal rabbit IgG (Millipore; 12-370) at 4°C overnight. The immunoprecipitated DNA complex was pulled down using salmon sperm DNA–protein A-agarose, 50% slurry (Millipore; 16-157C). After washing and elution, cross-links were reversed and the DNA was purified using a MiniElute PCR purification kit (Qiagen; 28004). The amount of immunoprecipitated DNA was then quantified using real-time quantitative PCR with corresponding primer-probe sets custom ordered from Integrated DNA Technologies (Coralville, IA): forward primer (5′-TTTCACCTAATAACAGCATCGAC-3), probe (5′-56-fluorescein [′56-FAM]CCGTGGACA-ZEN-GACTGTACAACAAAGCT-3′ Iowa Black FQ [3IABkFQ]-3′), and reverse primer (5′-CCTGGTGATGATACGCTCATA-3′) to the intergenic GRE of STAT1; forward primer (5′-GCAAACAGATGCCAGAGAATG-3), probe (5′-56-FAM-TGTGTTCTG-ZEN-CCTCGGGCTTATGAC-3IABkFQ-3′), and reverse primer (5′-GTCTCATGGGTTTACTGAGAGTAG-3′) to the promoter GRE of STAT1; and forward primer (5′-CTGTTCTGTCCCTGTGTGATT-3′), probe (5′-56-FAM-AAGCTCCAT-ZEN-CGGTTCTGGTGCTAC-3IABkFQ-3′), and reverse primer (5′-GATGTATCCAGTTCGCTTAGGG-3′) to intron 22 GRE of STAT1.
JASPAR CORE database (v5.0) and rVista (v2.0) were used to identify predicted glucocorticoid receptor binding sites within 8,000 bp upstream of the transcriptional start site and 8,000 bp downstream of the last exon of the STAT1 gene.
Luciferase assays.
An ∼700-bp fragment containing the intergenic GRE was cloned into a luciferase reporter plasmid, pGL4.23 (Promega), in the forward orientation using the following primers: 5′-CTGCGGTACCTCTCTTTCCCAGCTGAGGGGGACCGACAGCC-3′ and 5′-GCCAGGTACCAATGGTCTGCACCCCAAGACTTCCATTAC-3′. The sequence of the construct was confirmed by DNA sequencing.
Cos-1 cells were transiently cotransfected with the luciferase reporter plasmid described above and AAV-hGRβ or AAV-GFP plasmid using FuGene 6 transfection reagent (Promega, Madison, WI).
Twenty-four hours after transfection, the cells were split into a 48-well plate with fresh medium, followed by overnight treatment with vehicle or 1 μM RU486. Subsequently, the treated cells were harvested and lysed in lysis buffer, and the luciferase activity was measured using the Dual Luciferase reporter assay (Promega).
Quantitative reverse transcription (qRT)-PCR analysis.
Liver samples were collected from different treatment groups. Total liver RNA was isolated using a Qiagen RNeasy minikit. The abundance of RNAs was determined on a 7900HT sequence detection system with predesigned primer-probe sets from Applied Biosystems (Foster City, CA) according to the manufacturer's instructions. The signal obtained from each gene primer-probe set was normalized to that of the unregulated peptidylpropyl isomerase B (PPIB) housekeeping gene primer-probe set from Applied Biosystems (Foster City, CA). At least three RNA samples from each treatment were analyzed with each primer-probe set.
Statistical analysis.
Student's t test and one-way ANOVA with Tukey's post hoc analysis were performed to evaluate whether differences were statistically significant, using GraphPad software. Statistical significance was defined as a P value of <0.05.
Microarray data accession numbers.
The microarray data discussed have been deposited in NCBI's Gene Expression Omnibus (GEO) (http://www.ncbi.nlm.nih.gov/geo/) and are accessible through GEO accession numbers GSE75740, GSE75683, GSE75682, and GSE5310 (11).
RESULTS
Specific AAV-hGRβ gene transfer in mouse liver.
The ability of AAV to infect both dividing and quiescent cells and to persist in an extrachromosomal state has made it an attractive gene vector for gene therapy. During infection, the proviral AAV genome remains episomal in the nucleus without integrating into the host genome and thus provides stable gene transfer in many tissues, such as muscle, heart, liver, and brain (18). Based on a number of phase I and phase II clinical trials of human gene therapy, AAV has been considered a promising gene therapy vector because of its safety, low immunogenicity, and long-term gene transfer (19).
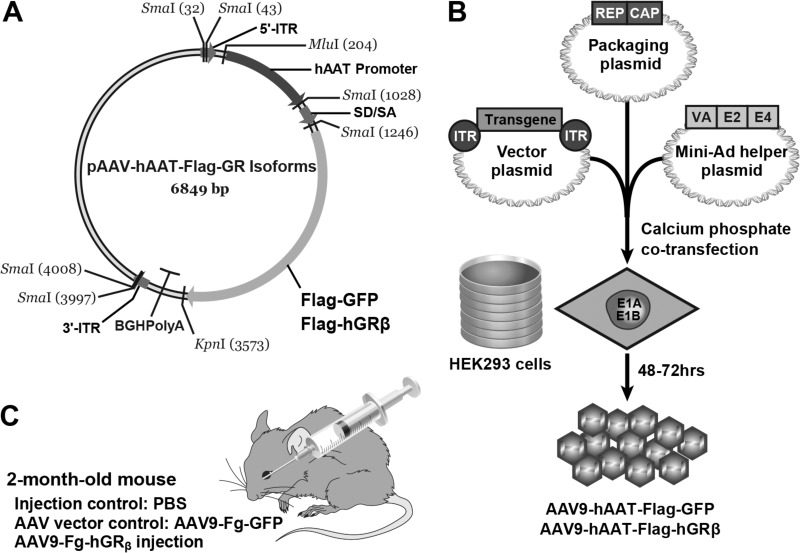
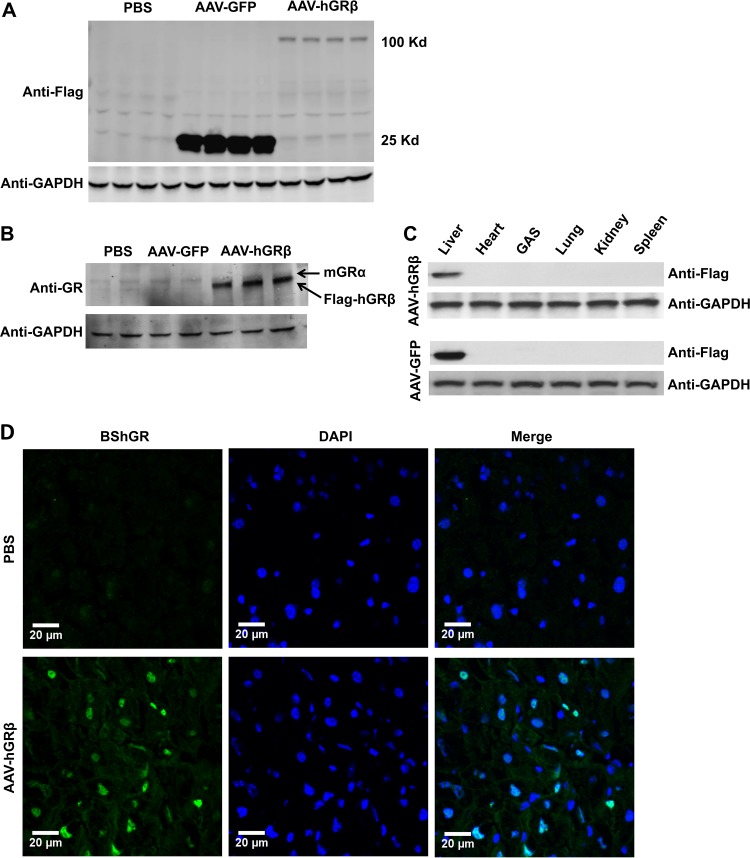
In this study, we took advantage of an AAV-mediated gene transfer method to study the function of hGRβ in mouse liver, a classic glucocorticoid-responsive organ (20). We subcloned Flag-tagged hGRβ cDNA into an AAV vector carrying liver hepatocyte-specific hAAT promoter to achieve hepatocyte-specific hGRβ expression (Fig. 1). To establish a mouse model with hGRβ expression in the liver, we intravenously injected AAV-hAAT-Flag-hGRβ, or AAV-hAAT-Flag-GFP as a vector control, into 2-month-old C57BL/6 WT or GRLKO mice via the retro-orbital venous sinus. AAV typically takes 3 to 4 weeks to trigger transgene expression after trafficking from the circulation to the nucleus (18). Efficient gene transfer of hGRβ was achieved in mouse liver 4 weeks after intravenous AAV injection. When examined by Western blotting with either anti-Flag antibody or anti-GR specific antibody 57, expression of hGRβ was detected in the hGRβ-infected liver but not in the livers of the AAV-GFP vector control group and the PBS control group (Fig. 2A and B). Endogenous mouse GRα (mGRα) expression remained unchanged in the AAV-hGRβ-treated group compared to the control groups (Fig. 2B). In addition, AAV-hAAT-driven gene transfer was highly liver specific. Western blotting with Flag tag antibody showed no signal in other tissues collected from treated animals, such as heart, muscle, lung, kidney, and spleen (Fig. 2C). Finally, immunostaining with the GRβ-specific antibody BShGR confirmed hGRβ gene transfer in the liver, as hGRβ resided predominantly in the nucleus (Fig. 2D), which is consistent with previous in vitro studies (2). These results indicated that AAV-mediated hGRβ gene transfer was efficient, robust, and stable in the livers of young adult mice following intravenous injection, establishing an animal model for physiological studies of hGRβ. The high levels of expression of hGRβ relative to mGRα are consistent with those observed following treatment of human cells with proinflammatory cytokines (8).
FIG 1.
Production and injection of AAV9-hAAT-Flag-hGRβ into C57BL/6 mice. (A) Flag-tagged hGRβ or GFP was subcloned into an AAV9 vector. Gene expression was controlled by the hepatocyte-specific hAAT promoter. Flag-GFP served as a vector control. (B) Transfection of AAV vector, AAV9 packaging plasmid, and Mini-Ad helper plasmid into HEK293 cells was used to produce AAV9-Flag-hGRβ and AAV9-Flag-GFP. (C) AAV was intravenously injected into 2-month-old C57BL/6 mice. PBS injection and AAV-GFP injection were used for injection control and AAV vector control, respectively.
FIG 2.
Specific AAV-Flag-hGRβ gene transfer was achieved in C57BL/6 mouse liver 1 month after injection. (A) Western blot of injected liver samples with Flag tag antibody. Multiple liver samples collected from each treatment group were compared side by side. (B) Western blot of injected liver samples with anti-GR antibody, which recognizes both GRα and GRβ. The endogenous mGRα level remained unchanged when hGRβ was expressed. (C) Flag tag antibody Western blot for different tissue samples after injection. (D) Immunostaining of injected liver samples with the GRβ-specific antibody BShGR. DAPI (4′,6-diamidino-2-phenylindole) staining shows the nuclei. hGRβ resides predominantly in the nucleus.
AAV-injected liver was functional after hGRβ expression.
We subsequently examined whether hGRβ gene transfer affected liver physiological function or induced any hepatotoxicity in WT mice. H&E staining showed normal histology in hGRβ-expressing livers, as determined by the absence of fibrosis and necrosis (Fig. 3A). Alanine aminotransferase (ALT) and alkaline phosphatase (ALP) are liver-specific enzymes. Increased enzyme levels in serum serve as biochemical evidence of liver toxicity and acute hepatocyte damage. Blood chemistry for liver function showed no significant difference in either ALT or ALP in the AAV-hGRβ-treated group compared to control groups (Fig. 3B). Serum albumin, a protein made specifically by the liver, and total protein also remained unchanged (Fig. 3B). These data suggested that AAV-hGRβ-injected liver was functional and not grossly impacted by the expression of hGRβ.
FIG 3.
Expression of hGRβ in hepatocytes does not alter normal liver morphology. (A) H&E staining was used to evaluate histology of treated livers. No fibrosis or necrosis was observed. (B) Serum ALT, ALP, albumin (ALB), and total protein (Tpro) were tested for different groups of wild-type mice. No significant difference was found among groups for each evaluation. The error bars indicate standard errors of the means (SEM).
hGRβ-regulated gene expression profile in WT mouse liver.
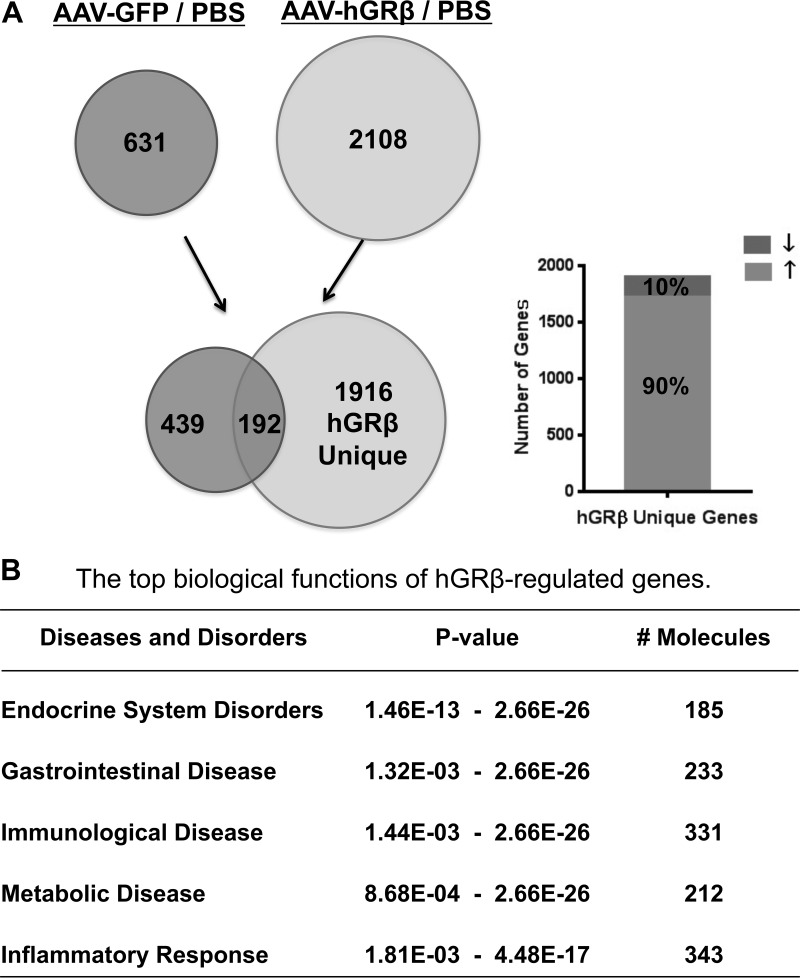
The gene regulation profile of hGRβ in vivo has not been explored. Therefore, we used a whole-genome microarray approach to evaluate the gene regulation profile of hGRβ in mouse liver. Comparison of significantly hybridized probe sets between AAV-hGRβ-injected liver and PBS-injected liver identified 2,108 significantly changed genes after hGRβ expression, while AAV-GFP injection resulted in 631 genes being significantly changed. By comparing these two sets of data (AAV-hGRβ–PBS compared to AAV-GFP–PBS), we detected 1,916 genes specifically regulated by the expressed hGRβ (Fig. 4A, left). The 192 common genes likely represent AAV backbone effects on liver gene expression. Of the 1,916 genes, about 90% showed upregulation of gene expression (Fig. 4A, right). In order to evaluate the possible phenotypes of the 1,916 genes specifically regulated by hGRβ in the context of the available literature, we employed IPA. The hGRβ-regulated genes were most significantly associated with endocrine system disorders, gastrointestinal disease, immunological disease, metabolic diseases, and inflammatory response (Fig. 4B).
FIG 4.
Genome-wide microarray analysis of livers from wild-type C57BL/6 mice expressing hGRβ. The total RNA isolated from each group of C57BL/6 was applied to an Agilent whole-mouse one-color array. (A) Venn diagrams of AAV-GFP-regulated genes (left) and AAV-hGRβ-regulated genes (right). The common part (192 genes) likely reflects AAV backbone effect. The unique part (1,916 genes) of AAV-hGRβ represents hGRβ-regulated genes, about 90% of which are upregulated (up arrow). (B) Ingenuity pathway analysis predicted the top biological functions of hGRβ-regulated genes.
hGRβ attenuates hepatic gluconeogenesis through downregulation of PEPCK in WT liver.
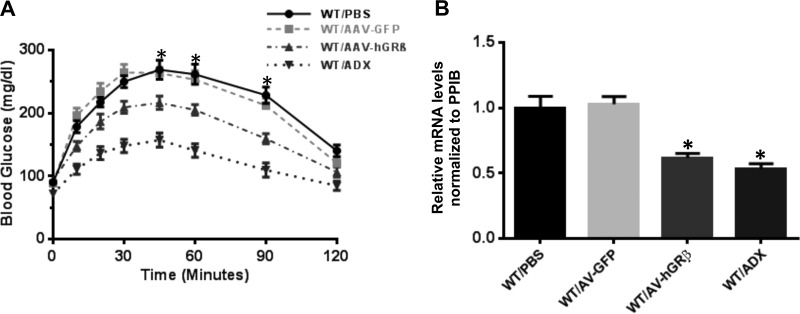
Given the predicted association of hGRβ-regulated genes with endocrine system disorders and metabolic disease, we examined whether injection of AAV-hGRβ altered the classic gluconeogenic action of glucocorticoid in liver. Pyruvate tolerance tests performed on fasted mice revealed that hGRβ expression in the livers of WT mice significantly decreased hepatic gluconeogenesis at 45 min, 60 min, and 90 min after pyruvate injection compared to control animals. These data were similar to those observed in adrenalectomized (ADX) mice, which are devoid of the endogenous glucocorticoid receptor ligand corticosterone (Fig. 5A).
FIG 5.
hGRβ expression in wild-type livers attenuates hepatic gluconeogenesis through downregulation of PEPCK. (A) Blood glucose profiles of PTTs. Two months after AAV injection, blood glucose levels were determined after 18 h of fasting. hGRβ expression significantly decreased hepatic gluconeogenesis at 45 min, 60 min, and 90 min after pyruvate injection in the wild-type livers compared to the wild-type controls (n = 6; P < 0.05). (B) RT-PCR analysis of PEPCK from mouse livers. hGRβ expression significantly downregulated PEPCK gene expression in wild-type livers compared to wild-type controls (n = 6; P < 0.05). The error bars indicate standard errors of the means.
Based on these findings, we investigated the molecular basis for hGRβ attenuation of hepatic gluconeogenesis. The rate of hepatic glucose production is tightly controlled by the key enzyme PEPCK. Glucocorticoid activity through GRα is well known to stimulate gluconeogenesis by directly upregulating PEPCK (21). qRT-PCR showed that AAV-hGRβ injection significantly downregulated PEPCK gene expression. As expected, PEPCK also decreased in liver samples from ADX animals (Fig. 5B).
Distinct canonical pathways regulated by hGRβ in WT liver.
Further IPA analysis of the 1,916 hGRβ-regulated genes identified the most significantly affected canonical pathways after AAV-hGRβ gene transfer in liver. The significantly regulated pathways were ranked based on the q value and gene ratio. The highest-ranked pathways are summarized; they included communication between innate and adaptive immune cells, granulocyte adhesion and diapedesis, the role of pattern receptors in recognition of bacteria and viruses, interferon (IFN) signaling, and cross talk between dendritic cells and natural killer cells (Table 1). The association of these canonical pathways with innate and adaptive immunity suggests that glucocorticoid-regulated immune signaling in mouse liver was significantly affected by hGRβ expression.
TABLE 1.
Identification of top canonical pathways of hGRβ-regulated liver genes in mice
| Mice and rank | Canonical pathway | q valuea | Ratio (%) |
|---|---|---|---|
| C57BL/6 | |||
| 1 | Communication between innate and adaptive immune cells | 4.85E−3 | 20/89 (22.5) |
| 2 | Granulocyte adhesion and diapedesis | 1.27E−2 | 29/177 (16.4) |
| 3 | Role of pattern recognition receptors in recognition of bacteria and viruses | 1.27E−2 | 23/126 (18.3) |
| 4 | Interferon signaling | 3.26E−2 | 10/36 (27.8) |
| 5 | Cross talk between dendritic cells and natural killer cells | 3.60E−2 | 17/89 (19.1) |
| GRLKO | |||
| 1 | Interferon signaling | 4.15E−6 | 15/36 (41.7) |
| 2 | Activation of interferon regulatory factor (IRF) by cytosolic pattern recognition receptors | 1.62E−3 | 16/63 (25.4) |
| 3 | Death receptor signaling | 1.05E−2 | 18/92 (19.6) |
| 4 | Role of pattern recognition receptors in recognition of bacteria and viruses | 1.05E−2 | 22/126 (17.5) |
| 5 | Mitotic roles of polo-like kinase | 1.97E−2 | 14/66 (21.2) |
q value, Benjamini-Hochberg multiple-testing adjusted P value.
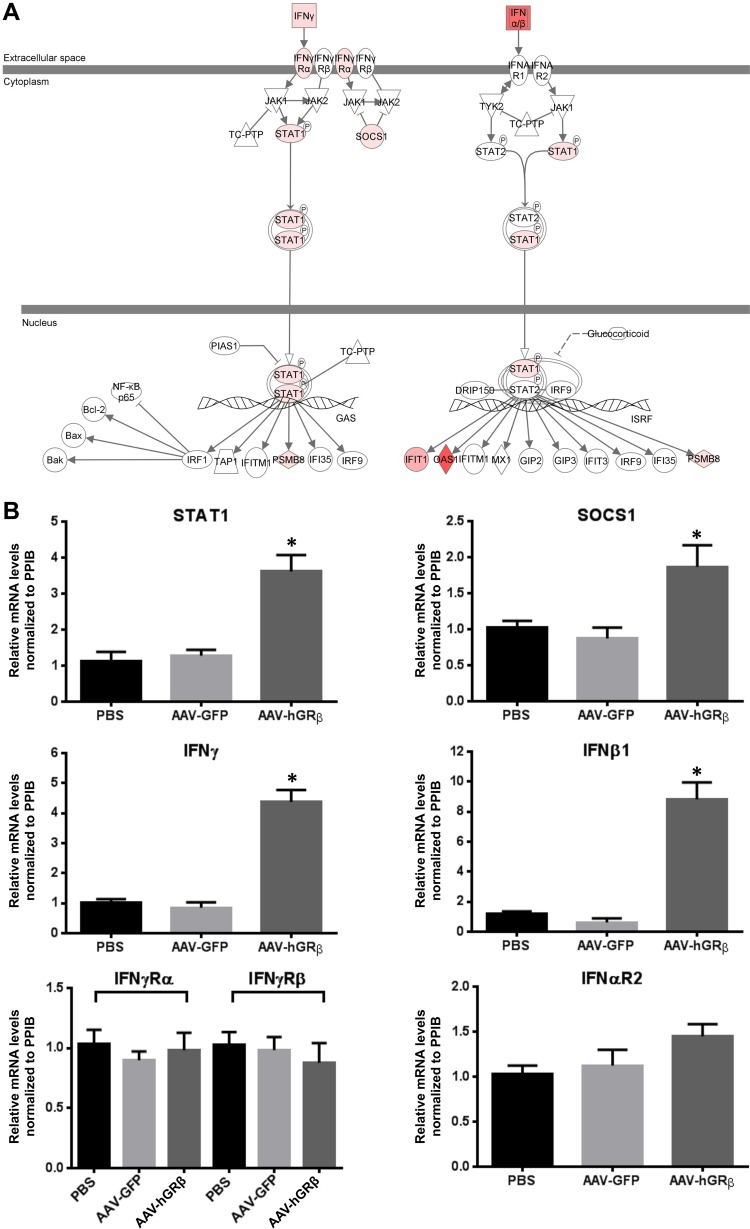
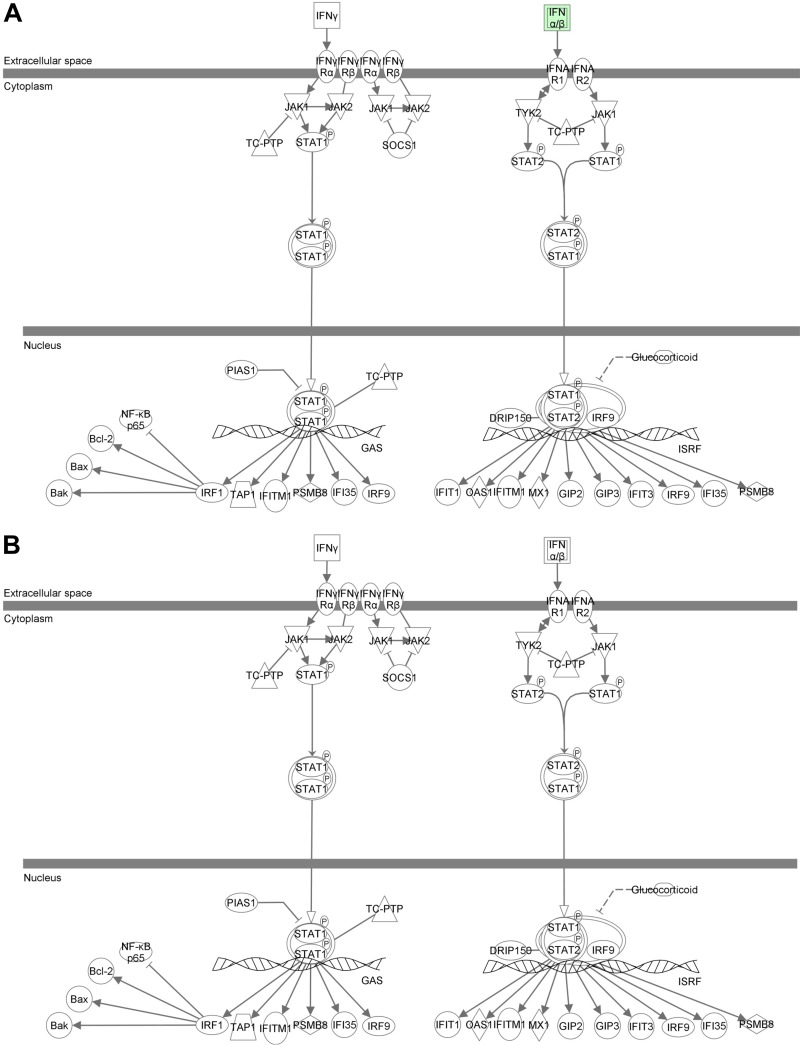
The IFN signaling pathway is a well-known target for glucocorticoid inhibition, and previous studies showed that glucocorticoids inhibit type I and type II IFN signaling, which contributes to the immunosuppressive action of glucocorticoids. Specifically, glucocorticoids inhibit type I and II IFN-induced STAT1 expression and activation in macrophages at physiological concentrations (22, 23). Thus, we overlaid the hGRβ-specifically regulated genes on the interferon signaling pathway and found that IFN-α/β, IFN-γ, STAT1, suppressor of cytokine signaling 1 (SOCS1), and some interferon-stimulated genes (ISG) were upregulated in liver expressing hGRβ (Fig. 6A). In order to determine if the AAV backbone alone had any effect on interferon activation, we also overlaid the AAV-GFP data set on the IFN signaling pathway and found no changes in gene expression, except that IFN-α/β expression was downregulated (Fig. 7A), suggesting the AAV backbone (AAV-GFP) alone did not activate the interferon signaling pathway. We thus used qRT-PCR to validate gene alterations detected by microarray. In agreement with microarray analysis, the relative levels of IFN-β1, IFN-γ, STAT1, and SOCS1 mRNAs were all significantly increased in AAV-hGRβ-injected liver compared to AAV-GFP-injected liver, while the mRNA levels of IFN receptors (IFN-γR1, IFN-γR2, and IFN-αR2) remained unchanged (Fig. 6B). These data demonstrate that hGRβ expression in hepatocytes upregulates type I and II IFN and STAT1 gene expression in mouse liver, implying a proinflammatory function. The increased expression of SOCS1, which functions in a negative-feedback loop to repress inflammatory responses, including STAT activation (24), is likely a secondary response to the increased proinflammatory signaling after hGRβ expression.
FIG 6.
(A) Upregulation of type I and II IFN, STAT1, and SOCS1 gene expression in wild-type mouse liver expressing hGRβ. The total liver RNA extracted from each group was applied to an Agilent whole-mouse one-color array and used for RT-PCR. The interferon signaling pathway was changed after AAV-hGRβ injection. Gene sets in hGRβ-injected liver were overlaid on the interferon signaling pathway. Interferon, STAT1, SOCS1, and some interferon-stimulated genes were upregulated. Red represents upregulated genes. (B) RT-PCR confirmed the upregulation of genes shown in panel A. Relative RNA values were normalized to PPIB. STAT1, SOCS1, IFN-β1, and IFN-γ and were significantly increased in the AAV-hGRβ-treated group compared to the control group. No significant change was found in IFN-γRα, IFN-γRβ, and IFN-αR2 (*, P < 0.05). The error bars indicate standard errors of the means.
FIG 7.
AAV backbone alone has no effect on interferon activation. Total liver RNA isolated from each group of injected mice was applied to an Agilent whole-mouse one-color array. Data sets of AAV-GFP/PBS from C57BL/6 (A) and GRLKO (B) mice were overlaid on the IFN signaling pathway in IPA.
Does hGRβ regulate gene expression in both GRα-dependent and -independent manners?
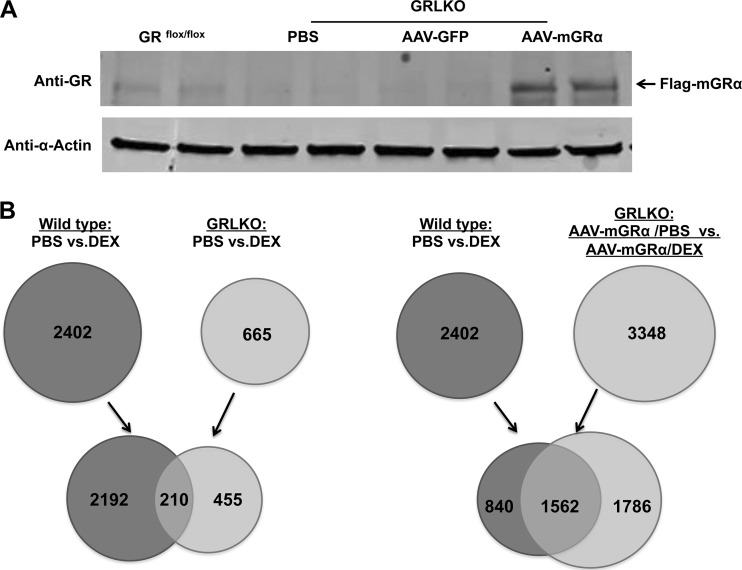
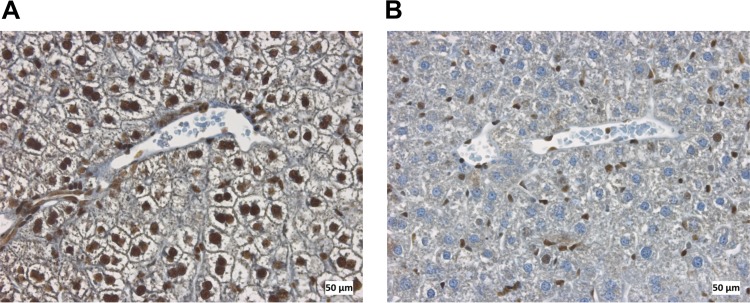
The ability of hGRβ to regulate gene expression has largely been attributed to its antagonism of hGRα (25). However, a recent in vitro study from our laboratory has shown that hGRβ also has intrinsic and GRα-independent transcription activity in the context of a cell culture model system (11). Thus, our next goal was to determine the mechanisms by which hGRβ regulates gene expression in vivo. For the experiments, we intravenously injected AAV-hAAT-Flag-mGRα or AAV-hAAT-Flag-hGRβ, or AAV-hAAT-Flag-GFP as a vector control, into 2-month-old GRLKO mice. Expression of mGRα in the livers of GRLKO mice was achieved 1 month after AAV injection (Fig. 8A). GRLKO mice showed only minimal expression of endogenous GRα, which likely reflects its expression from cells other than hepatocytes in liver, such as immune cells (Fig. 9). Both WT and mGRα-injected GRLKO mice were treated for 6 h with the synthetic glucocorticoid dexamethasone (DEX). Microarray analysis revealed that a majority of DEX-responsive genes (2,192/2,402) in WT mice are regulated by GRα (Fig. 8B, left), and reinstallation of mGRα in the GRLKO mice recovered more than 65% (1,562/2,402) of DEX-responsive genes seen in WT mice (Fig. 8B, right). Given the diversity of cell types in the liver, these findings suggest that we achieved a significant rescue of function in the livers of GRLKO mice (Fig. 8B, right).
FIG 8.
mGRα reinstallation in livers of GRLKO mice. (A) Two-month-old GRLKO mice were injected with PBS (n = 8), AAV-GFP (n = 8), and AAV-mGRα (n = 8). A liver Western blot with anti-GR antibody (D8H2), which recognizes both GRα and GRβ, showed that AAV-mGRα gene transfer was achieved in GRLKO mouse liver 1 month after injection. Liver samples collected from each treatment group were compared side by side. (B) Determination of endogenous GRα-regulated genes (left) and comparison of AAV-GR-regulated genes and endogenous GRα-regulated genes (right) in mouse liver. Total RNA was isolated from each group of wild-type and GRLKO mice treated with DEX or vehicle and applied to an Agilent whole-mouse one-color array. The Venn diagram on the left shows 2,192 endogenous GRα-regulated genes, and the Venn diagram on the right shows that 65% (1,562/2,402) of endogenous GRα-regulated genes overlap exogenous mGRα-regulated genes.
FIG 9.
Immunohistochemical staining of glucocorticoid receptor in mouse liver sections counterstained with hematoxylin. Glucocorticoid receptor was found in hepatocytes in wild-type mice (A) but not in hepatocytes in GR liver-specific knockout mice (B).
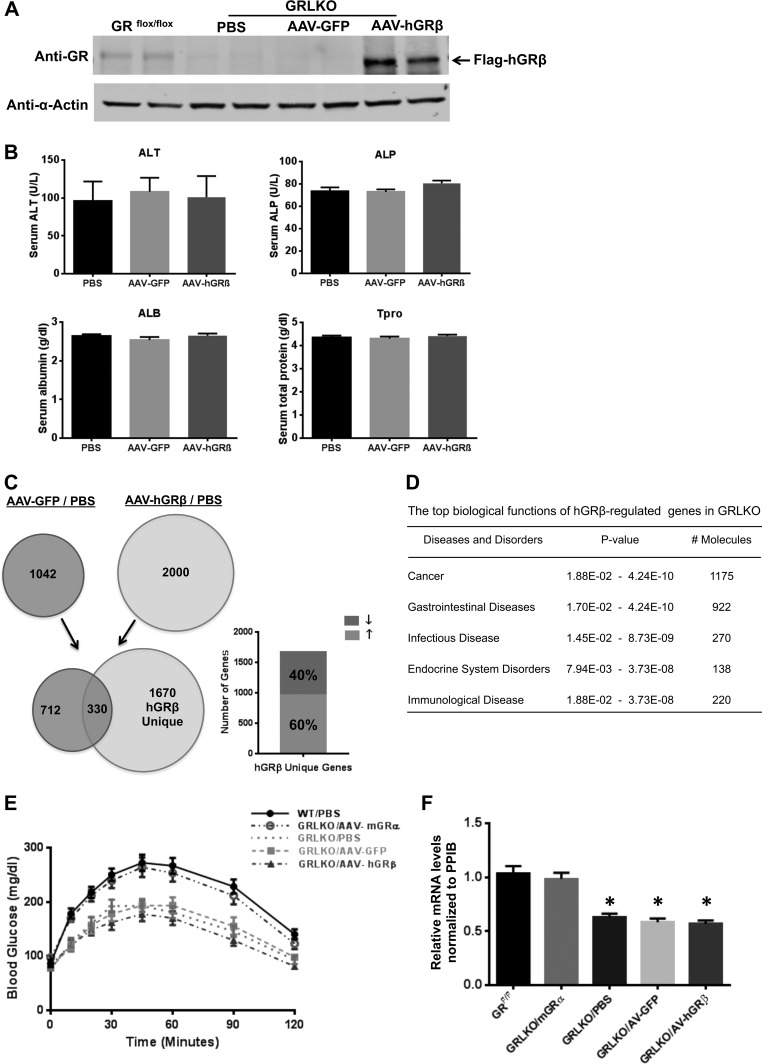
Our next objective was to express hGRβ in the livers of GRLKO mice. Expression of hGRβ was detected in the hGRβ-infected GRLKO liver 1 month after injection but not in the livers of the AAV-GFP vector control group and the PBS control group (Fig. 10 A). Blood chemistry for liver function showed no significant difference in the AAV-hGRβ-treated group compared to control groups (Fig. 10B). We again used a whole-genome microarray approach to evaluate the gene regulation profile of hGRβ in GRLKO mouse liver. Microarray analysis identified 1,670 genes specifically regulated by the expression of hGRβ in the livers of GRLKO mice, about 60% of which were upregulated (Fig. 10C). IPA analysis predicted the functional relevance of these hGRβ-specifically regulated genes in GRLKO mice. hGRβ-regulated genes were most significantly associated with cancer, gastrointestinal diseases, infectious diseases, endocrine system disorders, and immunological disease (Fig. 10D).
FIG 10.
hGRβ gene regulation profile in GRLKO mice. Two-month-old GRLKO mice were injected with PBS (n = 8), AAV-GFP (n = 8), and AAV-hGRβ (n = 8). (A) Western blotting of the indicated liver samples was performed 1 month after injection with anti-GR antibody (D8H2), which recognizes both GRα and GRβ. Liver samples collected from each treatment group were compared side by side. (B) Serum ALT, ALP, ALB, and Tpro were tested for different groups of GRLKO mice. No significant difference was found among the groups for each test. (C) Total RNA isolated from each group of GRLKO mice 1 month after injection was applied to an Agilent whole-mouse one-color array. Shown are Venn diagrams of AAV-GFP-regulated genes (left) and AAV-hGRβ-regulated genes (right). The common part (330 genes) indicates AAV backbone effect. The unique part (1,670 genes) of AAV-hGRβ represents hGRβ-regulated genes in GRLKO mice, about 60% of which are upregulated. (D) Ingenuity pathway analysis predicted the top biological functions of hGRβ-regulated genes in GRLKO. (E) Blood glucose profiles of PTTs in GRLKO mice. Two months after AAV injection, blood glucose levels were determined after 18 h of fasting. hGRβ expression did not significantly affect hepatic gluconeogenesis compared to other GRLKO controls (n = 6). (F) RT-PCR analysis of PEPCK from GRLKO livers. hGRβ expression does not significantly change PEPCK gene expression in GRLKO livers compared to other GRLKO controls (n = 6; P < 0.05). The error bars indicate standard errors of the means.
Pyruvate tolerance tests on GRLKO mice demonstrated that reinstallation of mGRα in liver by AAV rescued hepatic gluconeogenesis. In contrast to our findings in hGRβ-injected WT mice (Fig. 5A), hGRβ had no effect on hepatic glucose production in GRLKO mice (Fig. 10E). These data suggest that hGRβ may interfere with hepatic glucose production only in the presence of GRα and not in its absence. The GRLKO mice also had decreased PEPCK expression, and AAV-mGRα injection rescued this phenotype, further delineating a critical role of GRα in regulating the expression of the gene. In contrast, AAV-hGRβ injection had no effect on PEPCK expression in the absence of endogenous mGRα (Fig. 10F). Taken together, our findings in WT and GRLKO mice indicated that hGRβ decreases PEPCK expression and attenuates hepatic gluconeogenesis in a GRα-dependent manner.
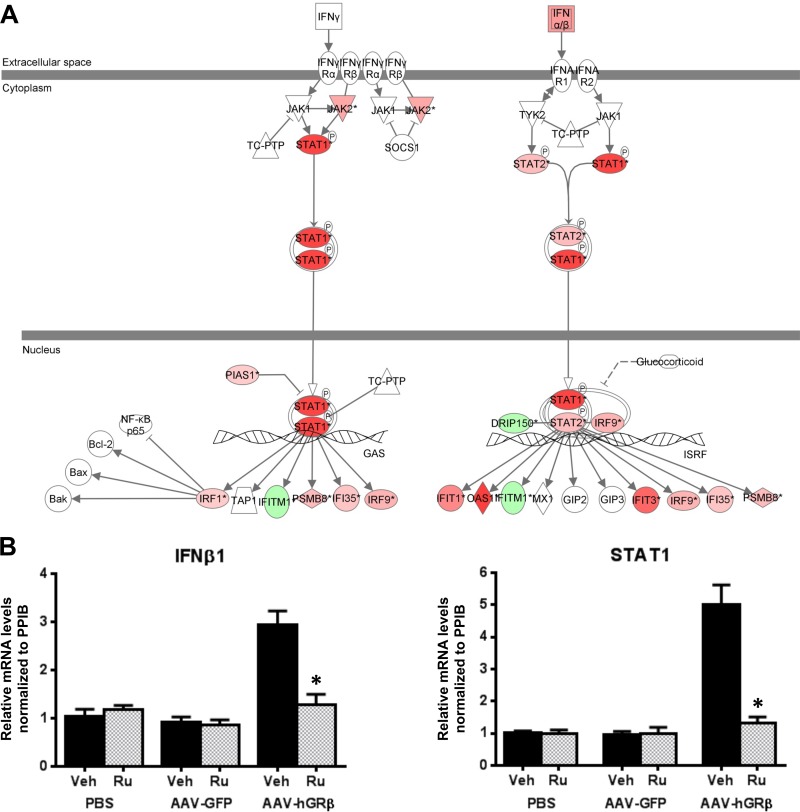
Interestingly, immunological disease was revealed in hGRβ-expressing livers in both GRLKO mice (Fig. 10D) and WT mice (Fig. 4B), and IFN signaling was also one of the highest-ranked canonical pathways significantly affected by hGRβ in both GRLKO and WT livers (Table 1). Thus, we overlaid the genes specifically regulated by hGRβ in the GRLKO mice on the IFN signaling pathway and found that IFN-α/β and STAT1 were also upregulated in the GRα-deficient liver expressing hGRβ (Fig. 11A). The AAV backbone (AAV-GFP) alone did not activate the IFN signaling pathway in GRLKO mouse liver (Fig. 7B). Validation by RT-PCR showed that the relative mRNA levels of IFN-β1 and STAT1 were significantly increased in AAV-hGRβ-injected liver compared to AAV-GFP-injected liver in GRLKO mice (Fig. 11B). This effect is very similar to the response to hGRβ expression in the livers of wild-type mice. These findings indicate that hGRβ regulation of STAT1 gene expression is GRα independent. Previously, we have shown that RU486 has an antagonistic effect on hGRβ-mediated gene regulation in vitro (11). Therefore, we next treated the injected GRLKO mice with RU486. The upregulation of STAT1 by hGRβ was blocked, suggesting RU486 can specifically regulate the transcriptional activity of hGRβ in vivo (Fig. 11B). In summary, hGRβ regulates gene expression in the mouse liver in both GRα-dependent and -independent fashions.
FIG 11.
The interferon signaling pathway was altered after hGRβ expression in GRLKO liver. Two-month-old GRLKO mice were injected with PBS (n = 8), AAV-GFP (n = 8), and AAV-hGRβ (n = 8). The total RNA isolated from each group of GRLKO mice 1 month after injection was applied to an Agilent whole-mouse one-color array. (A) IFN-α/β, STAT1, and STAT2 were increased in the IFN signaling pathway after AAV-hGRβ injection. Red and green represent upregulated and downregulated genes, respectively. (B) Prior to sacrifice, the mice in each group were treated with either RU486 (n = 4) or vehicle (n = 4) overnight. Liver RNA was extracted for RT-PCR. Relative RNA values were normalized to PPIB. IFN-β1 and STAT1 were significantly increased in the AAV-hGRβ-treated group compared to the control group, but these effects were blocked by RU486 treatment. *, P < 0.05. The error bars indicate standard errors of the means.
hGRβ regulates STAT1 gene expression by binding to intergenic GRE.
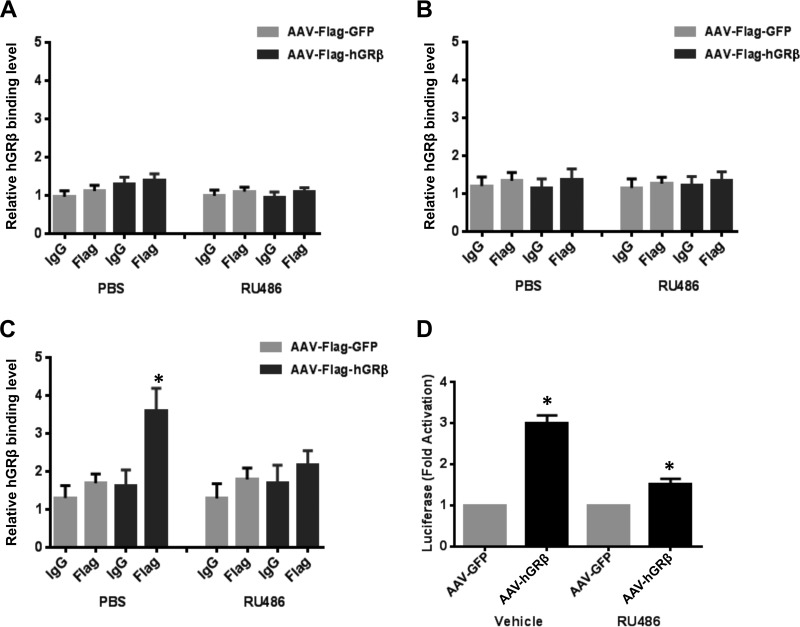
Glucocorticoid receptor regulates the transcription of many target genes by directly binding to the specific sequences of DNA known as GREs (26). In order to define the molecular mechanisms underlying the upregulation of STAT1 by hGRβ in the liver, we performed liver tissue ChIP assays to investigate whether hGRβ was recruited to the GRE of STAT1 in its native chromatin context. In silico analysis of the STAT1 gene and its adjacent sequences identified three putative GREs that showed high homology to the consensus GRE and were conserved across species: a promoter GRE (2,665 bp upstream of exon 1), an intron 22 GRE (24 bp upstream of exon 23), and an intergenic GRE (3,923 bp downstream of terminal exon 25). No significant enrichment of hGRβ was found at the promoter GRE or intron 22 GRE compared to the controls in the GRLKO liver (Fig. 12A and B). However, hGRβ was significantly recruited to the intergenic GRE located downstream of the STAT1 gene in the AAV-Flag-hGRβ-injected liver compared to the AAV-Flag-GFP-injected liver (Fig. 12C). Moreover, this binding was inhibited after RU486 treatment (Fig. 12C). These findings were consistent with our finding that the upregulation of STAT1 by hGRβ was reversed by RU486 in the livers of GRLKO mice.
FIG 12.
Recruitment of hGRβ to a conserved and functional GRE of the STAT1 gene. Two-month-old GRLKO mice were injected with PBS (n = 8), AAV-GFP (n = 8), or AAV-hGRβ (n = 8). Prior to sacrifice, the mice of each group were treated with either RU486 (n = 4) or PBS (n = 4) overnight. ChIP assays with 0.2 g liver tissue were performed with equivalent amounts of IgG and anti-Flag antibodies. (A to C) Coimmunoprecipitated DNA was analyzed by quantitative PCR using primers to a promoter GRE of STAT1 (A), an intron-22 GRE of STAT1 (B), and an intergenic GRE of STAT1 (C). The results are plotted as a function of input DNA. The error bars represent standard errors of the means for three independent experiments. *, P < 0.05; n = 4. (D) Luciferase reporter assays were performed in Cos-1 cells transfected with the reporter plasmid containing the putative GRE and AAV-hGRβ or AAV-GFP plasmid as a control. hGRβ binding to the intergenic GRE of the STAT1 gene significantly induced luciferase expression, but this activity was partially reversed by treatment of the cells with RU486 (1 μM).
To determine if the intergenic GRE identified downstream of the STAT1 gene functioned as an hGRβ-dependent enhancer in a heterologous system, we cloned an ∼700-bp fragment containing the intergenic GRE into a luciferase reporter plasmid, pGL4.23. Cos-1 cells were transfected with the reporter plasmid and AAV-hGRβ or AAV-GFP plasmid as a control, and luciferase activity was measured after treatment with vehicle or RU486. hGRβ expression significantly stimulated luciferase expression, 3 times higher than the GFP control. This activity was partially reversed by the treatment of cells with RU486 (Fig. 12D). Collectively, our results demonstrated that hGRβ binds to the intergenic GRE of STAT1 and induces its gene transcription in the livers of GRLKO mice.
Comparison of hGRβ-regulated genes in wild-type and GRLKO mice.
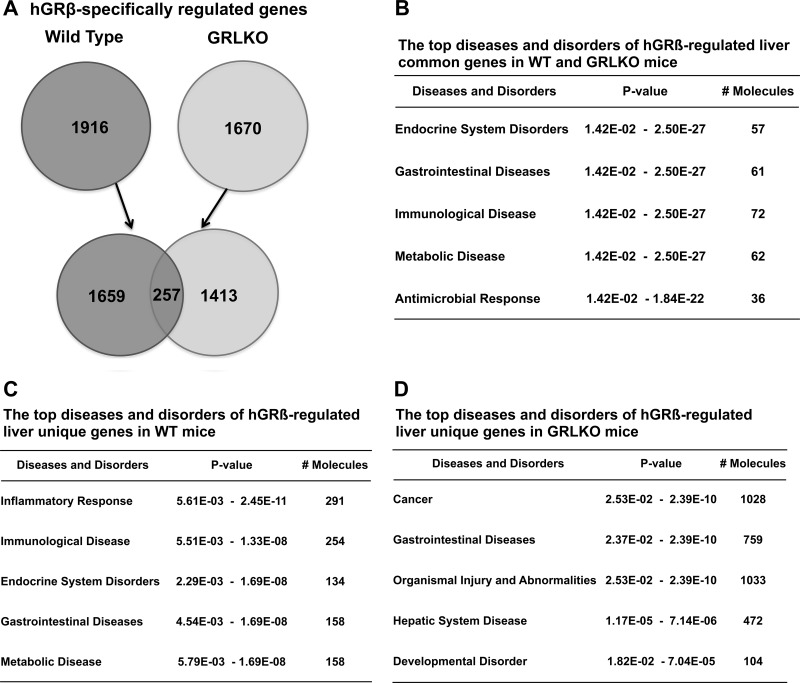
Finally, in order to understand the extent of GRα-dependent and GRα-independent transcriptional regulation by hGRβ in liver, we compared hGRβ-specifically regulated genes in wild-type mice (1,916) and GRLKO mice (1,670). We found there are 257 common genes, including the STAT1 gene, which likely accounts for the intrinsic gene-transcriptional activity of hGRβ (Fig. 13A). These common genes were most significantly associated with endocrine system disorders, gastrointestinal diseases, immunological disease, metabolic diseases, and antimicrobial response (Fig. 13B). The majority of the hGRβ-regulated genes in WT mice (1,659) depend on the presence of mGRα and are associated with diseases and disorders similar to those observed for the common genes (Fig. 13B and C). Unexpectedly, many of the hGRβ-regulated genes in the GRLKO mice (1,413) depend on the loss of mGRα, suggesting hGRβ gains the ability to regulate many genes when mGRα expression is deficient. The annotations most significantly associated with this set of unique genes showed almost no overlap with the unique genes regulated by hGRβ in WT mice, indicating the genes are involved in distinct biological functions (Fig. 13C and D and Table 2).
FIG 13.
Comparison of hGRβ-specifically regulated genes in the livers of wild-type and GRLKO mice. Two-month-old wild-type and GRLKO mice were injected with PBS (n = 8), AAV-GFP (n = 8), and AAV-hGRβ (n = 8). The total RNA isolated from each group 1 month after injection was applied to an Agilent whole-mouse one-color array. (A) Venn diagrams of hGRβ-specifically regulated genes in wild-type and GRLKO mice. Only 257 genes overlapped. The unique hGRβ-regulated genes in wild-type and GRLKO mice numbered 1,659 and 1,413, respectively. (B) Ingenuity pathway analysis predicted the top diseases and disorders of hGRβ-regulated common genes (257). (C) Ingenuity pathway analysis predicted the top diseases and disorders of hGRβ-regulated unique genes in wild-type mice (1,659). (D) Ingenuity pathway analysis predicted the top diseases and disorders of hGRβ-regulated unique genes in GRLKO mice (1,413).
TABLE 2.
Diseases and functions of hGRβ-regulated unique genes in wild-type and GRLKO mice
| Rank | Disease or function |
|
|---|---|---|
| Wild-type mice | GRLKO mice | |
| 1 | Cellular function and maintenance | Cancer |
| 2 | Cell-to-cell signaling and interaction | Gastrointestinal disease |
| 3 | Inflammatory response | Cell cycle |
| 4 | Hematological system development | Infectious disease |
| 5 | Tissue morphology | Gene expression |
| 6 | Cell death and survival | Organismal survival |
| 7 | Endocrine system disorders | Embryonic development |
DISCUSSION
In contrast to the classic and well-studied GRα, the physiology and pathophysiology of the splice variant hGRβ has been studied only in vitro. Based on results from in vitro studies, the dominant-negative effect of GRβ on GRα-induced transcription activity has prevailed in the field for many years, suggesting that alterations in the expression level of the splice variant may regulate cellular sensitivity to glucocorticoids (25). Indeed, in vitro studies have indicated that changes in the ratio of cellular GRα to GRβ contribute to glucocorticoid resistance. Additionally, some patients with glucocorticoid-resistant forms of asthma, leukemia, and other diseases present with elevated levels of hGRβ (7), and polymorphisms in hGRβ that lead to its overexpression have strong associations with human inflammatory diseases (9, 10). Recently, by using microarray techniques, genome-wide expression analyses were conducted in cultured HeLa, Cos-1, and U-2 OS cells overexpressing yellow fluorescent protein (YFP)-hGRβ or GFP-hGRβ fusion protein. hGRβ positively or negatively regulated the expression of a large number of genes, the majority of which were distinct from genes modulated by GRα. These in vitro results suggested that GRβ can have intrinsic gene-specific transcription activities in a GRα-independent fashion (6, 11). However, a limitation of these studies is the fact that the fluorescent protein is relatively large and may affect the hGRβ spatial structure and biological function. In addition, although expression profiling of cultured cells is informative, it cannot capture the complex cross talk between cells and functional links between organs in vivo. In order to elucidate the molecular mechanism and physiological role of hGRβ action, development of a mouse model expressing hGRβ is urgently needed.
Viral gene vectors are commonly used to deliver exogenous genetic materials into cells or tissues for the purpose of either transient or permanent transgene expression. Among various vector systems used to date, vectors based on AAV were chosen in our study for specific hGRβ gene transfer in mouse liver because AAV vector is generally considered to be nonpathogenic, transduces both dividing and nondividing cells, and confers long-term and stable gene transfer in vivo without integrating into the chromosome. Moreover, in contrast to other viral systems, such as adenoviral and retroviral vectors, the AAV vector has demonstrated successful gene transfer in hepatocytes without inducing immunological complications in a mouse model. Extensive studies have demonstrated liver immune tolerance of both AAV-encoded transgene products and AAV capsids (27).
As a metabolic and immunological organ, the liver is a classical target for glucocorticoids. In order to evaluate hGRβ's physiological role in liver, we designed and produced AAV9 carrying a Flag-tagged hGRβ expression cassette under the transcriptional control of the hepatocyte-specific hAAT promoter. We intravenously injected AAV9-hAAT-Flag-hGRβ into 2-month-old mice and created an hGRβ expression mouse model. Consistent with the canonical view, hGRβ appeared to reside predominantly in the hepatocyte nuclei of the injected mice. Furthermore, blood chemistry and histology evidence showed normal liver function after AAV-hGRβ injection. Our previous studies demonstrated that proinflammatory cytokines led to increased hGRβ expression and that hGRβ can even become the predominant GR isoform in cells during inflammation (8). Thus, our hGRβ mouse model is an important tool for studying the function of hGRβ in the liver.
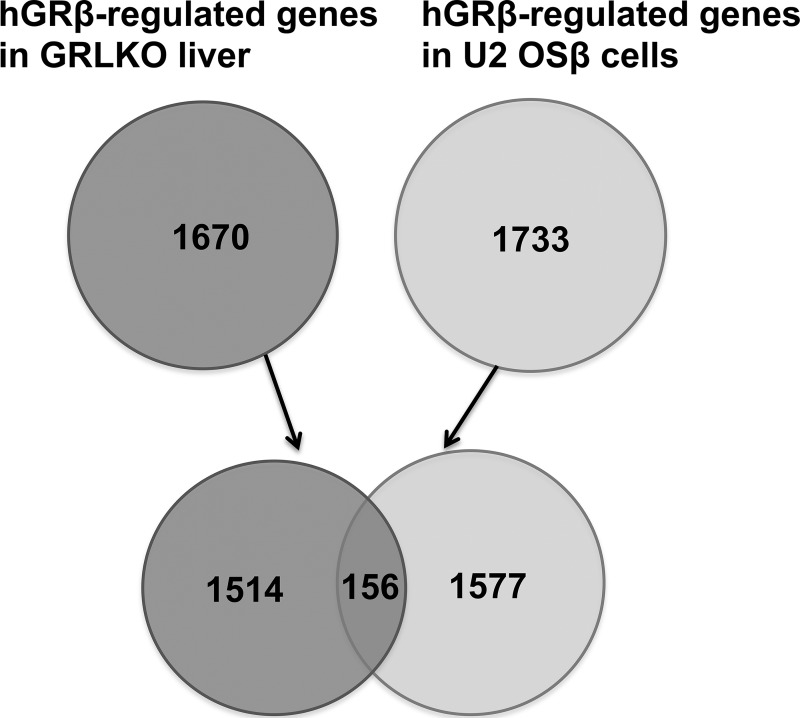
In vitro studies demonstrated that hGRβ functions as a dominant-negative inhibitor and antagonizes the activity of GRα on many glucocorticoid-responsive target genes (28, 29). Mechanisms proposed to explain this GRβ function include competition for GRE binding through their shared DBD, formation of inactive GRα/GRβ heterodimers, and competition for transcriptional coregulators to form a transcription complex in the promoter region (30). Our microarray analysis of liver RNA from the injected WT mice showed that about 90% of hGRβ-regulated genes were upregulated. Many of these regulated genes were significantly associated with endocrine system disorders, gastrointestinal disease, immunological disease, metabolic diseases, and inflammatory response, most of which are classical functions of GRα. Compared to the hGRβ-regulated genes (1,733) previously observed in U2 OSβ cells in our in vitro study, we found about 10% of the genes in common (Fig. 14), which likely reflects the different gene regulation profiles of hGRβ between mouse liver and a cultured transformed human bone cell line.
FIG 14.
Comparison of hGRβ-regulated genes in GRLKO liver and U2 OSβ cells published previously. The total RNAs isolated from AAV-hGRβ-injected GRLKO liver and that from U2 OSβ cells were applied to an Agilent whole-mouse one-color array and a whole-human one-color array, respectively. Shown are Venn diagrams of AAV-hGRβ-regulated genes in GRLKO liver (left) and hGRβ-regulated genes in U2 OSβ cells (right). Only 156 genes overlap.
In addition, in the GRLKO mouse, hGRβ-regulated genes were also significantly associated with endocrine system disorders. The involvement of GR in liver glucose metabolism has been established for a long time. In particular, hepatic gluconeogenesis is essential for maintenance of blood glucose levels in a normal range after prolonged fasting (31). We found that hGRβ overexpression in the livers of WT mice significantly decreased hepatic gluconeogenesis, while hGRβ did not have this effect in the livers of GRLKO mice. PEPCK, the rate-limiting gluconeogenesis enzyme, was significantly decreased in the hGRβ-injected WT mice, but not in the hGRβ-injected GRLKO mice. These data suggest hGRβ attenuated hepatic gluconeogenesis through downregulation of PEPCK. Importantly, in our hGRβ C57BL/6 mouse model, the endogenous mGRα expression remained unchanged compared to AAV-GFP and PBS control groups. These findings suggested that the dominant-negative effect of hGRβ on endogenous mGRα-induced transcriptional activity is likely to be the mechanism underlying the alteration of hepatic gluconeogenesis.
In vitro studies using microarray techniques showed that hGRβ directly induces and represses the expression of many genes independently of its dominant-negative activity on GRα (6, 11). hGRβ may interact with other transcriptional cofactors and transcriptional factors in the nuclear receptor network. Alternatively, hGRβ may directly modulate the transcriptional activities of its responsive genes by binding to specific response elements in the promoter region of these genes (4). To investigate the gene regulation profile of hGRβ, we applied the same AAV-mediated gene transfer approach in GRLKO mice. These knockout mice are largely devoid not only of mGRα but also of a recently described version of mouse GRβ (mGRβ) (32). Importantly, reinstallation of mGRα by AAV in the GRLKO mouse livers rescued more than 65% of DEX-responsive genes in WT mice, as well as hepatic gluconeogenesis. AAV-hGRβ-injected GRLKO mice and AAV-hGRβ-injected C57BL/6 WT mice shared the immunological diseases and infectious disease or inflammatory response as the top diseases and disorders, as reflected by the upregulation of STAT1 and IFN-α/β in both mouse models after hGRβ expression. Furthermore, canonical pathway analysis identified the interferon signaling pathway as one of the most significantly regulated pathways in both WT and GRLKO mice injected with AAV-hGRβ. These results indicated that hGRβ directly induces and represses gene expression in a GRα-independent fashion. Therefore, the intrinsic transcription activity of hGRβ could be another mechanism underlying the phenotypes observed in the hGRβ-expressing liver. Interestingly, hGRβ alone regulates many unique genes (1,413) in the absence of GRα (Fig. 13 and Table 2).
We also discovered upregulation of key molecules in the interferon signaling pathway after hGRβ expression in both GRLKO and WT mice, such as type I and II interferon, STAT1, and SOCS1. Our RT-PCR results confirmed that IFN and STAT1 expression was significantly increased in AAV-hGRβ-injected mouse liver compared to that in AAV-GFP-injected mouse liver. Recent studies demonstrated that AAV infection of purified hepatic Kupffer cells in vitro failed to produce significant levels of type I IFN and interleukin 6 (IL-6), in contrast to infection with adenovirus (33), and that gene expression of STAT1 and SOCS1 remained unchanged in AAV-injected mouse liver compared to the control (34). These findings support our data showing that upregulation of interferon by hGRβ is not due to AAV infection of other immune cells in the liver. Previous studies showed that glucocorticoids inhibit type I and type II interferon signaling by regulating STAT1 expression (22, 23). Our current work provides the first evidence in vivo that hGRβ may attenuate GRα-mediated anti-inflammatory action by upregulation of many cytokines and STAT1. Interestingly, in the GRLKO mice, significant enrichment of hGRβ was found in the intergenic GRE adjacent to the STAT1 gene in the AAV-Flag-hGRβ-injected liver compared to the controls. These data indicated that hGRβ directly regulates the expression of STAT1, a key proinflammatory signal in liver inflammation, at the transcriptional level. Furthermore, in our GRLKO mouse model expressing hGRβ, upregulation of STAT1 by hGRβ was blocked after injection of the glucocorticoid receptor antagonist RU486, suggesting RU486 antagonized hGRβ-mediated gene regulation.
Our studies have demonstrated that hGRβ possesses both GRα-dependent and GRα-independent mechanisms of gene regulation. In animals harboring wild-type glucocorticoid receptor in liver, hGRβ antagonized GRα's function and attenuated hepatic gluconeogenesis through downregulation of PEPCK. Surprisingly, in animals with decreased levels of endogenous GRα in the liver, we observed that hGRβ gained the ability to regulate a large cohort of genes. These findings suggest that GRα and GRβ can regulate each other via the formation of heterodimers and/or competition for GRE binding. A greater understanding of the mechanism underlying hGRβ transcriptional activity of its responsive genes is necessary to elucidate the exact role of hGRβ in glucocorticoid resistance. This will be of particular interest to people with elevated levels of GRβ due to a polymorphism, A3669G, in the GR gene (35) or cytokine stimulus (8). RU486 could be a potential regimen to reverse the undesirable inflammatory effects of hGRβ seen in A3669G carriers.
ACKNOWLEDGMENTS
We thank Kevin Gerrish and Laura Wharey of the NIEHS Microarray Core for their help with the microarray data and analysis. We also thank Jeff Tucker in the Fluorescence Microscopy and Imaging Center and Carl Bortner in the Flow Cytometry Center for their technical assistance. We thank Xiaojiang Xu for statistical support.
This research was supported by the Intramural Research Program of the NIH National Institute of Environmental Health Sciences.
We declare no conflicts of interest.
REFERENCES
- 1.Lu NZ, Cidlowski JA. 2005. Translational regulatory mechanisms generate N-terminal glucocorticoid receptor isoforms with unique transcriptional target genes. Mol Cell 18:331–342. doi: 10.1016/j.molcel.2005.03.025. [DOI] [PubMed] [Google Scholar]
- 2.Oakley RH, Cidlowski JA. 2011. Cellular processing of the glucocorticoid receptor gene and protein: new mechanisms for generating tissue-specific actions of glucocorticoids. J Biol Chem 286:3177–3184. doi: 10.1074/jbc.R110.179325. [DOI] [PMC free article] [PubMed] [Google Scholar]
- 3.Hollenberg SM, Weinberger C, Ong ES, Cerelli G, Oro A, Lebo R, Thompson EB, Rosenfeld MG, Evans RM. 1985. Primary structure and expression of a functional human glucocorticoid receptor cDNA. Nature 318:635–641. doi: 10.1038/318635a0. [DOI] [PMC free article] [PubMed] [Google Scholar]
- 4.Kino T, Su YA, Chrousos GP. 2009. Human glucocorticoid receptor isoform beta: recent understanding of its potential implications in physiology and pathophysiology. Cell Mol Life Sci 66:3435–3448. doi: 10.1007/s00018-009-0098-z. [DOI] [PMC free article] [PubMed] [Google Scholar]
- 5.Oakley RH, Jewell CM, Yudt MR, Bofetiado DM, Cidlowski JA. 1999. The dominant negative activity of the human glucocorticoid receptor beta isoform. Specificity and mechanisms of action. J Biol Chem 274:27857–27866. [DOI] [PubMed] [Google Scholar]
- 6.Kino T, Manoli I, Kelkar S, Wang Y, Su YA, Chrousos GP. 2009. Glucocorticoid receptor (GR) beta has intrinsic, GRalpha-independent transcriptional activity. Biochem Biophys Res Commun 381:671–675. doi: 10.1016/j.bbrc.2009.02.110. [DOI] [PMC free article] [PubMed] [Google Scholar]
- 7.Lewis-Tuffin LJ, Cidlowski JA. 2006. The physiology of human glucocorticoid receptor beta (hGRbeta) and glucocorticoid resistance. Ann N Y Acad Sci 1069:1–9. doi: 10.1196/annals.1351.001. [DOI] [PubMed] [Google Scholar]
- 8.Webster JC, Oakley RH, Jewell CM, Cidlowski JA. 2001. Proinflammatory cytokines regulate human glucocorticoid receptor gene expression and lead to the accumulation of the dominant negative beta isoform: a mechanism for the generation of glucocorticoid resistance. Proc Natl Acad Sci U S A 98:6865–6870. doi: 10.1073/pnas.121455098. [DOI] [PMC free article] [PubMed] [Google Scholar]
- 9.Derijk RH, Schaaf MJ, Turner G, Datson NA, Vreugdenhil E, Cidlowski J, de Kloet ER, Emery P, Sternberg EM, Detera-Wadleigh SD. 2001. A human glucocorticoid receptor gene variant that increases the stability of the glucocorticoid receptor beta-isoform mRNA is associated with rheumatoid arthritis. J Rheumatol 28:2383–2388. [PubMed] [Google Scholar]
- 10.van den Akker EL, Koper JW, van Rossum EF, Dekker MJ, Russcher H, de Jong FH, Uitterlinden AG, Hofman A, Pols HA, Witteman JC, Lamberts SW. 2008. Glucocorticoid receptor gene and risk of cardiovascular disease. Arch Intern Med 168:33–39. doi: 10.1001/archinternmed.2007.41. [DOI] [PubMed] [Google Scholar]
- 11.Lewis-Tuffin LJ, Jewell CM, Bienstock RJ, Collins JB, Cidlowski JA. 2007. Human glucocorticoid receptor beta binds RU-486 and is transcriptionally active. Mol Cell Biol 27:2266–2282. doi: 10.1128/MCB.01439-06. [DOI] [PMC free article] [PubMed] [Google Scholar]
- 12.Xiao X, Li J, Samulski RJ. 1998. Production of high-titer recombinant adeno-associated virus vectors in the absence of helper adenovirus. J Virol 72:2224–2232. [DOI] [PMC free article] [PubMed] [Google Scholar]
- 13.Ayuso E, Mingozzi F, Montane J, Leon X, Anguela XM, Haurigot V, Edmonson SA, Africa L, Zhou S, High KA, Bosch F, Wright JF. 2010. High AAV vector purity results in serotype- and tissue-independent enhancement of transduction efficiency. Gene Ther 17:503–510. doi: 10.1038/gt.2009.157. [DOI] [PubMed] [Google Scholar]
- 14.Oakley RH, Ren R, Cruz-Topete D, Bird GS, Myers PH, Boyle MC, Schneider MD, Willis MS, Cidlowski JA. 2013. Essential role of stress hormone signaling in cardiomyocytes for the prevention of heart disease. Proc Natl Acad Sci U S A 110:17035–17040. doi: 10.1073/pnas.1302546110. [DOI] [PMC free article] [PubMed] [Google Scholar]
- 15.Oakley RH, Webster JC, Sar M, Parker CR Jr, Cidlowski JA. 1997. Expression and subcellular distribution of the beta-isoform of the human glucocorticoid receptor. Endocrinology 138:5028–5038. [DOI] [PubMed] [Google Scholar]
- 16.Yudt MR, Jewell CM, Bienstock RJ, Cidlowski JA. 2003. Molecular origins for the dominant negative function of human glucocorticoid receptor beta. Mol Cell Biol 23:4319–4330. doi: 10.1128/MCB.23.12.4319-4330.2003. [DOI] [PMC free article] [PubMed] [Google Scholar]
- 17.Whirledge S, Xu X, Cidlowski JA. 2013. Global gene expression analysis in human uterine epithelial cells defines new targets of glucocorticoid and estradiol antagonism. Biol Reprod 89:66. doi: 10.1095/biolreprod.113.111054. [DOI] [PMC free article] [PubMed] [Google Scholar]
- 18.Kay MA. 2011. State-of-the-art gene-based therapies: the road ahead. Nat Rev Genet 12:316–328. doi: 10.1038/nrg2971. [DOI] [PubMed] [Google Scholar]
- 19.Mingozzi F, High KA. 2011. Therapeutic in vivo gene transfer for genetic disease using AAV: progress and challenges. Nat Rev Genet 12:341–355. doi: 10.1038/nrg2988. [DOI] [PubMed] [Google Scholar]
- 20.Duma D, Collins JB, Chou JW, Cidlowski JA. 2010. Sexually dimorphic actions of glucocorticoids provide a link to inflammatory diseases with gender differences in prevalence. Sci Signal 3:ra74. doi: 10.1126/scisignal.2001077. [DOI] [PMC free article] [PubMed] [Google Scholar]
- 21.Yabaluri N, Bashyam MD. 2010. Hormonal regulation of gluconeogenic gene transcription in the liver. J Biosci 35:473–484. doi: 10.1007/s12038-010-0052-0. [DOI] [PubMed] [Google Scholar]
- 22.Hu X, Li WP, Meng C, Ivashkiv LB. 2003. Inhibition of IFN-gamma signaling by glucocorticoids. J Immunol 170:4833–4839. doi: 10.4049/jimmunol.170.9.4833. [DOI] [PubMed] [Google Scholar]
- 23.Flammer JR, Dobrovolna J, Kennedy MA, Chinenov Y, Glass CK, Ivashkiv LB, Rogatsky I. 2010. The type I interferon signaling pathway is a target for glucocorticoid inhibition. Mol Cell Biol 30:4564–4574. doi: 10.1128/MCB.00146-10. [DOI] [PMC free article] [PubMed] [Google Scholar]
- 24.Piessevaux J, Lavens D, Peelman F, Tavernier J. 2008. The many faces of the SOCS box. Cytokine Growth Factor Rev 19:371–381. doi: 10.1016/j.cytogfr.2008.08.006. [DOI] [PubMed] [Google Scholar]
- 25.Oakley RH, Cidlowski JA. 2013. The biology of the glucocorticoid receptor: new signaling mechanisms in health and disease. J Allergy Clin Immunol 132:1033–1044. doi: 10.1016/j.jaci.2013.09.007. [DOI] [PMC free article] [PubMed] [Google Scholar]
- 26.So AY, Chaivorapol C, Bolton EC, Li H, Yamamoto KR. 2007. Determinants of cell- and gene-specific transcriptional regulation by the glucocorticoid receptor. PLoS Genet 3:e94. doi: 10.1371/journal.pgen.0030094. [DOI] [PMC free article] [PubMed] [Google Scholar]
- 27.Bessis N, GarciaCozar FJ, Boissier MC. 2004. Immune responses to gene therapy vectors: influence on vector function and effector mechanisms. Gene Ther 11(Suppl 1):S10–S17. doi: 10.1038/sj.gt.3302364. [DOI] [PubMed] [Google Scholar]
- 28.Li LB, Leung DY, Hall CF, Goleva E. 2006. Divergent expression and function of glucocorticoid receptor beta in human monocytes and T cells. J Leukoc Biol 79:818–827. doi: 10.1189/jlb.0805466. [DOI] [PubMed] [Google Scholar]
- 29.Zhang X, Clark AF, Yorio T. 2005. Regulation of glucocorticoid responsiveness in glaucomatous trabecular meshwork cells by glucocorticoid receptor-beta. Invest Ophthalmol Vis Sci 46:4607–4616. doi: 10.1167/iovs.05-0571. [DOI] [PubMed] [Google Scholar]
- 30.Charmandari E, Chrousos GP, Ichijo T, Bhattacharyya N, Vottero A, Souvatzoglou E, Kino T. 2005. The human glucocorticoid receptor (hGR) beta isoform suppresses the transcriptional activity of hGRalpha by interfering with formation of active coactivator complexes. Mol Endocrinol 19:52–64. doi: 10.1210/me.2004-0112. [DOI] [PubMed] [Google Scholar]
- 31.de Guia RM, Rose AJ, Herzig S. 2014. Glucocorticoid hormones and energy homeostasis. Horm Mol Biol Clin Investig 19:117–128. doi: 10.1515/hmbci-2014-0021. [DOI] [PubMed] [Google Scholar]
- 32.Hinds TD Jr, Ramakrishnan S, Cash HA, Stechschulte LA, Heinrich G, Najjar SM, Sanchez ER. 2010. Discovery of glucocorticoid receptor-beta in mice with a role in metabolism. Mol Endocrinol 24:1715–1727. doi: 10.1210/me.2009-0411. [DOI] [PMC free article] [PubMed] [Google Scholar]
- 33.Zhu J, Huang X, Yang Y. 2009. The TLR9-MyD88 pathway is critical for adaptive immune responses to adeno-associated virus gene therapy vectors in mice. J Clin Invest 119:2388–2398. doi: 10.1172/JCI37607. [DOI] [PMC free article] [PubMed] [Google Scholar]
- 34.McCaffrey AP, Fawcett P, Nakai H, McCaffrey RL, Ehrhardt A, Pham TT, Pandey K, Xu H, Feuss S, Storm TA, Kay MA. 2008. The host response to adenovirus, helper-dependent adenovirus, and adeno-associated virus in mouse liver. Mol Ther 16:931–941. doi: 10.1038/mt.2008.37. [DOI] [PubMed] [Google Scholar]
- 35.Gross KL, Cidlowski JA. 2008. Tissue-specific glucocorticoid action: a family affair. Trends Endocrinol Metab 19:331–339. doi: 10.1016/j.tem.2008.07.009. [DOI] [PMC free article] [PubMed] [Google Scholar]


