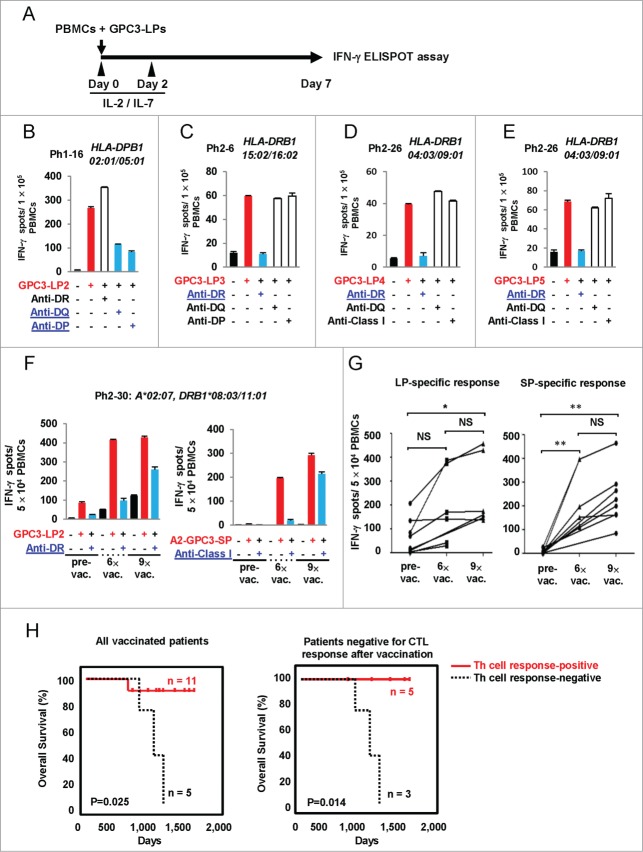
Figure 5 (See previous page).
The presence of GPC3-LP-specific Th cells in the PBMCs of patients with HCC who were vaccinated with a GPC3-SP. (A–H). Frozen PBMCs that were derived from HCC patients vaccinated with GPC3-SP (Tables S3 and Table S4) were stimulated with a mixture of GPC3-LP1, −2, −3, −4, and −5 plus IL-2 and IL-7 in vitro. After 7 days, the frequency of individual GPC3-LP-specific T cells was assessed using an ELISPOT. Th cell responses specific to GPC3-LP2 (B), LP3 (C), LP4 (D), and LP5 (E) were observed in 14 of the 20 HCC patients tested. HLA class II restriction of the GPC3-LP-specific Th cells was determined by means of a blocking assay using monoclonal antibodies specific to HLA-DR, -DQ, or -DP. (F) The number of LP-specific CD4+ T cells increased after repeated SP vaccinations. (G) Both GPC3-LP- and SP-specific responses were assessed in 13 HCC patients vaccinated with GPC3-SPs. The results represent specific IFNγ spots after subtraction of the background response. The PBMCs were isolated from the same patient at different time points as follows: just before the first vaccination with SPs (pre-vac), before the seventh vaccination (6×-vac), and before the tenth vaccination (9×-vac). (H) Kaplan–Meir curves for OS. Patients with GPC3-specific Th cell responses vs. patients with no-response (left panel) and patients with GPC3-specific Th cell responses vs. patients without response among patients negative for CTL induction (right panel).

