

Abstract
A region of cerebellar lobules V and VI makes strong loop connections with the primary motor (M1) and premotor (PM) cortical areas and is assumed to play essential roles in limb motor control. To examine its functional role, we compared the activities of its input, intermediate, and output elements, i.e., mossy fibers (MFs), Golgi cells (GoCs), and Purkinje cells (PCs), in three monkeys performing wrist movements in two different forearm postures. The results revealed distinct steps of information processing. First, MF activities displayed temporal and directional properties that were remarkably similar to those of M1/PM neurons, suggesting that MFs relay near copies of outputs from these motor areas. Second, all GoCs had a stereotyped pattern of activity independent of movement direction or forearm posture. Instead, GoC activity resembled an average of all MF activities. Therefore, inhibitory GoCs appear to provide a filtering function that passes only prominently modulated MF inputs to granule cells. Third, PCs displayed highly complex spatiotemporal patterns of activity, with coordinate frames distinct from those of MF inputs and directional tuning that changed abruptly before movement onset. The complexity of PC activities may reflect rapidly changing properties of the peripheral motor apparatus during movement. Overall, the cerebellar cortex appears to transform a representation of outputs from M1/PM into different movement representations in a posture-dependent manner and could work as part of a forward model that predicts the state of the peripheral motor apparatus.
Keywords: cerebellar cortex, motor control, mossy fiber, Purkinje cell, Golgi cell, monkey
the cerebellum is generally important for fine motor control, and especially the lateral part of the cerebellum is essential for control of skilled upper limb movement (Coltz et al. 1999; Espinoza and Smith 1990; Ishikawa et al. 2014a, 2014b; Kitazawa et al. 1998; Mano and Yamamoto 1980; Ojakangas and Ebner 1992; Pasalar et al. 2006; Popa et al. 2012; Roitman et al. 2005; Thach 1968; Yamamoto et al. 2007). The lateral part of the cerebellum forms a number of loops with various cortical areas, i.e., the cerebro-cerebellar loop. Among others, cerebellar lobules V and VI are considered to play essential roles in the control of limb movement because they have strong connections with the primary motor area (M1) and the premotor area (PM) (Kelly and Strick 2003). Nevertheless, we are still lacking an understanding of the specific role of this cerebellar region in motor control.
In our previous studies (Kakei et al. 1999, 2001) we examined the coordinate frames of movement-related activities in M1 (Kakei et al. 1999) and ventral premotor area (PMv) (Kakei et al. 2001). We found that neurons in M1 encode movement in both extrinsic and intrinsic coordinate frames (Kakei et al. 1999), whereas neurons in PMv encode movement mainly in an extrinsic frame (Kakei et al. 2001). An extrinsic coordinate frame refers to a reference frame that represents the external world, including a body-centered location of a target (i.e., up, down, left, and right). An intrinsic coordinate frame refers to a reference frame about movement kinematics, dynamics of the body, or muscle activity. These prior findings led us to ask what is represented in the cortical input to the cerebellum via the activities of mossy fibers (MFs, Fig. 1). Moreover, what coordinate frames can we find in other cerebellar neurons? The answers to these questions are essential to determine the functional role of the cerebellum and the cerebro-cerebellar loop for the control of limb movement.
Fig. 1.
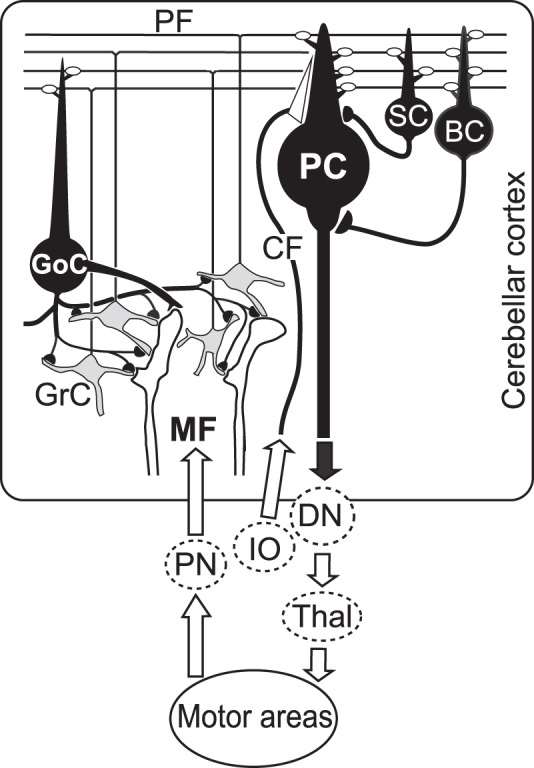
Basic neuron circuitry of the cerebro-cerebellar loop. The region of the cerebellar cortex where we recorded neuron activities has strong loop connections with cortical motor areas. White terminals represent excitatory synapses, and black terminals represent inhibitory synapses. BC, basket cell; CF, climbing fiber; DN, dentate nucleus; GoC, Golgi cell; GrC, granule cell; IO, inferior olive; MF, mossy fiber; PC, Purkinje cell; PF, parallel fiber; PN, pontine nucleus; SC, stellate cell; Thal, thalamus.
In previous work, Ebner and colleagues (Ebner and Pasalar, 2008; Hewitt et al. 2011; Pasalar et al. 2006; Roitman et al. 2005) recorded neural activity of Purkinje cells (PCs) of monkeys during a variety of upper limb movement tasks and reported that activity of simple spikes (SSs) of PCs in this cerebellar area correlated with multiple kinematic parameters of movement. They found that the SSs led kinematics even in an unpredictable task. Furthermore, the regression parameters from this task provided an accurate representation of kinematics in predictable tasks. This led them to suggest that the cerebellum can work as a forward model (Hewitt et al. 2011). Moreover, Tziridis et al. (2009, 2012) recorded from hand movement-related neurons in the dorsal part of pontine nucleus (PN), a main nucleus of projection to the cerebellum, of monkeys during reaching movements. These neurons had burst responses prior to movement onset (∼71 ms) and showed a variety of reference frames, that is, a hand-centered egocentric frame or frames dependent on the external world. These response properties were indistinguishable from those found in movement-related areas of both parietal and frontal cortices. The authors concluded that PN does not seem to make a major change in the information it receives from cerebral cortices before sending this information to the cerebellum (Tziridis et al. 2012).
Here we tried to complement the missing pieces of the cortico-cerebellar network and information flow in cerebellar cortex. We recorded the activities of MFs, Golgi cells (GoCs), and PCs in the lateral part of cerebellar lobules V and VI of monkeys performing step-tracking movements of the wrist joint (Kakei et al. 1999). We found that activities of MFs were quite similar to those of M1 or PMv neurons, and their timing lagged that of M1 neurons. We explored how MF inputs are processed in the cerebellar cortex by comparing their activity to that of GoCs and PCs, which receive strong input from MFs directly and/or indirectly via granule cells (GrCs, Fig. 1). We found that the three types of neurons demonstrated patterns of activity with surprisingly different spatiotemporal features. Our findings support the idea that this region of the cerebellar cortex computes kinematic information in a cascade manner. Furthermore, from the viewpoint of input/output of the cerebellum, our results are consistent with proposals that the cerebellar cortex may work as part of a forward model that predicts the state of the peripheral motor apparatus (Mehta and Schaal 2002; Wolpert et al. 1995).
MATERIALS AND METHODS
Animals and Task
We used three Japanese monkeys [Macaca fuscata, 1 female (monkey S, body wt = 6.0 kg) and 2 males (monkeys M and W), body wt = 8.0 kg and 7.8 kg, respectively]. All animal experimentation was conducted in accordance with the Guide for the Care and Use of Laboratory Animals and the Guiding Principles for the Care and Use of Animals in the Field of Physiological Sciences. All surgical and experimental protocols were approved by the Animal Care and Use Committee of Tokyo Metropolitan Institute of Medical Science, and all efforts were made to minimize suffering.
The monkeys were trained to make rapid step-tracking movements of the right wrist for a liquid reward. They sat in a primate chair with the forearm supported and grasped the handle of a lightweight, low-friction manipulandum. The device rotated around the two axes of wrist joint motion: flexion-extension and radial-ulnar deviation. Potentiometers on each axis measured rotation in the two planes of joint motion. The monkeys faced a large computer screen that displayed a cursor and a target. The cursor was a small filled rectangle that moved in proportion to the animals' wrist movements. The target was a larger open rectangle with an inside diameter equal to 8° of wrist movement. At the start of each trial, the target was placed in the center of the screen. The monkeys began the task by placing the cursor inside the target. After a variable hold period (0.8–1.0 s), a second target appeared at a peripheral location on the screen. Following a variable delay period (1–2 s), the central target was extinguished. This served as a “GO” signal that indicated to the animals to move from the central to the peripheral target. The animals were allowed 0.5 s to complete the initial movement (mean movement time was ∼180 ms). Correct trials were rewarded with a drop of juice after a 0.4-s delay.
We required the monkeys to move to eight different peripheral target locations that were evenly spaced at 45° intervals and used eight different combinations of wrist flexion-extension and radial-ulnar deviation. Target locations required a 20° change in wrist angle. The monkeys performed the task with the forearm in the fully pronated position (PRO) and in the fully supinated position (SUP), as described in Kakei et al. (1999).
All monkeys had been trained for more than 3 years on this task and, as a consequence, displayed very stable performance. Before the start of neural recording, we recorded electromyography (EMG) with wire electrodes (see Kakei et al. 1999 for details) to examine the patterns of muscle activity associated with performance of the task for two of the three animals (monkeys W and S). We sampled activity of muscles (total 14) in the forearm and upper arm, i.e., extensor carpi ulnaris (ECU), extensor carpi radialis brevis (ECRB), extensor carpi radialis longus, extensor digitorum communis, extensor digiti 45, abductor pollicis longus, flexor carpi radialis (FCR), flexor carpi ulnaris, palmaris longus, flexor digitorum superficialis, flexor digitorum profundus, pronator teres, biceps, and triceps.
Surgery and Recording
We used conventional techniques to make extracellular recordings of the activity of single neurons in cerebellar lobules V and VI. A recording chamber (19 mm in diameter, Cilux; Crist Instrument, Hagerstown, MD) was implanted using aseptic techniques and general anesthesia (ketamine, 4 mg/kg im and xylazine, 0.5 mg/kg im, followed by pentobarbital sodium, initial dose = 10 mg/kg iv, supplemented im as required). Before and during the surgery, atropine sulfate 0.04 mg/ml (im) was given as required. We centered the recording chamber above the lateral part of lobules V and VI of the cerebellum ipsilateral to the trained (right) hand based on MRI of the brain before surgery. In monkey S, we also obtained MRI images after surgery and confirmed that the chamber was centered on the target. When the animals had fully recovered from surgery, we recorded neural activity with glass-coated Elgiloy electrodes (0.9–1.5 MΩ). Single-unit activities were amplified (×10,000) and band-pass filtered (150-30,000 Hz) by an amplifier (AB-611J; Nihon Kohden, Tokyo, Japan), isolated with a Multi Spike Detector (ALPHA OMEGA, Nazareth, Israel), and then recorded along with movement kinematics at 1 kHz for both online and offline analyses. In addition, spike waveforms of each identified neuron were recorded at 50 kHz.
We identified PCs, MFs, and GoCs using several criteria (see Identification of Cerebellar Neurons). For each neuron, we recorded its activity while the animals made 5–20 successful movements to each target location. The eight target locations were presented in a randomized block design. Following task performance and while the animals were relaxed, we examined the peripheral receptive field of each recorded neuron. We used passive movements, palpation, or light touching of the fingers, forearms, upper arms, shoulders, chest, back, neck, and face on both sides of the body to search for somatosensory afferent inputs. We used neurons with a response to forelimb stimulation to define a putative forelimb region in cerebellar cortex. Neurons within the putative forelimb region that either did not respond to somatosensory stimulation or were lost before receptive field testing were included in this study.
Identification of Cerebellar Neurons
Identification of PCs and the cerebellar laminar structure.
Identification of single-unit activities was based on a combination of both their characteristic waveforms and their laminar location in the cerebellar cortex. PCs were identified by the coexistence of SSs and complex spikes (CSs) (Thach 1968). Typical SSs were biphasic negative-positive waveforms (SS, Figs. 2 and 3A), and the amplitude of the initial negativity was larger than that of the following positivity. CSs of the same PCs usually showed a smaller initial negativity, and the second positivity was larger than that of SSs (CS, Figs. 2 and 3A) (Thach 1968). The origin of SSs and CSs from the same PC was confirmed by a silent period (>10 ms) in SS activity after each CS (Thach 1968). SSs of PCs always demonstrated high spontaneous activity, and their median interspike intervals (ISIs) fell into a range of 5–40 ms (Prsa et al. 2009). In this study, >80% of SSs of PCs exhibited a median ISI of 5–20 ms (i.e., 200-50 Hz) (Fig. 3C). In contrast, spontaneous activity of CSs of the same PC was much lower (∼1 Hz), as described previously (Thach 1968). To avoid including PCs with possible contamination by SSs generated in other PCs, we excluded PCs with short ISI values (<3 ms).
Fig. 2.
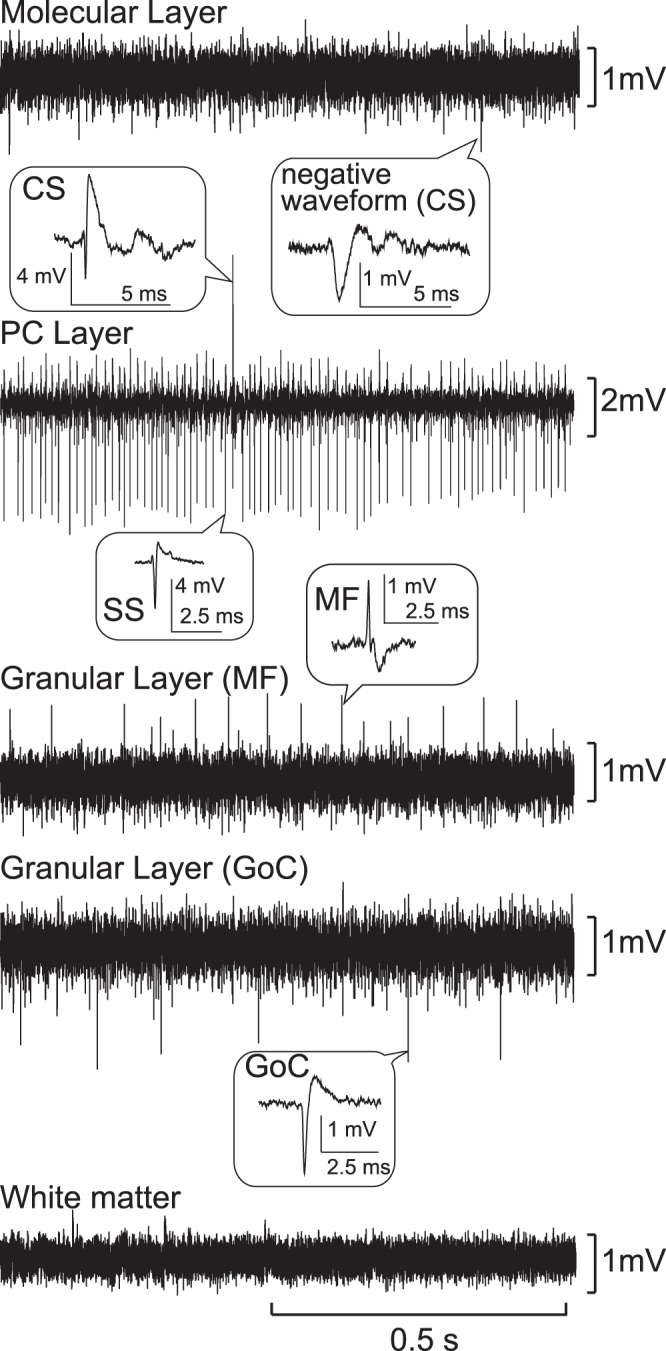
Identification of the different layers of the cerebellar cortex based on characteristic patterns of extracellular field potentials and single-cell activities. Typical field potential recordings for each layer of the cerebellar cortex are shown in order from surface to depth. Typical examples of single-unit activities are shown with higher time resolutions in the balloons. CS, complex spike; SS, simple spike.
Fig. 3.
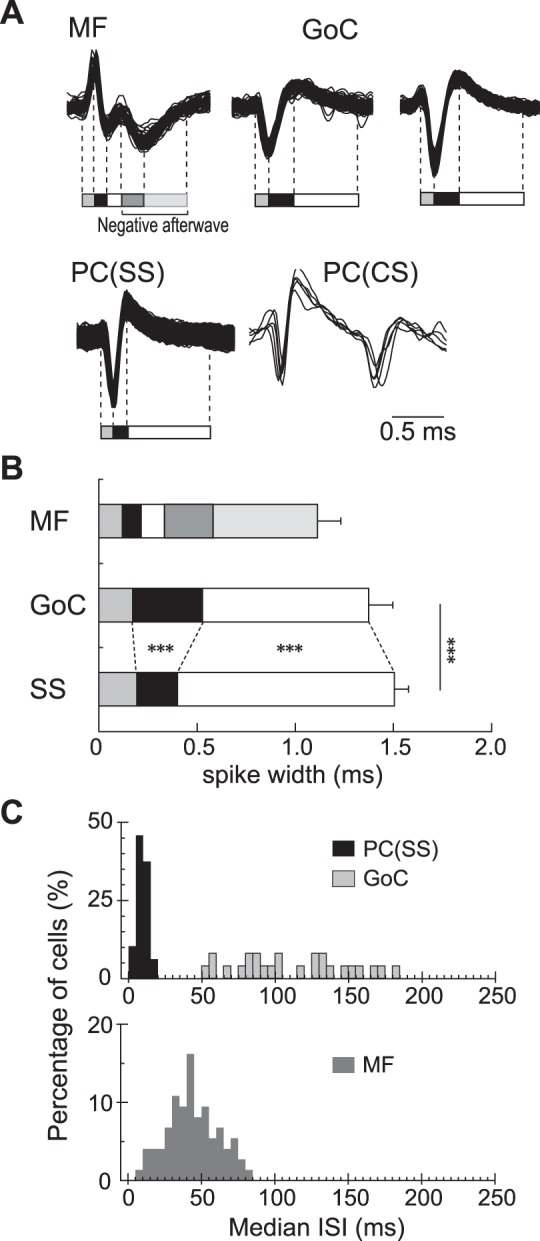
Characteristics of spikes and interspike intervals (ISIs) for MFs, GoCs, and PCs. A: typical examples of spikes for different types of neurons. We identified timings of onset, offset, and peaks of negative and positive potential changes of the spikes. We then calculated intervals between adjacent events to quantify the characteristic waveforms of the neurons. For instance, typical spikes of an MF were divided into 5 periods. In contrast, typical spikes of a GoC or SSs of a PC were generally divided into 3 periods with different durations. B: average intervals for each period. Durations of the second and third periods were significantly different between GoCs and SSs of PCs (***P < 0.01). C: distribution of median ISI of the 3 types of cerebellar neurons in the resting state. 25 PCs, 25 GoCs, and 73 MFs were used. They were selected because they were recorded in the same track and/or in a nearby track using the same electrode and allowed comparison of data recorded with similar experimental conditions.
Because of the large unit size and the high spontaneous SS activity of PCs, the PC layer provides a landmark for identifying the laminar structure of the cerebellar cortex. The PC layer is located between an outer molecular layer and an inner granular layer. The molecular layer and the granular layer could be identified based on their characteristic background and unit activities. Background activity in the molecular layer was generally quiet, but we sometimes encountered unit activities with a prominent negative wave of long duration (2–5 ms) (Fig. 2, Molecular Layer). These units were presumed to be CSs (Prsa et al. 2009; van Kan et al. 1993a; Vos et al. 1999) because of their characteristically low spontaneous activity (∼1 Hz). In contrast, we never observed CSs in the granular layer. Background activities in the granular layer were always noisier than in the molecular layer and contained numerous negative or positive spikes that were too small to be isolated or identified (Prsa et al. 2009; van Kan et al. 1993a; Vos et al. 1999). However, within the background activities, we were able to isolate larger units that included putative MFs and GoCs (Fig. 2).
Typically, one finds a molecular layer, a PC layer, a granular layer, and white matter in this order from surface to depth. We call this the primary order. After encountering the primary order, one may encounter the reverse order, i.e., a second granular layer, followed by a second PC layer, and molecular layer. Occasionally, an electrode enters directly into the cerebellar nuclei from white matter without encountering the reverse order. Thus the consistency of the laminar order of the cerebellar cortex allowed us to identify electrode location. During recording, we monitored and identified these characteristics using an oscilloscope and an audio system.
Identification of MFs.
We identified unit activities of MFs in the granular layer by the occurrence of a short positive-negative potential followed by a longer “negative afterwave,” as shown in Figs. 2 and 3A (Bourbonnais et al. 1986; Taylor et al. 1987; Walsh et al. 1972, 1974). Because the negative afterwave represents an excitatory postsynaptic potential in GrCs (Walsh et al. 1974), it is highly likely that unit activities with a negative afterwave were MFs recorded near glomeruli. In contrast to the narrow distribution of median ISIs of PCs, median ISIs of MFs were distributed widely (Fig. 3C), suggesting a wide variation in activity level.
Identification of GoCs.
Identification of GoCs was based on the location of the electrode in the granular layer and on the characteristic discharge patterns and waveform of spikes (Prsa et al. 2009; Vos et al. 1999; Walsh et al. 1974). A typical GoC demonstrated negative-positive spikes (Figs. 2 and 3A), sometimes with an initial small positive phase, as shown in Fig. 3A.
Although their waveforms showed some similarity to those of SSs, GoCs generally had a longer interval between the negative and positive peaks and a shorter interval between the positive peak and the offset of the action potential (Fig. 3B). Furthermore, GoCs were distinguished from PCs because the distribution of their median ISIs did not overlap (Fig. 3C, see Data Analysis), in accordance with previous studies (Barmack and Yakhnitsa 2008; Holtzman et al. 2006; Prsa et al. 2009). GoCs also differed from unipolar brush cells in the granular layer because these have much higher and more uniform firing rates, similar to SSs (Barmack and Yakhnitsa 2008; Simpson et al. 2005). We excluded one set of data from the putative GoCs because its median ISI (25 ms) and narrow ISI distribution (15.2 ms) differed from that of the remaining putative GoCs. It is unlikely that our population of GoCs contained other neuron types found in the granular layer, such as Lugaro cells, candelabrum cells, and perivascular cells (Ambrosi et al. 2007) because these are much less common than GoCs (Simat et al. 2007).
Data Analysis
Discrimination of waveforms between GoCs and SSs of PCs.
Given the similarity in the waveforms of both GoCs and PCs (i.e., a deep negative wave followed by a large positive wave, Fig. 3A), we established a protocol to distinguish the spikes of GoCs and PCs. We tested all recorded waveforms of GoCs (n = 25) and MFs (n = 66) with an equivalent population of PCs recorded either in the same or the nearest track. First, we averaged the waveforms of each cell. Then, for each cell we detected the times of onset and offset of the positive and negative potential changes and the timing of negative and positive peaks, as illustrated in Fig. 3A. Finally, we calculated the means of the intervals between adjacent events (Fig. 3B) and the ISIs (Fig. 3C). We found that ISIs and the durations of the negative waves differed between GoCs and PCs (Holtzman et al. 2006; Prsa et al. 2009).
Identification of task-related neural activity.
We analyzed the recorded data with custom-made programs using MATLAB (MathWorks, Natick, MA). To detect movement onset, we set the threshold at 5% of max velocity for each trial. To identify significant task-related modulation of neural activity, we compared the mean discharge rate before the instruction signal (−500 to −300 ms relative to the instruction signal) to that around movement onset (−100 to 100 ms relative to the onset of movement) with paired t-tests (with significance set at P < 0.01) for movements in each direction and posture. We classified those cells that exhibited significant differences in discharge rate for any direction in any posture as “task-related.” The task-related activity of those cells is the focus of this report.
Illustration of firing patterns.
Hereafter, we used spike data aligned on movement onset. We displayed peri-event time histograms (PETHs) using 10-ms bins. We also made contour plots of firing rates for PETHs in eight movement directions in each posture using Surfer 8 (Golden Software, Golden, CO). The contour plots show changes in neural activity in both time and movement direction (Figs. 6, 7, and 11). To compare the sum of MF activity with the firing pattern of GoCs, we aggregated the PETHs of all MFs and made a contour plot (Fig. 11). To obtain the average characteristics of the firing patterns for the three types of neurons, we calculated the firing rate in 25-ms moving time windows from −300 to +300 ms relative to movement onset for each movement direction for each cell. Thus we obtained matrices of firing rate in 8 directions × 24 time windows for each cell. We next normalized the firing rate to the maximum value of each matrix and determined the movement direction with the highest peri-movement firing rate. All matrices were realigned on the “highest direction” and averaged for each of the three types of neurons (Fig. 12).
Fig. 6.

Raster plots, histograms, and contour plots of typical examples of activity of 3 sample MFs (A–C) and 1 GoC (D) in 2 postures (PRO and SUP). The abscissae represent time (in ms) relative to movement onset (Move). The ordinates represent movement direction. In PRO, Up, Rt, Dn, and Lf correspond to ex, ul, fl, and ra, respectively. In SUP, Up, Rt, Dn, and Lf correspond to fl, ra, ex, and ul, respectively (see also Fig. 4A). Inverted open triangles in the rasters indicate the timing of the “GO” cue in each trial. Bin width of histograms is 10 ms for MFs and 20 ms for the GoC. Each tick mark on the ordinate of the histograms represents 50 Hz; thus 2 ticks represent 100 Hz. The contour plots show the same data as that in the histograms presented here. The scale of each contour plot is normalized to the maximum firing rate of each neuron (= 100%) during the task period. The scale for activity of the GoC is coarser than that for MFs and PCs attributable to the much lower maximum firing rates of GoCs (<30 Hz). The arrows beside each contour plot indicate the PD in a time window that includes neural activity related to movement onset (A, B, D = −100 to 100 ms relative to movement onset; C = −200 to 0 ms relative to movement onset). Black arrows indicate statistically significant PDs, and white arrows indicate nonsignificant PDs defined by a bootstrapping method (see materials and methods). Respective PDs with statistical significance: A: −181.8° PRO, −98.4° SUP; B: −160.4° PRO, −178.5° SUP; C: −139.3° PRO, −144.4° SUP. Here, 0° represents the rightward direction. A positive value indicates an upward bias, and a negative value indicates a downward bias.
Fig. 7.

A total of 2 samples of SS activity of PCs. A and B: raster plots, histograms, and contour plots of typical examples of activity of PCs in 2 postures (PRO and SUP). The same format is used as for MFs in Fig. 6. Inverted filled triangles above histograms indicate significant suppression compared with spontaneous activity. Each tick mark on the ordinate of the histograms represents 100 Hz; thus, 2 ticks represent 200 Hz. Note the high spontaneous SS activities in PCs. The time windows for calculation of PDs were as follows: A and E: −100 to 0 ms relative to movement onset; B and G: −100 to 100 ms relative to movement onset. A significant PD (black arrow beside contour plot) was obtained only in B PRO, 99.7°. C: start and finish time of activity suppression in the sample cell presented in A, PRO. Note that these times changed with movement direction. The finish time for the up+rt direction was 265 ms relative to movement onset and is off scale. D: distribution of the earliest start time and the latest finish time of suppressive modulation observed in PCs (n = 25 for PRO, 20 for SUP) that exhibited suppressive modulation in >5 directions. The 2 dark gray bars indicate start times for the 2 postures (darker for PRO than SUP), and the 2 light gray bars indicate finish times. The leftmost bar includes PCs with suppression times earlier than −300 ms, and the rightmost bar includes PCs with suppression times later than 300 ms relative to movement onset. E and F: mean activity for 100 ms before movement onset (E) and in more precise time windows (F) for the neuron shown in A. Movement direction is indicated on the abscissae. Mean firing rate for each direction is indicated on the ordinate. Note that the ordinate scales differ for different graphs. The thick, smooth gray lines show significant cosine tuning, and the dashed vertical lines indicate the estimated PD. G and H: mean activity for 100 ms before to 100 ms after movement onset (G) and in more precise time windows (H) for the neuron shown in B. Note that the graphs in H show time periods before and after movement onset only for SUP. The lines in H have the same meaning as in F.
Fig. 11.

Comparison of summed activity of all recorded MFs with activity of a typical GoC for the 2 forearm postures (PRO and SUP). A: contour plots of the summed activity of all MFs (n = 54). B: contour plots of activity of a typical GoC (same as Fig. 6D). The change in appearance from Fig. 6D is due to a shorter time axis, which increased the minimum firing rate.
Fig. 12.

Comparison of normalized, directionally aligned activities of 3 neuron types. A: contour plots of mean normalized activity for each type of neuron; n = 54 MFs, 25 GoCs, 42 PCs (SS). White rectangles indicate the 25-ms time window immediately before movement onset. B: directional modulation in the 25-ms time window highlighted by the white rectangles in A. Thin black lines show the mean values of the normalized firing rate in each of the 8 movement directions. Thick gray lines show the best fit cosine, calculated as in Kakei et al. (1999). Vertical dashed lines indicate the PD of each cosine curve, plotted relative to the direction of highest activity. PD was shifted by 5.2° in MFs, 7.8° in GoCs, 8.0° in PCs (SS). Horizontal dashed lines indicate the mean normalized firing rate in the first time bin (−300 to −275 ms relative to Move) of all 8 directions as a baseline. Baseline was at 0.20 (SD 0.03) for MFs, 0.25 (SD 0.03) for GoCs, 0.46 (SD 0.02) for PCs (SS). All figures were made using data in PRO, but we obtained nearly the same results in SUP (not shown).
Evaluation of suppressive modulation of PCs for wide range of movement directions.
We identified statistically significant suppression of PC activity in successive 25-ms time windows by moving the window in 5-ms steps from −300 ms to +300 ms relative to movement onset. We compared the activity in each window with the mean discharge rate before the instruction signal (−500 to −300 ms relative to the instruction signal) using a paired t-test (P < 0.05). We next evaluated the directional range of suppression by calculating the maximum number of adjacent movement directions that exhibited significant suppression for at least one time window within the range of ±100 ms relative to movement onset. We identified onset timing of the suppression by detecting the earliest window in the range. We also identified offset timing of the suppression in a similar way.
Evaluation of directional tuning and its temporal consistency.
We used a bootstrapping method to identify whether a neuron was directionally tuned (P < 0.05) (Crammond and Kalaska 1996). We then used cosine fitting of activity to determine the preferred direction (PD) of each directionally tuned neuron and muscle for the two separate postures (Hoffman and Strick 1999; Kakei et al. 1999). PD is defined as the direction of movement with the highest firing rate in the fitted cosine curve (Georgopoulos et al. 1982). We also evaluated “gain modulation” for each neuron and muscle by comparing the mean activity between the two forearm postures. When the maximum activity differed by >30% for a change in posture, we classified the cell as “gain-modulated” (Kakei et al. 1999). Using these calculations, we examined the temporal consistency of PD across the 24 time bins from −300 ms to +300 ms relative to movement onset (i.e., 25-ms windows). We selected cells with significant directional tuning in a reference time period immediately before (−25 to 0 ms) movement onset and calculated PDs of other 25-ms windows for these cells. We then estimated circular correlation coefficients (CCCs) (Fisher and Lee 1983) between PD in the reference period and PDs in the remaining time windows (Fig. 9). The significance level of the CCC was set at P < 0.05.
Fig. 9.

Temporal characteristics of PDs for MFs and PCs. A: coefficient of circular correlation (CCC) between PD in a reference time window (gray vertical column marked ref. period, −25 to 0 ms relative to movement onset) and remaining test windows for MFs and SSs of PCs. The ordinate is the value of CCC. Open circles indicate significant CCCs (P < 0.05), and dots indicate insignificant CCCs. We combined results from the 2 postures for this figure because PRO and SUP had similar results (not shown). Small letters a–f indicate the 6 time windows shown in B. B: comparison of PDs between the reference and test time windows for MFs (top) and PCs (bottom). The 6 scatter plots (labeled a–f) show PDs in the 6 peri-movement time windows indicated in A. Bin width = π/8. For this plot only, the values of PD were assigned to the nearest movement direction. We counted cells in each of the 64 grid points (8 directions in reference period × 8 directions in test period). The area of each circle indicates the percentage of cells with the same PDs in both the reference and test periods. Note that a random distribution of PDs would yield about 1.6% (1/64) at each grid point, or about 1 cell.
Fitting of models for distribution of postural shifts in PD.
We also examined posture-dependent changes in the directional tuning of neurons by calculating the difference in PD in the reference time period between PRO and SUP for each cell with significant directional tuning in both postures (Fig. 10). We compared the posture-dependent PD shift for neurons with that for EMGs of the wrist muscles. We fit the distribution of postural shifts in PD, Dist(x), from −180° to 180°, bin width = 10°, by the following two models:
| (1) |
| (2) |
Fig. 10.
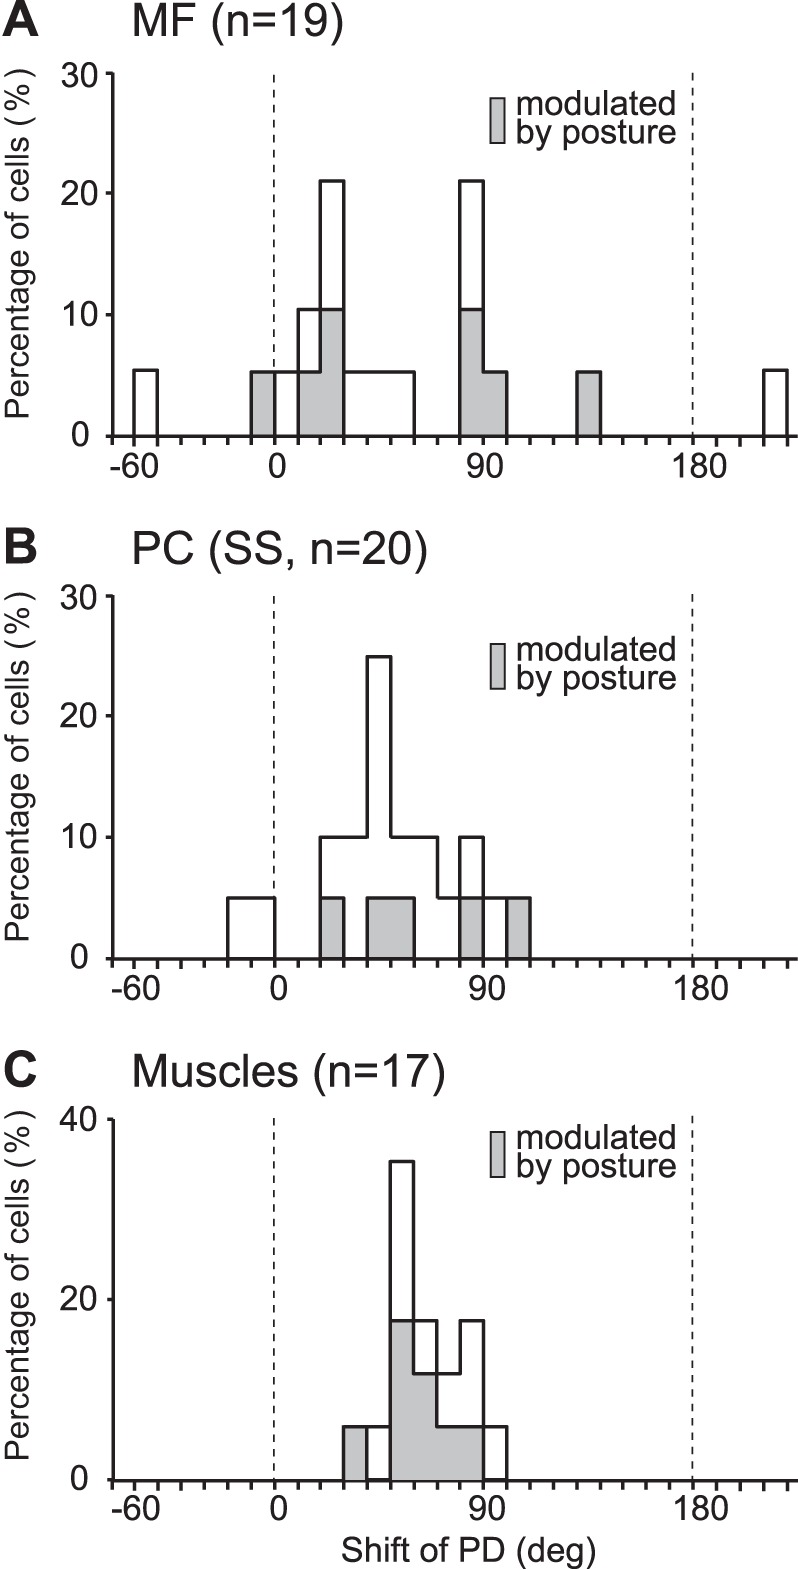
Distribution of shifts in PD from PRO to SUP for MFs (A), PCs (B), and task-related muscles (C) in a time window of −25 to 0 ms relative to movement onset. Shaded bars represent neurons or EMGs showing “gain modulation” (i.e., a change in the maximum of mean activity of >30% with a change of forearm posture). Bin width = 10°. Note that 180° is the same as −180°.
where x indicates bins of PD shift, m1 and m2 are mean values, and s1 and s2 are standard deviation of distributions. α and β indicate factors, and ε is residual error. We then compared the goodness of fit to the models using Akaike's Information Criterion (AIC): AIC(Model) = −2L + 2k, where L is the maximum log-likelihood of the model, and k is the number of free parameters. We determined the combination of variables that showed the smallest AIC for the models.
RESULTS
Movement Kinematics and Muscle Activity
Before recording neuron activity, we recorded EMG of 14 forearm and upper arm muscles (see materials and methods) and calculated their PDs for PRO and SUP. We found that all of the recorded forearm muscles (i.e., except for biceps and triceps) exhibited task-related activity with significant directional tuning. Figure 4B demonstrates the PDs of three representative wrist prime movers (ECU, ECRB, FCR) in a time window of −25 to 0 ms relative to movement onset in monkey S. When the forearm was rotated clockwise from PRO to SUP, the PDs of all three muscles rotated clockwise. For the three muscles in two monkeys, the average shift of PD for 180° rotation of the forearm from PRO to SUP was 64.8° ± 12.5 (range 50.4–87.9°, Fig. 4C). The PDs of the task-related muscles and their shifts for this change in posture were almost identical to those obtained in our previous study (Fig. 1 in Kakei et al. 1999). The mean onset latency of the task-related modulations of these muscles was −64.9 ± 16.9 ms relative to movement onset. In the analysis described below, we will compare onset timing and PD shift of EMG with those parameters for three types of cerebellar neurons.
Fig. 4.
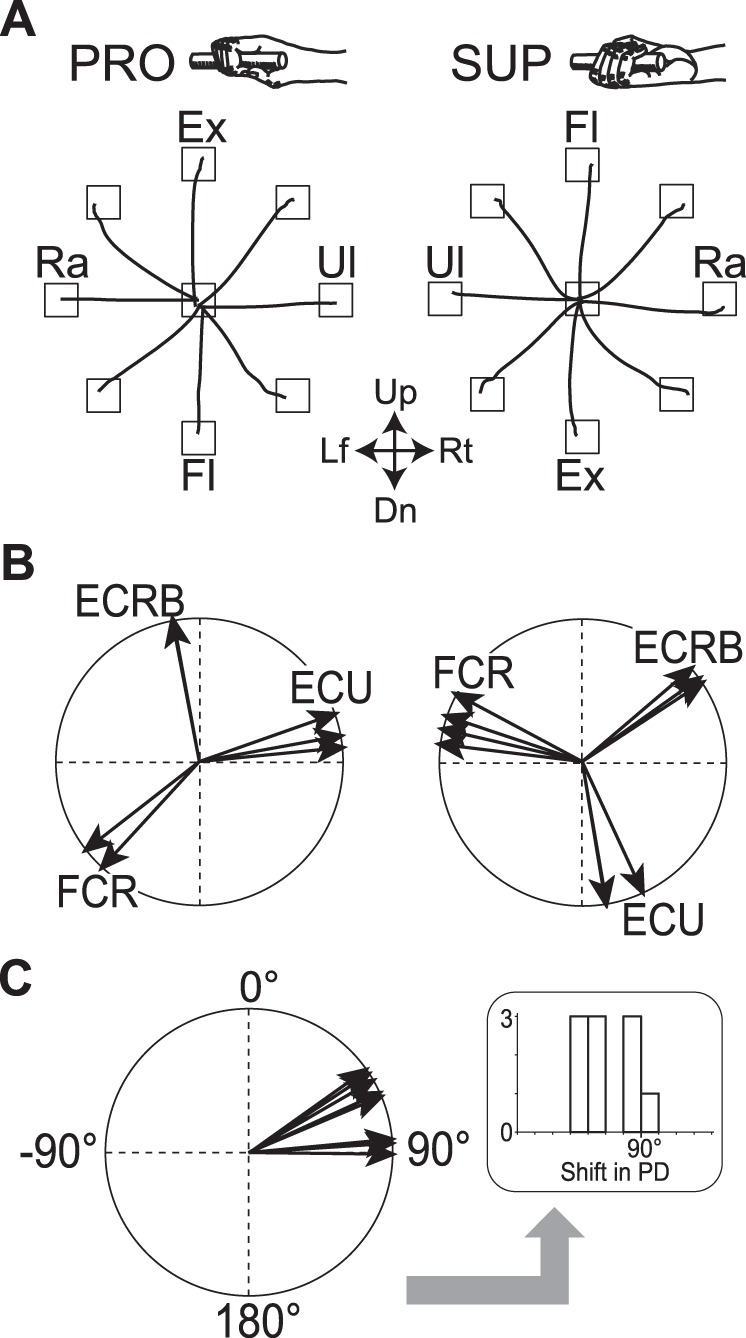
Movement trajectories of the wrist and preferred directions of wrist prime movers in 2 forearm postures, fully pronated (PRO) and fully supinated (SUP) (see top insets). A: averaged movement trajectories to 8 peripheral targets for monkey S. The target locations required 20° changes in the angle of the wrist joint. Each trace represents an average of 10 trials. Up, up; Rt, right; Dn, down; Lf, left; Ex, extension; Fl, flexion; Ra, radial deviation; Ul, ulnar deviation. B: preferred direction (PD) of 3 prime movers of the wrist joint for monkey S. ECRB, extensor carpi radialis brevis; ECU, extensor carpi ulnaris; FCR, flexor carpi radialis. C: change in PDs of the muscles when posture was rotated from PRO (normalized to 0) to SUP, i.e., a subtraction between the 2 diagrams in B. The right inset shows the same data plotted as a histogram (bin width = 10°) and illustrates the method of deriving the histograms in Fig. 10.
Activity Patterns of the Cerebellar Neurons
We recorded single-unit activity of MFs, GoCs, and PCs in the lateral part of lobules V and VI of the right cerebellum (Fig. 5, A and B) while monkeys used their right hand to perform wrist movements in eight different directions in two separate forearm postures (Kakei et al. 1999, 2001). We found 139 MFs, 36 GoCs, and 205 PCs that were well isolated and were located within an area containing receptive fields on the right forelimb, regardless of whether they were task related or not. We selected 54 MFs (25, 8, 21 in monkeys S, M, and W, respectively), 25 GoCs (20, 5 in monkeys S and M, respectively), and 42 PCs (12, 25, 5 in monkeys S, M, and W, respectively) for further analysis because of their well-isolated and significant task-related activity in both forearm postures (PRO and SUP).
Fig. 5.

Distribution of task-related MFs, GoCs, and PCs in the cerebellar cortex. A: dorsal view of the right cerebellar hemisphere of monkey W. The open star indicates the center of the recording chamber. The gray dot indicates the location of a PC that was identified by the electrolytic lesion shown in B. PF, primary fissure; IV-VI, lobules IV-VI; R, rostral; L, lateral. B: coronal section of the cerebellum of monkey W at the level of the transverse gray line with the gray dot in A. The gray dots in A and B indicate the location of an electrolytic lesion marking a PC. The dashed line indicates a recording track. AIP, anterior interpositus nucleus; PIP, posterior interpositus nucleus; h, hilum; D, dorsal. C: distribution of task-related MFs, GoCs, and PCs for the 3 animals. Open circles indicate track locations of recorded MFs, inverse rectangles indicate track locations of recorded GoCs, and open diamonds indicate track locations of recorded PCs. For monkey W, the location of the PF (indicated by the black line) was confirmed with histology. For monkeys M and S, the gray lines indicate estimated locations of the PF. The intersection of the 2 dashed lines indicates the center of the recording chamber in each animal.
Activity of MFs
Typical task-related MFs demonstrated a unimodal and directionally tuned phasic modulation of activity around movement onset (Fig. 6, A–C). The neuron in Fig. 6A showed a clear shift in PD of about 90° (note the change in positions of the 2 black arrows beside the contour plots) when the forearm was rotated 180° clockwise from PRO to SUP. This neuron also showed gain modulation, i.e., its activity in SUP was approximately two times higher than that in PRO (i.e., maximum firing rate was 50% of max). A PD shift and a gain modulation in combination are properties that we observed previously in activities of the task-related muscles and “muscle-like” neurons in M1 under the same task conditions (Kakei et al. 1999). After quantifying the shift in PD as described later, we found 19 MFs that exhibited significant directionally tuned activity for the 25 ms before movement onset in both forearm postures. Of these, 8 MFs showed a large PD shift of >40°, that is, muscle-like activity (Fig. 10A).
Figure 6B represents another type of MF activity. This MF also demonstrated sharply directional modulation of activity in both postures. Nevertheless, its PD did not show a significant shift for a change in posture (note the similar position of the 2 black arrows). On the other hand, this MF showed significant gain modulation of both the delay period activity and the movement-related burst activity for a change in posture. This type of MF activity is similar to the activity of “extrinsic-like with gain modulation” neurons in M1 reported in our previous study (Kakei et al. 1999). Four MFs were classified here. Another five MFs exhibited “extrinsic-like without gain modulation” activity like that observed in M1 and PMv in Kakei et al. 2001 (Fig. 10A).
The third type of MF activity (Fig. 6C) exhibited clear delay period activity in both forearm postures (Ishikawa et al. 2014b). This MF showed long-lasting directionally tuned activity mainly before movement onset, with no significant PD shift or gain modulation between the two forearm postures. The delay activity was similar to that observed in PMv (Kakei et al. 2001). In total, we found 12 MFs that exhibited long-lasting directionally tuned activity that had stable PDs for the 300 ms before movement onset. Two of these MFs showed a large muscle-like PD shift (>40°) with gain modulation, and two showed only gain modulation. The remaining 8 of 12 MFs (66.7%) showed delay activity that was extrinsic-like without gain modulation, as observed in PMv (Kakei et al. 2001). Overall, most MFs showed activity patterns similar to those of the cortical motor areas reported previously (Kakei et al. 1999, 2001).
Activity of GoCs
MFs directly activate GrCs and GoCs in the granular layer. GoCs also receive indirect MF inputs via GrCs to their basal apical dendritic trees in the molecular layer. Given these strong direct and indirect MF inputs to GoCs, we were surprised to observe a marked difference between activities of GoCs and their MF inputs. A typical GoC showed a low firing rate, a modest increase in activity around movement onset, and a lack of directional tuning (nonsignificance indicated by the white arrows beside the contour plots, Fig. 6D). We recorded 25 movement-related GoCs, and 23/25 GoCs (92.0%) showed an increase in activity around movement onset, whereas 2 GoCs showed a decrease in activity. Moreover, none showed directionally tuned activity for the 25 ms before movement onset in both forearm postures (Fig. 8B). GoC activity also did not display any significant posture-related changes. Weak directional tuning was reported previously for GoCs in the oculomotor vermis during saccadic eye movements (Prsa et al. 2009). Thus GoCs may be characterized by a broad activity field with little directional tuning, regardless of location in the cerebellum or movement task.
Fig. 8.

Cell-type specific properties of activities of MFs, GoCs, and PCs. A: distribution of modulation onsets relative to movement onset; n = 54 MFs, 25 GoCs, 42 PCs (SS). B: percentage of each neuron type with significant directionality in both forearm postures. Directionality was evaluated in 25-ms bins during the time window of ±300 ms relative to movement onset; n = 54 MFs, 25 GoCs, 42 PCs (SS). Asterisks below the abscissa indicate a significant difference (P < 0.05) in X2-test among the 3 neuron types (MFs, GoCs, PCs). Normal triangles above the GoC line indicate a significant difference (P < 0.05) in X2-test between MFs and GoCs. Inverted triangles above the GoC line indicate a significant difference (P < 0.05) in X2-test between SSs and GoCs. Section signs (§) indicate a significant difference (P < 0.05) in X2-test between MFs and PCs.
SS Activities of PCs
All PCs demonstrated a characteristic high spontaneous SS activity (see Fig. 3C and rasters in Fig. 7, A and B). The most notable feature of the task-related modulation of SS activity was a sudden and marked decrease in the spontaneous activity (i.e., suppression) around movement onset for a wide range of movement directions (Fig. 7, A and B), as described in our recent report (Ishikawa et al. 2014a). For instance, the representative PC shown in Fig. 7A displayed significant suppression of SS activity before movement onset for eight directions in PRO and four directions in SUP. Similarly, another representative PC (Fig. 7B) showed suppression around movement onset for four directions in PRO and seven directions in SUP. We observed similar broadly tuned suppressions of SS activity (≥5 movement directions, i.e., ≥225°) around movement onset in 25/42 PCs (59.5%) in at least 1 forearm posture (25 for PRO and 20 for SUP). This ratio of PCs with broad suppression around movement onset was significantly higher than we found for MFs (17/54, 31.5%) and GoCs (2/25, 8%), P < 0.01 in X2-tests of 2 neurons × wide/narrow ranges (df = 1). In general, the suppressions of PC activity started earlier than 50 ms before movement onset and ended after movement onset (Fig. 7D, example in Fig. 7C).
Directional tuning of SS activity may appear weak because of the broad suppression. For instance, in Fig. 7A, PRO and SUP, the directional tuning in a time window of −100 to 0 ms relative to movement onset did not reach significance (Fig. 7A, white arrows and Fig. 7E, P = 0.06, PRO; P = 0.11, SUP). Nevertheless, the peri-movement suppression contained directional information because both its onset and offset were clearly altered with movement direction (e.g., Fig. 7C). Indeed, when we subdivided the 100-ms premovement window into narrower time bins of 25 ms (Fig. 7F), we found significant directional tuning for three of the four 25-ms bins in the 100-ms time window (Fig. 7F, PRO and SUP). Furthermore, it should be noted that, during the 100-ms time window, PD shifted dynamically by 135° in PRO (from up+rt to dn) and by about 180° in SUP (from up+rt to dn+lf) (Fig. 7F, dashed lines). It is worth noting that the difference between the PDs for the two forearm postures at the start of the suppression (−100 to −50 ms, Fig. 7C) was small (21.7° in the −100 to −75 ms window, 4.1° in the −75 to −50 ms window). The PD difference became larger in the −25 to 0 ms window (46.4°) and in the following five windows (>47.0°, not shown).
For the PC shown in Fig. 7B, peri-movement SS activity in SUP (i.e., ±100 ms relative to movement onset) was also not significantly directional (white arrow in Fig. 7B SUP and Fig. 7G SUP, P = 0.22). Nevertheless, we found significant directional tuning in SUP in five of eight narrower 25-ms time bins (Fig. 7H). Because the PDs in the narrower bins shifted from lf to rt+dn, total activity within ±100 ms relative to movement onset did not show significant directionality. In contrast, SS activity in PRO in the same period indicated highly significant directional tuning (Fig. 7G, PRO, P < 0.001). Overall, 36/42 PCs (85.7%) exhibited significant directional tuning for at least the 25 ms before movement onset in either 1 forearm posture (16 PCs) or both (20 PCs). These results indicate that directional information is embedded in the finer temporal dynamics of SS activity and is strongly dependent on the forearm posture.
SS Activity During the Delay Period
PCs also showed significant modulations of SS activities during the delay period before the GO signal (inverted open triangles in raster plots in Fig. 7, A and B). For instance, the PC shown in Fig. 7A demonstrated a posture-dependent difference in the mean of delay period SS activity from 58.1 sp/s in PRO to 79.9 sp/s in SUP (P < 0.001). Indeed, 26/42 PCs (61.9%) displayed a significant difference of the spontaneous activity between PRO and SUP. Such posture-dependent changes in SS activities during the delay period strongly suggest that SS activities of PCs represent information about the current posture of the body. Furthermore, the SS activity during the delay period for the PC in Fig. 7B was highly directional and built up toward movement onset in both postures. We observed similar directionally tuned activity during the delay period in five PCs (5/42, 12.2%). Of these, one PC exhibited a large PD shift with gain modulation, one exhibited a large PD shift without gain modulation, and one exhibited a small PD shift with gain modulation. The remaining two PCs exhibited small PD shifts without gain modulation. These posture-dependent changes in SS activity during the delay period indicate that the cerebellum also is involved in the preparation for future movements, as are the higher motor-related areas (e.g., PMv in our previous work, Kakei et al. 2001).
Onset of Modulation in Neuron Activity
The timings of modulation onset for the three types of neurons are summarized in Fig. 8A. The means ± SD of the activity changes relative to movement onset were −72.6 ± 44.9 ms for MFs (n = 52), −70.4 ± 27.8 ms for GoCs (n = 25), and −73.7 ± 26.6 ms for SSs (n = 42). The onset latencies for the three types of neurons showed no significant differences (df = 1, F = 0.13, P > 0.07). On average, the onset latencies of activities of these cerebellar neurons lagged those of neurons in M1 and PMv reported in our previous studies (−97.0 ± 15.3 ms for 44 extrinsic-like M1 neurons, −93.6 ± 20.8 ms for 28 muscle-like M1 neurons, and −124.3 ± 30.6 ms for 55 extrinsic-like PMv neurons; Kakei et al. 1999,2001). In contrast, the activity changes of the cerebellar neurons showed a small lead over the average onset of EMG activity (−64.9 ± 16.9 ms) in task-related muscles.
Dynamics of Directional Modulation of Neuron Activity
We used a bootstrapping method with a moving time window to evaluate the dynamics of directional bias for all MFs, GoCs, and PCs using 25-ms time bins (Fig. 8B). Two hundred milliseconds before movement onset (i.e., around the GO signal), about 15% of MFs and PCs demonstrated significant directional tuning in both forearm postures. The percentage of MFs with significant directional tuning began to increase gradually starting at ∼200 ms before movement and reached 40% at ∼50 ms before movement onset. In contrast, the percentage of PCs with directional tuning rose suddenly at ∼100 ms before movement onset and exceeded 50% at movement onset (±25-ms time bins). Very few GoCs were classified as significantly directional, regardless of the task period. We performed an X2-test [2 (significant or nonsignificant) × 3 types of neurons] for each time bin and confirmed a significant difference between the three neuron types throughout the task period (df = 2, P < 0.05, indicated by asterisks below abscissa). Post hoc multiple comparisons confirmed that GoCs showed a significantly lower directional tuning than MFs and PCs in almost all task periods (P < 0.05, indicated by normal and reversed triangles). Moreover, the proportions of directional MFs and SSs differed significantly before and after movement onset (P < 0.05, indicated by §).
To compare the proportions of the cerebellar neurons showing directional tuning with that of M1 neurons, we used a time window of 100-0 ms before movement onset to evaluate directional tuning of cerebellar neurons, as in our prior study of M1 neurons (Kakei et al. 1999). The percentages of the directional MFs (27/54, 50%) and PCs (25/42, 60%) in this time period for both forearm postures were lower than that of the directional M1 neurons recorded in another monkey (88/125 cells, 70.4%; Kakei et al., 1999). An X2-test (2 significance of directional tuning × 3 neurons) demonstrated that the difference is significant (P < 0.05). Post hoc X2-tests showed a significant difference only between MFs and M1 neurons (P < 0.01).
Transience of Directional Preference of SS Activity
To examine the dynamics of PDs in MFs and PCs in greater detail, we calculated a set of CCCs for each MF and PC that showed significant directional tuning in a reference period (−25 to 0 ms relative to movement onset, Fig. 9A, vertical gray zone) for each forearm posture (see materials and methods). Because the temporal profiles of CCCs were largely independent of posture for both MFs and PCs (not shown), we combined data from the two postures in Fig. 9 (PRO: 27 MFs and 28 PCs; SUP: 27 MFs and 30 PCs). This resulted in 54 MFs and 58 PCs as the total number of cells.
For MFs, CCCs were highly significant from 100 ms before to 75 ms after movement onset (Fig. 9A, open circles on the gray line). In contrast, CCCs of SS activity were highly significant in a narrower time period from −50 ms to +50 ms relative to movement onset (Fig. 9A, open circles on the black line). The scatter plots in Fig. 9B compare the PDs in the reference time period to those in test time period for individual MFs and PCs around movement onset. These plots support the average responses shown in Fig. 9A. For MFs, the circles were concentrated along the upward diagonal line. The PDs from −100 ms to +75 ms were similar to the reference period, demonstrating that MFs show consistent directional tuning in an ∼200-ms time period surrounding movement onset. In contrast, the scatter plots for PCs were aligned on the upward diagonal line only for the time period from −50 to +50 ms, demonstrating that the directional tuning of SS activity changed quickly in a more restricted time period before and after movement onset. It is noteworthy that the CCCs of SS activity were nearly 0 outside of the time period from −50 to +50 ms. A t-test confirmed that the mean value of CCCs over all 23 periods for MFs was significantly higher than that for SSs (P < 0.001).
Shift in PD with Wrist Rotation
As described in our prior publication (Kakei et al. 1999), we examined the shift in PD of each neuron for the 180° change of forearm posture from PRO to SUP. We reasoned that a shift in PD would differentiate neurons signaling information in a muscle or joint-like coordinate frame from those carrying information in an extrinsic-like coordinate frame. Based on the PD shift observed in forearm muscles, we categorized M1 and PMv neurons with a small shift in PD (± 35°) as extrinsic-like and those with an orderly and relatively large (>40°) shift in PD as muscle-like (Kakei et al. 1999, 2001). Here, we used the same analysis to compare movement representations of input (MF activity) and output (SS activity) of the cerebellar cortex to gain insight into the local information processing. MFs showed a bimodal distribution of shifts in PD (Fig. 10A) with a marked similarity to that observed for M1 neurons (Fig. 4 in Kakei et al. 1999). In contrast, PCs showed a unimodal distribution of PD shifts that clearly differed from that of MFs (Fig. 10B). Interestingly, the mean shifts in PD for MFs and SSs showed no significant difference (t = 0.95, P = 0.33). We used AIC to evaluate goodness of fit and found that a mixture of two Gaussian distributions provided a better fit to the histogram of shifts in PD for MFs (AIC = 175.7 for 1 Gaussian; AIC = 174.0 for 2 Gaussians). The estimated means of the two Gaussians were 22.5° and 87.5°. In contrast, a single Gaussian distribution provided a better fit to the histogram of shifts in PD for PCs (AIC = 196.1 for 1 Gaussian; AIC = 201.9 for 2 Gaussians). The estimated mean of the single Gaussian was 50.3°. We concluded that the pattern of shifts in PD for SSs differed significantly from that of MFs and M1 neurons.
Resemblance of Population MF Activity to GoC Activity
GoCs receive inputs directly from numerous MFs (∼700) and indirectly via even more numerous GrCs (∼5,000) (Ito 2006). Despite the strong directional tuning of MF inputs described above, almost all task-related GoCs demonstrated a surprising lack of directional tuning irrespective of time window. Therefore, the directional biases of individual MFs seem to cancel out on individual GoCs. Such cancelling would be possible if we assumed highly convergent MF inputs onto GoCs and nonselectivity of GoCs for these inputs. To evaluate this possibility, we summed activities of all (n = 54) task-related MFs recorded in this study to estimate the minimum number of MFs necessary to obtain the observed low directional tuning of GoCs. The summed activity (Fig. 11A) demonstrated a surprising similarity to that of a representative GoC (Fig. 11B). Note that the representative GoC and the sum of MF activity showed nearly identical temporal characteristics, as well as weak directional tuning at movement onset. It should be emphasized that the actual number of MFs projecting directly to each GoC is at least 10 times larger than our population of MFs, and the indirect MF inputs to each GoC via GrCs are even more numerous. We conclude that the stereotyped lack of directionality of GoC activity may arise from a nonselective integration of local MF inputs, at least in the lateral part of lobules V and VI.
Comparison of Averaged Activity Patterns of the Cerebellar Neurons
To evaluate whether the average activity of each neuron type matched the individual examples provided in Figs. 6 and 7, we normalized the firing rate of each neuron and created an average of normalized firing rate for each cell type (Fig. 12A). The average MF activity exhibited a clear and deep directional modulation (R2 = 0.86, gray curve in Fig. 12B, MF). Moreover, the PDs of MF activity remained stable throughout the task (Fig. 12A, MF). Interestingly, the summation of MF activities (Fig. 11A) did not show directional tuning. Together, Figs. 12, A and B, MF, and 11A indicate that the PDs of MFs were widely distributed. In contrast, for GoCs, the main activity appeared briefly in the ±100 ms around movement onset (Fig. 12A, GoC), and their average normalized activities exhibited a shallow modulation (R2 = 0.46, Fig. 12B, GoC). At the output side of cerebellar cortex, the average of normalized SS activities of PCs also exhibited a deep directional modulation (R2 = 0.92, Fig. 12B, PC). However, PC activity was temporally more skewed than MF activity due to a spatially broad suppression of activity around movement onset, followed by a narrowly tuned and temporally delayed facilitation (Fig. 12A, PC). These average characteristics are in good agreement with our observations and individual examples described above.
DISCUSSION
To gain some insight into neural processing in the cerebellar cortex for limb motor control, we compared activities of its input, intermediate, and output elements, i.e., MFs, GoCs, and PCs, in lobules V and VI of the cerebellar cortex of monkeys performing step-tracking movements of the wrist joint. We found distinct patterns of activity for the three types of neurons. Three major features distinguished their activities. First, the strength of directional tuning was robust for MFs and PCs but incomparably weak for GoCs. Second, the temporal stability of directional tuning, indicated by PD, was relatively high for MFs throughout the execution of a wrist movement, whereas PDs of PCs demonstrated more abrupt and temporally focused changes in the same period. Third, the posture-dependent change of directional tuning for MFs demonstrated a bimodal distribution of shifts in PD for the change in the forearm posture from PRO to SUP, much like M1 neurons (Kakei et al. 1999), one group with smaller shifts in PD and the other group with larger shifts in PD. In contrast, PCs demonstrated a unimodal and intermediate distribution of shifts in PD for the same postural change. Overall, MFs, GoCs, and PCs demonstrated distinct movement representations. Based on these findings, we will discuss neural processing in the cerebellar cortex and its functional significance for motor control.
MF Activity Appears to Reflect M1 or PMv Neuron Activity as an “Efference Copy”
Because of the strong projections from M1 and PMv to cerebellar lobules V and VI via PN (Kelly and Strick 2003), we expected a high chance to record activity from task-related MFs (Fig. 6, A–C). However, we cannot exclude the possibility that some MFs recorded in this study originated from other precerebellar nuclei outside of PN. For instance, the nucleus reticularis tegmenti pontis receives a minor projection from cortical motor areas (Brodal 1980a; Leichnetz et al. 1984; Schmahmann et al. 2004) and sends sparse projections to lobules V–VI (Brodal 1980b, 1982) in the monkey. In addition, some MFs in this study may have received inputs from portions of PN with inputs from parietal cortex (e.g., Schmahmann et al. 2004).
Regardless of their origin, a number of the MFs recorded in this study demonstrated highly task-related activities in both postures. Both the spatio-temporal patterns (Fig. 6, A–C) and the reference frames of their activity (Fig. 10) were comparable to those of M1 or PMv neurons reported in our previous studies (Kakei et al. 1999, 2001). In addition, a great majority of the MFs initiated their activities (Fig. 8A) later than M1 or PMv neurons (Kakei et al. 1999, 2001) but slightly earlier than the onset of wrist muscle activity. This temporal difference suggests that the lateral part of cerebellar lobules V and VI may receive near copies of “motor commands” for limb movement from M1 and PM. Moreover, we observed delay activity in a number of MFs, consistent with a projection from PM as well as from parietal cortex (e.g., Chang et al. 2008; Crammond and Kalaska 1989). It should be noted that identification of “efference copies” or “copies of motor commands” in this experiment would be extremely difficult, if not impossible. It would require us to prove that MF activities arose from activities of cortico-motoneuronal and/or corticospinal cells in motor areas.
We observed that the proportion of directionally tuned MFs was somewhat smaller than we found for M1 and PMv neurons. This difference may be explained by the convergence of multiple cortico-pontine neurons with different PDs onto individual neurons in PN (or other precerebellar nuclei) (Baker et al. 1976; Glickstein 1997; Mower et al. 1979). Indeed, in the visual cortico-ponto-cerebellar projection system, PN neurons have much larger visual receptive fields than the cortico-pontine neurons (Glickstein 1997). Even so, the fact that almost half of MFs exhibited clear directional tuning indicates, not only convergence of heterogeneous, but also convergence of homogeneous information in PN.
Tziridis et al. (2012) recorded from hand movement-related neurons in dorsal PN and found that their movement-related activity showed various reference frames that were indistinguishable from those found in movement-related areas of both parietal and frontal cortices. We also observed that MFs in the lateral part of cerebellar lobules V and VI included information on both intrinsic and extrinsic coordinate frames, as we found in M1 and PMv. Thus it is clear that MF inputs to the cerebellum convey information in diverse reference frames. Furthermore, in developing new conceptual models for motor control of the limbs, it is necessary to consider the variety of coordinate frames encoded by inputs to the cerebellum from the cerebral cortex (which is considered as efference copy or “side-path of motor command”).
Origin of Weak Directional Tuning in GoCs
Weak directional tuning and large receptive fields for GoCs have been reported previously in the oculomotor vermis for saccadic eye movements (Prsa et al. 2009) and in crus I/II for somatosensory receptive fields (Holtzman et al. 2006; Vos et al. 1999). In this study, we observed modest directional activity in only three GoCs (3/25, 12%) in different windows (Fig. 8B). Moreover, the average of GoC activity showed only weak directionality (Fig. 12A GoC). Here we propose that this weak directionality could result from integration of local MF and parallel fiber (PF) inputs on GoCs if the population of inputs on the dendritic tree of a GoC contains a wide variety of activity patterns. Indeed, Jörntell and Ekerot (2002) showed that a local PF beam conveys sensory information from a receptive field large enough to cover almost the entire body. Furthermore, we showed that an average of even a relatively small population of MFs (n = 54) is enough to mimic the weak directional activity of GoCs (Fig. 11). These findings suggest that GoCs are not selective for their inputs and provide support for our proposal. In contrast, the directional activity of PCs may result from the influence of climbing fiber inputs, which use long-term depression to select specific PF inputs from a much larger number of synapses between PFs and an individual PC (>104, Palay and Chan-Palay, 1974).
GoCs May Filter out Noise from MF Inputs to Granule Cells
GoCs demonstrated a stereotyped temporal pattern of activity with a gradual increase followed by a gradual decrease around movement onset (Fig. 6D). One GoC provides inhibition to several thousand claws of GrCs (Fig. 1) (Ito 2006). Thus the stereotyped increase of GoC activity centered at movement onset provides a common negative offset for the task-related increase in MF inputs around movement onset (Fig. 6, A–C) at the level of the claws of GrC dendrites. This arrangement may help to facilitate feature extraction from MF inputs by improving the signal:noise ratio of selected inputs to GrCs during movement execution. Our data provide support for Marr's (1969) prediction that GoCs set the threshold of GrCs so that PCs do not receive too many inputs from PFs. Our results are also consistent with a recent proposal by Fujita (2013), based on the morphologic features of GoCs, that inhibition from GoCs helps to filter excitatory inputs to GrCs from MFs. Moreover, Yamazaki and Tanaka (2007) developed a large-scale spiking network model of the cerebellum. Their model indicated the importance of recurrent connections between GoCs and granule cells for the precise representation of passage of time by GrC activity and their PFs. Their insights also suggest that GoCs may have a role to play in selecting information in the PF-PC inputs and thereby may help to stabilize the information encoded by input signals to the cerebellum.
Temporal Change of Directional Tuning in SS Activity
Activities of both MFs and PCs are highly directional around movement onset (Fig. 8), as reported previously (Coltz et al. 1999; Prsa et al. 2009; Roitman et al. 2005; van Kan et al. 1993a, 1993b). Nevertheless, the dynamics of the directional tuning of MFs and PCs showed a striking difference. The PDs of MFs were relatively stable before and after execution of movement (Figs. 6, A and B, 8B, 9, and 12A). In contrast, the PDs of most PCs emerged suddenly right before movement onset and remained significant only for about 100 ms (Figs. 7–9). The strong, brief, and directionally wide suppression of PC activity that emerges about 50–100 ms before movement onset (Figs. 7, A and B, and 12A) plays a primary role in initiating the abrupt changes in PD. Furthermore, a close examination of the spatiotemporal patterns of PC activity (Fig. 7, C–H) suggests that a switch from suppression of activity to brief facilitation is critical for the change in directional tuning. It is well established that interneurons (INs), most notably basket cells, receive MF input through GrCs and exert strong inhibition on PCs (Eccles et al. 1966, Fox et al. 1967). Although we did not record the activity of these INs in the molecular layer, the strong, brief suppression of PC activity is a signature of those inhibitory INs (see also Ishikawa et al. 2014a). We propose that interplay between the direct excitatory PF input to PCs and the indirect inhibitory PF input through the INs is the mechanism that produces the abrupt changes of directional tuning of PC activity.
What is the functional meaning of the abrupt, brief changes in PD of PCs? In our previous studies, we did not find similar sudden changes in directional tuning among the task-related neurons in M1 or PMv (Kakei et al. 1999, 2001). We also did not find such changes in MFs recorded near the PCs. Therefore, the abrupt, brief shift in the PDs of PCs suggests the emergence of a new representation for control of movement in the activity of PCs. Furthermore, the brief change in directional tuning may provide a clue to identify what is represented by those PCs. In this regard, we note that afferent inputs from muscle spindles may demonstrate a change of activity mode during different periods of a motor task, as reported by Jones et al. (2001). These authors found that spindle afferents of extensor carpi radialis (ECR) exhibited a significant PD during voluntary step-tracking wrist movements but did not show a clear PD during voluntary position holding after the movement. This observation suggests the existence of dynamic mode changes in afferent inputs related to different types of movement kinematics. In addition, the modulation of spindle activities of ECR was not linear in different movement directions (Jones et al. 2001). The nonlinear properties of the response of peripheral afferents would be much greater in our monkeys because the step-tracking movements were four times larger in amplitude and ten times faster than the movements employed by Jones et al. (2001). We suggest that complex changes in afferent inputs, which are associated with the rapid, large changes in muscle length and muscle tension in our monkeys during task movements, may contribute to the abrupt, brief changes in directional tuning of PCs. In future studies we will need to address this issue by comparing neuron activity with various intrinsic parameters estimated from an elaborate model of the musculoskeletal system of the wrist joint.
Functional Implications of Distinct Coordinate Frames for Neuron Activity
When we compared activities of directionally tuned MFs and PCs in two arm postures, we found that PDs changed differently for MFs and PCs. MFs had a clearly bimodal distribution of shifts (Fig. 10A) that was quite similar to that for M1 neurons observed under the same experimental conditions (Kakei et al. 1999). Note that the group of MFs with smaller shifts in PD (left set in Fig. 10A) may include a contribution of extrinsic-like inputs, possibly from PMv neurons. In contrast, PCs had a wide but unimodal distribution of PD shifts (Fig. 10B). The average shift fell between the two peaks for MFs in Fig. 10A. Therefore, the activity of MFs as the primary input to the cerebellar cortex and the SS activity of PCs as the sole output from the cerebellar cortex clearly have different movement representations.
What is the significance of these distinctly different coordinate frame representations between MFs and PCs? One possibility is that PCs encode a composite representation of intrinsic and extrinsic reference frames (see Brayanov et al. 2012). Thus perhaps activity of different MFs can represent either extrinsic information about a target (or planned movement path) or intrinsic information about the arm. The PCs might integrate these MF activities to make a successful limb movement.
To provide insight into the type of information represented in SS activities, it will be important to analyze the relationship between various parameters of the musculo-skeletal system and the SS activities. One important parameter is muscle force, which varies in relation to both length and velocity of a muscle (see Zajac 1989 for a review). Another important parameter is the moment arm of individual muscles, which may vary by a factor of three as joint angles change during limb movements (Murray et al. 1995). Postural changes, as in the present study, would be expected to change these muscle parameters differently for individual forearm muscles. This is because each individual muscle is unique in the arrangement of its muscle fibers and in its origin and insertion. These intrinsic factors of the forearm muscles must create significant complexity in the relationship between muscle activities and resultant wrist joint torque/movement. A composite representation of SS activities may reflect this biomechanical complexity.
Conclusion
The present results provide a new perspective on the input-output organization of a region of the cerebro-cerebellum that is assumed to comprise a strong loop with M1 and PMv. We suggested that, in this region of the cerebellar cortex, the MF input provides information similar to outputs from the cortical motor areas (i.e., putative efference copies). On the other hand, we suggested that SS activity of PCs encodes wrist kinematics. Recently, Ebner and his colleagues also reported that SS activity of PCs encodes kinematics of the moving arm as well as error of movement with both predictive and feedback timing (Pasalar et al. 2006; Popa et al. 2012). We further found that the reference frame of the PCs differed from that of their inputs (MFs). Therefore, our results suggest that the cerebellum receives near copies of outputs from the cortical motor areas and computes changes to the framework of the inputs. Taken together, our observations show that the input-output organization of the cerebellar cortex during wrist movements appears to satisfy one of the requirements for a forward model (Wolpert and Miall 1996) although a convincing proof for the cerebellar forward model hypothesis itself remains to be provided.
GRANTS
This work was supported by the Tokyo Metropolitan Institute of Medical Science and Grants-in-Aid from the Japan Science and Technology Agency (PRESTO: Intelligent Cooperation and Control) and the Ministry of Education, Culture, Sports, Science and Technology (MEXT), KAKENHI to S. Kakei (no. 14580784, no. 15016008, no. 16015212, no. 20033029, no. 21500319, no. 26120003), T. Ishikawa (no. 24650224) and S. Tomatsu (no. 18700492, no. 20700478). This work was also supported by NBRP “Japanese Monkeys” through the National BioResource Project of the MEXT Japan.
DISCLOSURES
No conflicts of interest, financial or otherwise, are declared by the authors.
AUTHOR CONTRIBUTIONS
Author contributions: S.T., T.I., Y.T., J.L., and S.K. performed experiments; S.T. analyzed data; S.T. and S.K. interpreted results of experiments; S.T. prepared figures; S.T. and S.K. drafted manuscript; S.T., T.I., D.S.H., and S.K. edited and revised manuscript; S.T., T.I., Y.T., J.L., D.S.H., and S.K. approved final version of manuscript; S.K. conception and design of research.
ACKNOWLEDGMENTS
We thank Dr. Peter L. Strick for continuous encouragement during this research and for invaluable advice. We thank Drs. Hiroyuki Takuwa and Wataru Matsui for help in an initial part of the experiment. We thank Drs. Toshio Iijima and Kazuhiko Seki for their support.
REFERENCES
- Ambrosi G, Flace P, Lorusso L, Girolamo F, Rizzi A, Bosco L, Errede M, Virgintino D, Roncali L, Benagiano V. Non-traditional large neurons in the granular layer of the cerebellar cortex. Eur J Histochem 51, Suppl 1: 59–64, 2007. [PubMed] [Google Scholar]
- Baker J, Gibson A, Glickstein M, Stein J. Visual cells in the pontine nuclei of the cat. J Physiol 255: 415–433, 1976. [DOI] [PMC free article] [PubMed] [Google Scholar]
- Barmack NH, Yakhnitsa V. Functions of interneurons in mouse cerebellum. J Neurosci 28: 1140–1152, 2008. [DOI] [PMC free article] [PubMed] [Google Scholar]
- Bourbonnais D, Krieger C, Smith AM. Cerebellar cortical activity during stretch of antagonist muscles. Can J Physiol Pharmacol 64: 1202–1213, 1986. [DOI] [PubMed] [Google Scholar]
- Brayanov JB, Press DZ, Smith MA. Motor memory is encoded as a gain-field combination of intrinsic and extrinsic action representations. J Neurosci 32: 14951–14965, 2012. [DOI] [PMC free article] [PubMed] [Google Scholar]
- Brodal P. The cortical projection to the nucleus reticularis tegmenti pontis in the rhesus monkey. Exp Brain Res 38: 19–27, 1980a. [DOI] [PubMed] [Google Scholar]
- Brodal P. The projection from the nucleus reticularis tegmenti pontis to the cerebellum in the rhesus monkey. Exp Brain Res 38: 29–36, 1980b. [DOI] [PubMed] [Google Scholar]
- Brodal P. Further observations on the cerebellar projections from the pontine nuclei and nucleus reticularis tegmenti pontis in the rhesus monkey. J Comp Neurol 204: 44–55, 1982. [DOI] [PubMed] [Google Scholar]
- Chang SWC, Dickinson AR, Snyder LH. Limb-specific representation for reaching in the posterior parietal cortex. J Neurosci 28: 6128–6140, 2008. [DOI] [PMC free article] [PubMed] [Google Scholar]
- Coltz JD, Johnson MT, Ebner TJ. Cerebellar Purkinje cell simple spike discharge encodes movement velocity in primates during visuomotor arm tracking. J Neurosci 19: 1782–1803, 1999. [DOI] [PMC free article] [PubMed] [Google Scholar]
- Crammond DJ, Kalaska JF. Neuronal activity in primate parietal cortex area 5 varies with intended movement direction during an instructed-delay period. Exp Brain Res 76: 458–462, 1989. [DOI] [PubMed] [Google Scholar]
- Crammond DJ, Kalaska JF. Differential relation of discharge in primary motor cortex and premotor cortex to movements versus actively maintained postures during a reaching task. Exp Brain Res 108: 45–61, 1996. [DOI] [PubMed] [Google Scholar]
- Dean P, Porrill J. The cerebellum as an adaptive filter: a general model? Funct Neurol 25: 173–180, 2010. [PubMed] [Google Scholar]
- Ebner TJ, Pasalar S. Cerebellum predicts the future motor state. Cerebellum 7: 583–588, 2008. [DOI] [PMC free article] [PubMed] [Google Scholar]
- Eccles JC, Llinas R, Sasaki K. The mossy fibre-granule cell relay of the cerebellum and its inhibitory control by Golgi cells. Exp Brain Res 1: 82–101, 1966. [DOI] [PubMed] [Google Scholar]
- Eccles JC, Ito M, Szentagothai J. The Cerebellum as a Neuronal Machine. New York, NY: Springer, 1967. [Google Scholar]
- Espinoza E, Smith AM. Purkinje cell simple spike activity during grasping and lifting objects of different textures and weights. J Neurophysiol 64: 698–714, 1990. [DOI] [PubMed] [Google Scholar]
- Fisher NI, Lee AJ. A correlation coefficient for circular data. Biometrika 70: 327–332, 1983. [Google Scholar]
- Fox CA, Hillman DE, Siegesmund KA, Dutta CR. The primate cerebellar cortex: a Golgi and electron microscopic study. Prog Brain Res 25: 174–225, 1967. [DOI] [PubMed] [Google Scholar]
- Fujita M. New supervised learning theory applied to cerebellar modeling for suppression of variability of saccade end points. Neural Comp 25: 1440–1471, 2013. [DOI] [PubMed] [Google Scholar]
- Georgopoulos AP, Kalaska JF, Caminiti R, Massey JT. On the relations between the direction of two-dimensional arm movements and cell discharge in primate motor cortex. J Neurosci 11: 1527–1537, 1982. [DOI] [PMC free article] [PubMed] [Google Scholar]
- Glickstein M. Mossy-fibre sensory input to the cerebellum. Prog Brain Res 114: 251–259, 1997. [DOI] [PubMed] [Google Scholar]
- Hewitt AL, Popa LS, Pasalar S, Hendrix CM, Ebner TJ. Representation of limb kinematics in Purkinje cell simple spike discharge is conserved across multiple tasks. J Neurophysiol 106: 2232–2247, 2011. [DOI] [PMC free article] [PubMed] [Google Scholar]
- Hoffman DS, Strick PL. Step-tracking movements of the wrist. IV. Muscle activity associated with movements in different directions. J Neurophysiol 81: 319–333, 1999. [DOI] [PubMed] [Google Scholar]
- Holtzman T, Rajapaksa T, Mostofi A, Edgley SA. Different responses of rat cerebellar Purkinje cells and Golgi cells evoked by widespread convergent sensory inputs. J Physiol 574: 491–507, 2006. [DOI] [PMC free article] [PubMed] [Google Scholar]
- Ishikawa T, Tomatsu S, Tsunoda Y, Lee J, Hoffman DS, Kakei S. Releasing dentate nucleus cells from Purkinje cell inhibition generates output from the cerebrocerebellum. PLoS One 9: e108774, 2014a. [DOI] [PMC free article] [PubMed] [Google Scholar]
- Ishikawa T, Tomatsu S, Tsunoda Y, Hoffman DS, Kakei S. Mossy fibers in the cerebellar hemisphere show delay activity in a delayed response task. Neurosci Res 87: 84–89, 2014b. [DOI] [PubMed] [Google Scholar]
- Ito M. Cerebellar circuitry as a neuronal machine. Prog Neurobiol 78: 272–303, 2006. [DOI] [PubMed] [Google Scholar]
- Jones KE, Wessberg J, Vallbo AB. Directional tuning of human forearm muscle afferents during voluntary wrist movements. J Physiol 536: 635–647, 2001. [DOI] [PMC free article] [PubMed] [Google Scholar]
- Jörntell H, Ekerot CF. Reciprocal bidirectional plasticity of parallel fiber receptive fields in cerebellar Purkinje cells and their afferent interneurons. Neuron 34: 797–806, 2002. [DOI] [PubMed] [Google Scholar]
- Kakei S, Hoffman DS, Strick PL. Muscle and movement representations in the primary motor cortex. Science 285: 2136–2139, 1999. [DOI] [PubMed] [Google Scholar]
- Kakei S, Hoffman DS, Strick PL. Direction of action is represented in the ventral premotor cortex. Nat Neurosci 4: 1020–1025, 2001. [DOI] [PubMed] [Google Scholar]
- Kelly RM, Strick PL. Cerebellar loops with motor cortex and prefrontal cortex of a nonhuman primate. J Neurosci 23: 8432–8444, 2003. [DOI] [PMC free article] [PubMed] [Google Scholar]
- Kitazawa S, Kimura T, Yin PB. Cerebellar complex spikes encode both destinations and errors in arm movements. Nature 392: 494–497, 1998. [DOI] [PubMed] [Google Scholar]
- Leichnetz GR, Smith DJ, Spencer RF. Cortical projections to the paramedian tegmental and basilar pons in the monkey. J Comp Neurol 228: 388–408, 1984. [DOI] [PubMed] [Google Scholar]
- Lu X, Miyachi S, Ito Y, Nambu A, Takada M. Topographic distribution of output neurons in cerebellar nuclei and cortex to somatotopic map of primary motor cortex. Eur J Neurosci 25: 2374–2382, 2007. [DOI] [PubMed] [Google Scholar]
- Mano N, Yamamoto K. Simple-spike activity of cerebellar Purkinje cells related to visually guided wrist tracking movement in the monkey. J Neurophysiol 43: 713–728, 1980. [DOI] [PubMed] [Google Scholar]
- Marr D. A theory of cerebellar cortex. J Physiol 202: 437–470, 1969. [DOI] [PMC free article] [PubMed] [Google Scholar]
- Mehta B, Schaal S. Forward models in visuomotor control. J Neurophysiol 88: 942–953, 2002. [DOI] [PubMed] [Google Scholar]
- Mower G, Gibson A, Glickstein M. Tectopontine pathway in the cat: laminar distribution of cells of origin and visual properties of target cells in dorsolateral pontine nucleus. J Neurophysiol 42: 1–15, 1979. [DOI] [PubMed] [Google Scholar]
- Murray WM, Delp SL, Buchanan TS. Variation of muscle moment arms with elbow and forearm position. J Biomech 28: 513–525, 1995. [DOI] [PubMed] [Google Scholar]
- Ojakangas CL, Ebner TJ. Purkinje cell complex and simple spike changes during a voluntary arm movement learning task in the monkey. J Neurophysiol 68: 2222–2236, 1992. [DOI] [PubMed] [Google Scholar]
- Palay SL, Chan-Palay V. Cerebellar Cortex. New York, NY: Springer-Verlag, 1974. [Google Scholar]
- Pasalar S, Roitman AV, Durfee WK, Ebner TJ. Force field effects on cerebellar Purkinje cell discharge with implications for internal models. Nat Neurosci 9: 1404–1411, 2006. [DOI] [PubMed] [Google Scholar]
- Popa LS, Hewitt AL, Ebner TJ. Predictive and feedback performance errors are signaled in the simple spike discharge of individual Purkinje cells. J Neurosci 32: 15345–15358, 2012. [DOI] [PMC free article] [PubMed] [Google Scholar]
- Prsa M, Dash S, Catz N, Dicke PW, Thier P. Characteristics of responses of Golgi cells and mossy fibers to eye saccades and saccadic adaptation recorded from the posterior vermis of the cerebellum. J Neurosci 29: 250–262, 2009. [DOI] [PMC free article] [PubMed] [Google Scholar]
- Roitman AV, Pasalar S, Johnson MT, Ebner TJ. Position, direction of movement, and speed tuning of cerebellar Purkinje cells during circular manual tracking in monkey. J Neurosci 25: 9244–9257, 2005. [DOI] [PMC free article] [PubMed] [Google Scholar]
- Schmahmann JD, Rosene DL, Pandya DN. Motor projections to the basis pontis in rhesus monkey. J Comp Neurol 478: 248–268, 2004. [DOI] [PubMed] [Google Scholar]
- Simat M, Parpan F, Fritschy JM. Heterogeneity of glycinergic and gabaergic interneurons in the granule cell layer of mouse cerebellum. J Comp Neurol 500: 71–83, 2007. [DOI] [PubMed] [Google Scholar]
- Simpson JI, Hulscher HC, Sabel-Goedknegt E, Ruigrok TJ. Between in and out: linking morphology and physiology of cerebellar cortical interneurons. Prog Brain Res 148: 329–340, 2005. [DOI] [PubMed] [Google Scholar]
- Taylor A, Elias SA, Somjen G. Focal synaptic potentials due to discrete mossy-fibre arrival volleys in the cerebellar cortex. Proc R Soc Lond B Biol Sci 231: 217–230, 1987. [DOI] [PubMed] [Google Scholar]
- Thach WT. Discharge of Purkinje and cerebellar nuclear neurons during rapidly alternating arm movements in the monkey. J Neurophysiol 31: 785–797, 1968. [DOI] [PubMed] [Google Scholar]
- Tziridis K, Dicke PW, Thier P. The role of the monkey dorsal pontine nuclei in goal-directed eye and hand movements. J Neurosci 29: 6154–6166, 2009. [DOI] [PMC free article] [PubMed] [Google Scholar]
- Tziridis K, Dicke PW, Thier P. Pontine reference frames for the sensory guidance of movement. Cerebral Cortex 22: 345–362, 2012. [DOI] [PubMed] [Google Scholar]
- van Kan PL, Gibson AR, Houk JC. Movement-related inputs to intermediate cerebellum of the monkey. J Neurophysiol 69: 74–94, 1993a. [DOI] [PubMed] [Google Scholar]
- van Kan PL, Houk JC, Gibson AR. Output organization of intermediate cerebellum of the monkey. J Neurophysiol 69: 57–73, 1993b. [DOI] [PubMed] [Google Scholar]
- Vos BP, Volny-Luraghi A, De Schutter E. Cerebellar Golgi cells in the rat: receptive fields and timing of responses to facial stimulation. Eur J Neurosci 11: 2621–2634, 1999. [DOI] [PubMed] [Google Scholar]
- Vos BP, Volny-Luraghi A, Maex R, De Schutter E. Precise spike timing of tactile-evoked cerebellar Golgi cell responses: a reflection of combined mossy fiber and parallel fiber activation? Prog Brain Res 124: 95–106, 2000. [DOI] [PubMed] [Google Scholar]
- Walsh JV, Houk JC, Atluri RL, Mugnaini E. Synaptic transmission at single glomeruli in the turtle cerebellum. Science 178: 881–883, 1972. [DOI] [PubMed] [Google Scholar]
- Walsh JV, Houk JC, Mugnaini E. Identification of unitary potentials in turtle cerebellum and correlations with structures in granular layer. J Neurophysiol 37: 30–47, 1974. [DOI] [PubMed] [Google Scholar]
- Wolpert DM, Miall RC. Forward models for physiological motor control. Neural Netw 9: 1265–1279, 1996. [DOI] [PubMed] [Google Scholar]
- Wolpert DM, Ghahramani Z, Jordan MI. An internal model for sensorimotor integration. Science 269: 1880–1882, 1995. [DOI] [PubMed] [Google Scholar]
- Yamamoto K, Kawato M, Kotosaka S, Kitazawa S. Encoding of movement dynamics by Purkinje cell simple spike activity during fast arm movements under resistive and assistive force fields. J Neurophysiol 97: 1588–1599, 2007. [DOI] [PubMed] [Google Scholar]
- Yamazaki T, Tanaka S. A spiking network model for passage-of-time representation in the cerebellum. Eur J Neurosci 26: 2279–2292, 2007. [DOI] [PMC free article] [PubMed] [Google Scholar]
- Zajac FE. Muscle and tendon: properties, models, scaling, and application to biomechanics and motor control. Crit Rev Biomed Eng 17: 359–411, 1989. [PubMed] [Google Scholar]