Abstract
The aims of the study were to evaluate whether three-dimensional transvaginal ultrasound (3D TV US) is superior to two-dimensional transvaginal ultrasound (2D TV US) at visualising intrauterine devices and determining their position. This prospective study included 52 participants with an intrauterine device fitted, who underwent 2D TV US and 3D TV US. 2D TV US and 3D-reconstructed coronal images were reviewed by two gynaecological radiologists to assess ease of visualisation and position of the intrauterine devices. Statistical analysis was performed using Wilcoxon signed-rank, McNemar and Chi-squared tests. The inter-observer agreement was measured using Cohen’s Kappa. Intrauterine device visualisation scores were significantly higher with 2D TV US compared with 3D TV US (Radiologist 1 p = <0.001, Radiologist 2 p = 0.007). A significant number of T-arms appeared to perforate into the adjacent myometrium on the 3D-reconstructed coronal image, but were normal on the 2D images (Radiologist 1 p = <0.001, Radiologist 2 p = 0.008). Radiologist 1 found 19 perforated T-arms on 3D TV US compared with four on 2D TV US. Radiologist 2 found 13 perforated T-arms on 3D TV US compared with five on 2D TV US. Both radiologists agreed on the positions of the intrauterine devices substantially with 3D TV US (Kappa = 0.69) and moderately with 2D TV US (Kappa = 0.55). The 3D TV US did not visualise an intrauterine device better than 2D TV US. The 3D-reconstructed coronal image of the uterus can reliably display cases of T-arm perforation into the adjacent myometrium, which could be missed on 2D TV US images. The 3D TV US should be used in addition to 2D TV US in all cases where an intrauterine device is under evaluation.
Keywords: Three-dimensional ultrasound, intrauterine device, diagnostic technology, gynaecology, evaluation study
Introduction
Intrauterine devices (IUDs) are a safe, cost-effective method of contraception and can be used in the management of idiopathic menorrhagia.1,2 The majority consist of a T-shaped frame, either copper-containing or hormone based. The only hormone-based IUD currently available in the UK is the levonorgestrel-releasing intrauterine system (LNg-IUS) marketed as Mirena.3
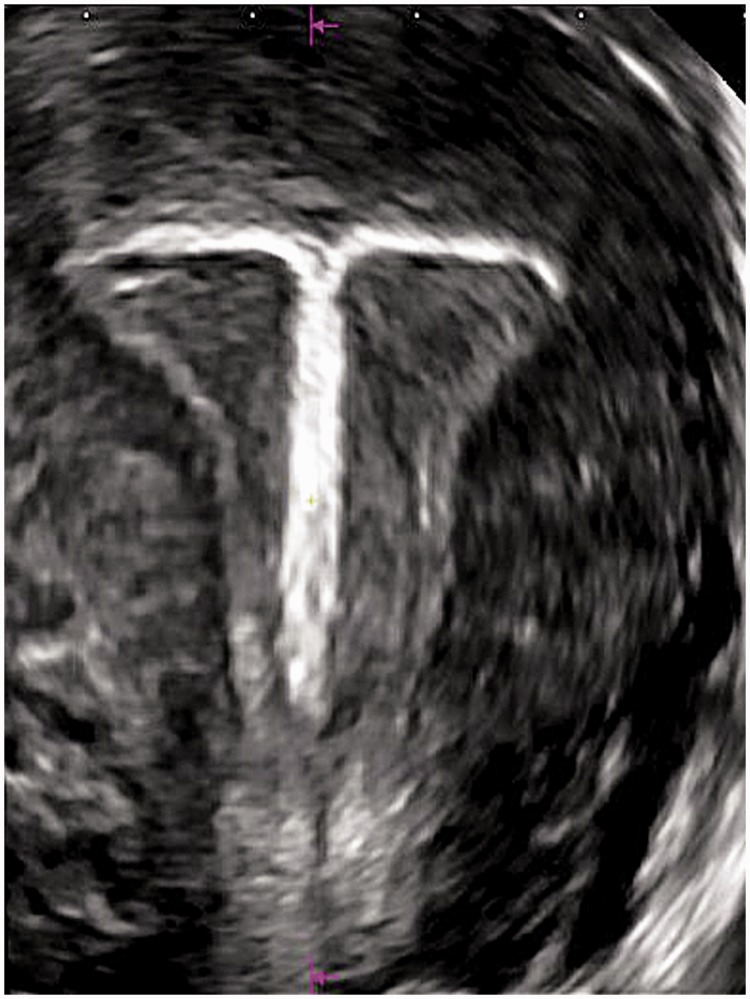
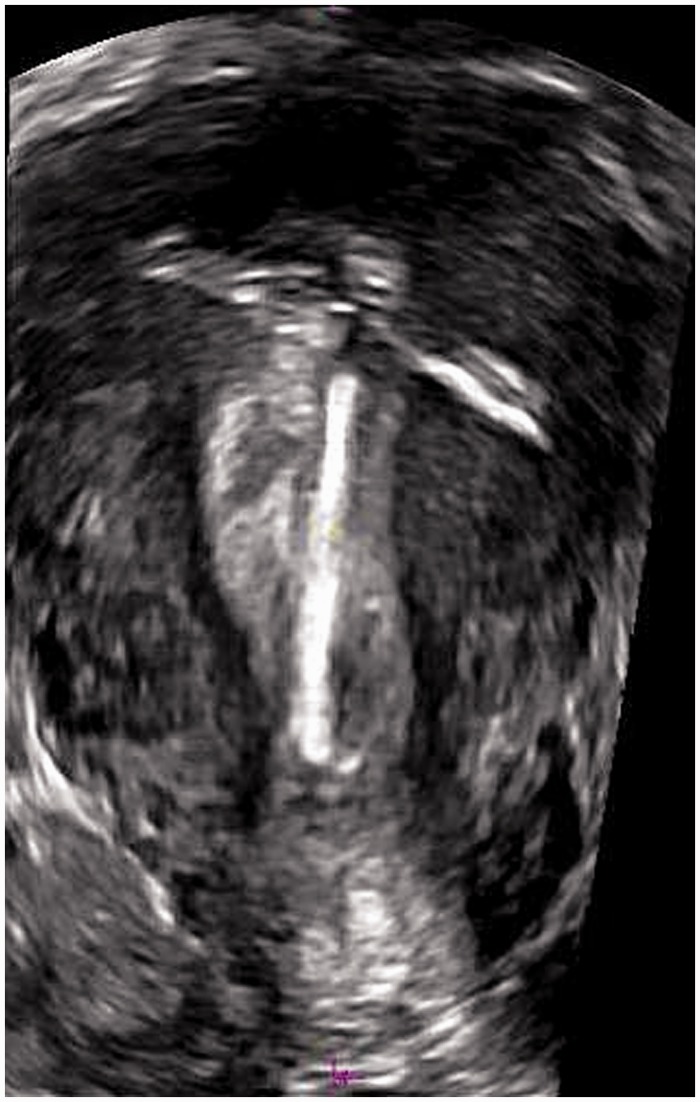
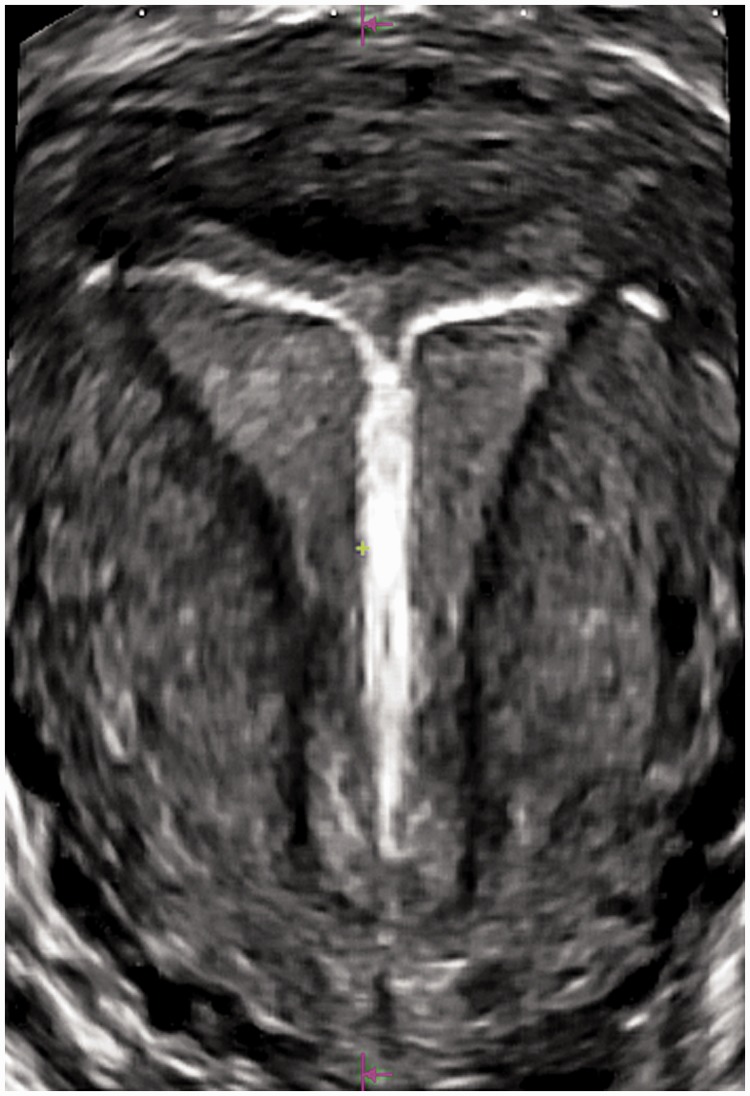
Diagnostic imaging plays an important role in the evaluation of IUDs, to visualise and assess if they are in the correct position to be effective and identify complications such as mal-position and perforation into, or even through, the myometrium.4 Traditionally, two-dimensional transvaginal ultrasound (2D TV US) is accepted as the best imaging technique to visualise and assess the position of an IUD within the uterus.5,6 2D TV US is usually limited to longitudinal and transverse slices through the uterus.7 Three-dimensional transvaginal ultrasound (3D TV US) produces a volume of data containing any desired anatomical plane through the uterus.8 This allows a reconstructed coronal slice through the uterus to be commonly produced with 3D TV US, which is rarely seen with 2D TV US. The 3D-reconstructed coronal image can demonstrate the entire IUD in relation to the endometrial cavity, helping to rule out associated complications (Figure 1).9
Figure 1.
3D-reconstructed coronal section of the uterus with an intrauterine device normally situated within the endometrial cavity
Previous studies have evaluated the incidence of abnormally positioned IUDs on the 3D-reconstructed coronal image; however, evaluation of the Mirena and inter-observer agreement in categorising the position of an IUD on the 3D-reconstructed coronal image is limited.9,10 The objectives of this study were to evaluate whether 3D TV US is superior to 2D TV US at visualising IUDs and determining their position.
Methods
Ethical and governance approval were obtained from the National Research Ethics Committee (Ref: 11/NE/0308) and the Local Research and Development Office (RD11/9983). The prospective study was performed in a teaching hospital from October 2011 to January 2012.
The data collection period was restricted to 10 weeks due to practice limitations. Fifty-two participants had a 3D TV US at the same time as their routine 2D TV US scan. The inclusion criteria were women aged 16 to 60 who required a pelvic ultrasound scan and had an IUD in place. The type of IUD and participant demographics were recorded, including parity, history of previous caesarean section, having the IUD fitted within six months postpartum and clinical indications for the scan. All of the ultrasound scans were carried out by the principal researcher, ultrasonographer Nicola Kerr, using a Toshiba Aplio 300™ ultrasound machine and 4.7–8.8 MHz Convex 4D/PTV-681MV transducer (Toshiba Medical plc. Crawley, UK). The B-mode image was optimised by using spatial compound imaging, precision imaging and differential tissue harmonic imaging. The dynamic range was set at 65 dB and one focal zone was set at the level of the IUD.
The 2D TV US images were acquired first. With the transducer positioned in the sagittal plane of the body, a minimum of two longitudinal sections of the uterus were recorded demonstrating the IUD in relation to the endometrial cavity. The transducer was then turned 90° to the right, and two transverse sections of the uterus were recorded. Further images could be stored to ensure the IUD was displayed to its full potential. The 3D TV US images were acquired by displaying a B-mode image of a longitudinal section through the uterus with the IUD in the midline. The ‘region of interest’ was set to include the whole of the uterus, and the angle of acquisition was set at 80°. To optimise spatial resolution, the resolution was set to a maximum of 7. The 3D TV US was initiated and the transducer automatically swept through the outlined region, taking approximately 5 seconds.11 Postprocessing was applied to the 3D volumes to create the reconstructed coronal section through the uterus.12 The 3D-reconstructed coronal images were saved for the review process as a ‘bookmark’ allowing the image to be rotated into different planes.
Two radiologists with over 10 years’ experience in gynaecology ultrasound assessed the images using an evaluation form and five-point scoring system. The five-point scoring system was developed to quantitatively analyse how well the IUD was visualised. The higher the score the better the IUD was visualised.
The scoring assigned:
3 points if the entire stem was visualised
0.5 of a point for part of the stem visualised
1 point for each entire T-arm visualised
0.5 of a point if part of each T-arm was seen.
Normally positioned IUDs were defined as follows:
No part of the IUD should extend beyond the endometrium into the myometrium;
The IUD should not be transverse or rotated in the endometrial cavity;
No part of the IUD should be situated in the cervix apart from the strings.
For training purposes, both radiologists did a pilot study reviewing images from patients not included in this study. All images were reviewed in a random order and the radiologists were blinded to the each other’s responses and the demographic information. To reduce bias, the review process was in the same room, on the same computer monitors and under the same lighting conditions.13
All statistical analyses were performed using the Statistical Package for the Social Sciences (SPSS) software version 19 (Chicago, USA). The Wilcoxon signed-rank test was used to establish the difference between IUD scores with 2D TV US and 3D TV US. Comparison between normally and abnormally positioned T-arms with 2D TV US and 3D TV US was calculated with McNemar’s test. The Chi-squared test for independence was used to test for associations between abnormally positioned IUDs seen with 3D TV US and participant demographics, where the null hypothesis was that there is no association between the two variables. The inter-observer agreement between the two radiologists was measured using Cohen’s Kappa.
Results
Fifty-two patients who required a pelvic ultrasound scan and had an IUD in place participated in this study. Two participants who both presented with menorrhagia were excluded, because the IUD was not present in the endometrial cavity. Thirty-four (68%) participants had a Mirena IUD fitted and 16 (32%) had a copper IUD fitted.
The median visualisation scores by both radiologists for copper and Mirena IUDs with 2D TV US and 3D TV US are shown in Table 1. The visualisation scores were significantly higher with 2D TV US compared to 3D TV US (Radiologist 1 p = <0.001, Radiologist 2 p = 0.007). Copper IUDs were visualised better, with higher scores compared with the Mirena.
Table 1.
Median visualisation scores by both radiologists for Copper and Mirena IUDs with 2D TV US and 3D TV US
| Radiologist 1 |
Radiologist 2 |
|||
|---|---|---|---|---|
| Copper | Mirena | Copper | Mirena | |
| 2D TV US | 5 | 4.5 | 5 | 3.25 |
| 3D TV US | 4.75 | 3 | 5 | 3 |
The higher the score, the better the IUD is visualised, with a maximum score of 5 achievable
2D TV US: two-dimensional transvaginal ultrasound; 3D TV US: three-dimensional transvaginal ultrasound
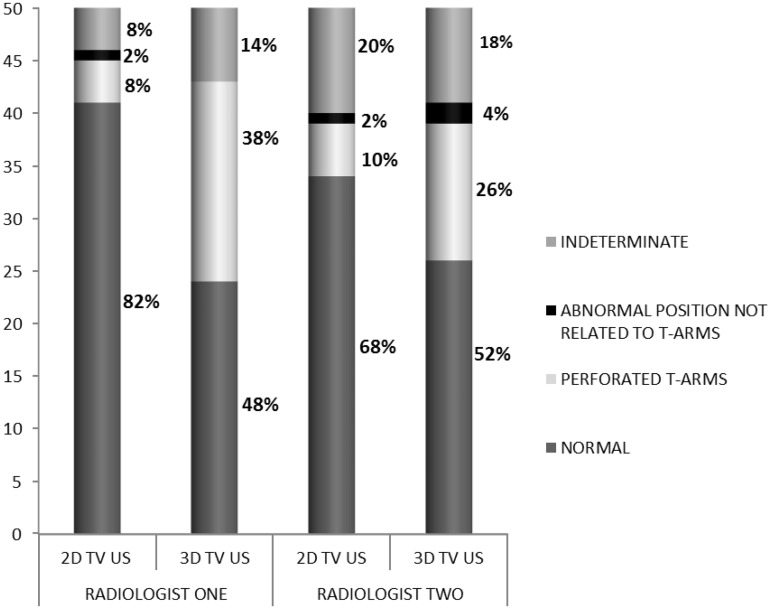
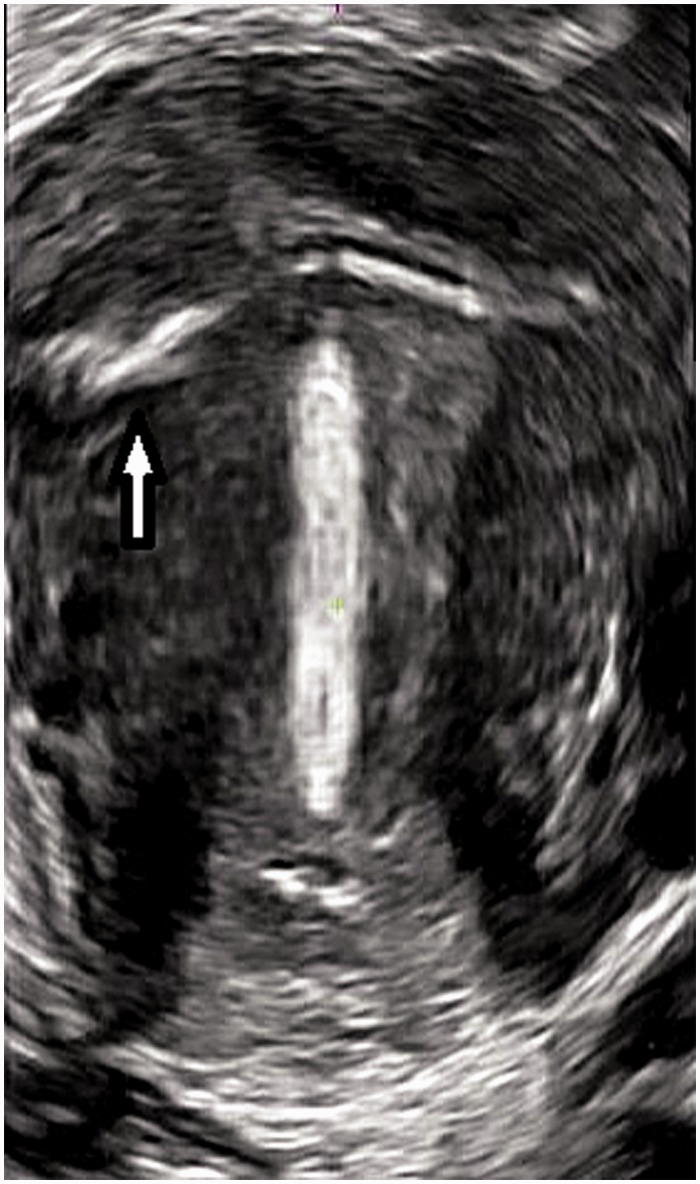
Figure 2 demonstrates the positions of IUDs categorised by both radiologists on 2D TV US and 3D TV US. This shows that a significant number of T-arm ends appeared to perforate into the adjacent myometrium on the 3D-reconstructed coronal image (Figure 3), but were normal on the 2D images (Radiologist 1 p = <0.001, Radiologist 2 p = 0.008). Radiologist 1 found 19 perforated T-arms on 3D TV US compared with four on 2D TV US. Radiologist 2 found 13 perforated T-arms on 3D TV US compared with five on 2D TV US. All of the indeterminate positioned IUDs shown in Figure 2 were Mirena IUDs and were inadequately visualised due to poor echogenicity and partial views of the device.
Figure 2.
Stack graph demonstrating the position of all 50 participants’ IUDs categorised by both radiologists on 2D TV US and 3D TV US
Figure 3.
3D-reconstructed coronal section of the uterus demonstrating perforation of the right T-arm (arrow) into the adjacent myometrium
Table 2 shows the clinical indications for the scan. There were no associations between abnormally positioned IUDs seen with 3D TV US and the following clinical indications:
abnormal bleeding (intermenstrual bleeding, post-coital bleeding and menorrhagia) (Radiologist 1 p = 0.71, Radiologist 2 p = 0.27);
pain, including dyspareunia (Radiologist 1 p = 0.87, Radiologist 2 p = 0.36);
IUD localisation (Radiologist 1 p = 0.46, Radiologist 2 p = 0.87).
Table 2.
Participant clinical indications for the pelvic ultrasound scan
| Indications for the scan | Number |
|---|---|
| Localisation | 25 |
| Pelvic pain | 18 |
| Intermenstrual bleeding | 8 |
| Menorrhagia | 8 |
| Dysmenorrhoea | 0 |
| Dyspareunia | 2 |
| Suspected ovarian pathology | 9 |
| Suspected fibroids | 1 |
| Endometriosis | 1 |
| Suspected endometrial pathology | 2 |
| Post-coital bleeding | 4 |
| Other | 5 |
The participant demographics are shown in Table 3. No associations were seen between abnormally positioned IUDs on 3D TV US and parity (Radiologist 1 p = 0.306, Radiologist 2 p = 0.199), history of previous caesarean section (Radiologist 1 p = 0.834, Radiologist 2 p = 0.866) or having an IUD fitted within six months postpartum (Radiologist 1 p = 0.161, Radiologist 2 p = 0.482).
Table 3.
Participant demographics
| Participant demographics | Number |
|---|---|
| Parity | |
| Nulliparae | 16 |
| Primipara or more | 34 |
| History of previous Caesarean section | |
| Yes | 10 |
| No | 40 |
| IUD fitted within 6 month postpartum | |
| Yes | 8 |
| No | 42 |
IUD: intrauterine device
Both radiologists agreed on the position (normal or abnormal) of an IUD substantially (Kappa = 0.69) with 3D TV US and moderately (Kappa = 0.55) with 2D TV US. A higher percentage of copper IUDs (Radiologist 1 50%; Radiologist 2 44%) were abnormally positioned on 3D TV US compared with Mirena IUDs (Radiologist 1 29%; Radiologist 2 24%); however, this was not statistically significant (p = 0.079).
Discussion
IUDs imaged in this study were visualised significantly better with 2D TV US images compared to the 3D-reconstructed coronal images (Radiologist 1 p = <0.001, Radiologist 2 p = 0.007). This is in contrast with previous studies, which have found that the 3D-reconstructed coronal image improves the visualisation of an IUD and demonstrates the entire IUD in relation to the uterine cavity.9,10,12 Previous studies have been retrospective, with limited 2D TV US images of the IUD recorded. Moschos and Twickler14 reviewed a single longitudinal and transverse image of an IUD with 2D TV US and Benacerraf et al.9 reviewed a single longitudinal 2D TV US image of an IUD stem, with no 2D TV US images of the T-arms recorded. Our study used a prospective design to acquire multiple images of the IUDs, which may account for why we visualised IUDs better with 2D TV US.
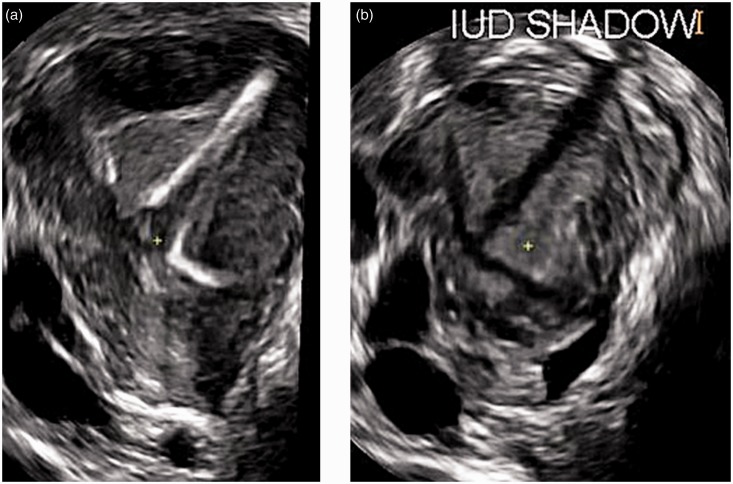
We showed that copper IUDs were visualised more clearly on 2D TV US and 3D TV US compared with Mirena IUDs. Other studies have shown that copper IUDs are easier to visualise with ultrasound, whereas imaging of Mirena IUDs is not as accurate and requires higher operator skill.6,14,15 All of the indeterminately positioned IUDs shown in Figure 2 were Mirena IUDs and were inadequately visualised due to poor echogenicity and partial views of the device. Valsky et al.16 found that the IUD acoustic shadow on the 3D-reconstructed coronal image can give a good clue to its location. This technique may aid in determining the position of Mirena IUDs, which are difficult to visualise (Figure 4).
Figure 4.
3D-reconstructed coronal section of the uterus demonstrating a rotated IUD with the tip of the stem situated in the left cornual region and T-arms facing down towards the cervix (a); and the acoustic shadow of the IUD (b)
The major finding was the proportion of T-arm ends which appear to perforate the adjacent myometrium on the 3D-reconstructed coronal image (Figure 3), but appeared normal on the 2D TV US images (Radiologist 1 p = <0.001, Radiologist 2 p = 0.008). Benacerraf et al.9 found 28 of 167 (16.8%) participants in their study had T-arms abnormally located within the myometrium on the 3D-reconstructed coronal image, which were missed with 2D TV US. Both radiologists in our study found a higher number of Copper IUDs were abnormally positioned on 3D TV US compared with Mirena IUDs; however, this was not statistically significant (p = 0.079). Shipp et al.17 recognised the incidence of T-arm perforation on the 3D-reconstructed coronal image and investigated the width of the endometrial cavity on the 3D-reconstructed image in women with an IUD fitted. They found a smaller fundal endometrial cavity was more likely (p = 0.0003) to have IUD T-arm perforation into the adjacent myometrium. Copper IUDs vary in width and length, but there is only one size available in the Mirena IUD, which is 32 mm in width and length.17 Belgian research organisation control is developing two smaller sized T-shaped levonogestrel-releasing IUDs, called the Femilis and Femilis Slim.18 The Femilis is designed for parous women, measuring 24 mm in width and Femilis Slim is designed for nulliparous women, measuring 20 mm in width. The introduction of these smaller IUDs may reduce the number of T-arm perforations.
We showed that abnormally positioned IUDs were not associated with parity, history of previous caesarean section, having the IUD fitted within six months postpartum or clinical indications for the scan (Tables 2 and 3). In contrast, Benacerraf et al.9 found that out of 28 patients with abnormally position T-arms, a significant number presented with bleeding or pain (p = 0.0001). The difference between the studies may be due to our smaller sample size.
Figure 5 demonstrates a 3D-reconstructed coronal image of the uterus in a participant who was diagnosed by both radiologists as having a unicornuate uterus with perforation of both T-arms into the myometrium, but was categorised as normal by both radiologists with 2D TV US. Multiple case studies show an association of congenital uterine anomalies with IUD complications.19–21 We believe the 3D-reconstructed coronal image may be helpful in identifying abnormally positioned IUDs in patients with congenital uterine anomalies.
Figure 5.
3D-reconstructed coronal section of a uterus with a unicornuate configuration associated with perforation of both T-arms into the adjacent myometrium
To our knowledge, this is the first study to use Cohen’s Kappa to rate the agreement between two observers categorising the position of an IUD with 2D TV US and 3D TV US. The radiologists agreed moderately (Kappa = 0.559) with 2D TV US and substantially (Kappa = 0.685) with 3D TV US, suggesting 3D TV US can be considered a more reliable diagnostic test for the categorisation of IUD position.
One limitation of this study is that we cannot provide pathological evidence that the abnormally positioned T-arms were actually penetrating into the myometrium. It is possible that some of the T-arms were indenting the adjacent myometrium by a few millimetres, or the T-arms were positioned in the interstitial portion of the fallopian tube. Another limitation to consider is that the 3D-reconstructed coronal image of the uterus is not routinely acquired in the assessment of an IUD’s position. This could result in misinterpretation of the IUD position due to its unfamiliar radiological appearance.
Despite these limitations, our study shows that 3D TV US should be used in addition to 2D TV US in all cases where an IUD is under evaluation. To do this, it is essential that 3D TV US equipment is available in all departments and ultrasound operators are trained on how to produce and interpret the 3D TV US data. There are no universally accepted guidelines available for the management of T-arm perforation into the adjacent myometrium in asymptomatic patients. Reporting T-arm perforation which is only by a few millimetres (Figure 6) should be treated with caution. It may be advisable to only report convincing cases of partial perforation which are more than 3 mm to prevent unnecessary removals, although, there is no evidence to support this opinion.
Figure 6.
3D-reconstructed coronal section of the uterus with minimal partial perforation (2–3 mm) of both T-arms into the adjacent myometrium
Conclusion
The 3D TV US did not visualise an IUD better than 2D TV US. The 3D-reconstructed coronal image of the uterus can reliably display cases of T-arm perforation into the adjacent myometrium, which could be missed on 2D TV US images. 3D TV US should be used in addition to 2D TV US in all cases where an IUD is under evaluation.
ACKNOWLEDGEMENTS
We are grateful to the radiologists from Leeds Teaching Hospitals NHS Trust, for reviewing the ultrasound images and providing the primary data in this study.
DECLARATIONS
Competing interests: The authors have no conflicts of interest to declare
Funding: None
Ethical approval: Ethical and governance approval were obtained from the National Research Ethics Committee (Ref: 11/NE/0308) and the Local Research and Development Office (RD11/9983).
Guarantor: NK
Contributorship: NK researched literature and conceived the study. JW and SW were academic supervisors. JW was involved in protocol development, gaining ethical approval, patient recruitment and data analysis. RD participated in data collection. NK wrote the first draft of the manuscript. All authors reviewed and edited the manuscript and approved the final version of the manuscript.
References
- 1.Faculty of Family Planning and Reproductive Health Care (FFPRHC) Guidance (January 2004). The copper intrauterine device as long-term contraception. J Fam Plann Reprod Health Care 2004; 30: 29–41. [DOI] [PubMed] [Google Scholar]
- 2.Faculty of Family Planning and Reproductive Health Care (FFPRHC) Guidance (April 2004). The levonorgestrel-releasing intrauterine system (LNG-IUS) in contraception and reproductive health. J Fam Plann Reprod Health Care 2004; 30: 99–109. [DOI] [PubMed] [Google Scholar]
- 3.National Institute for Health and Care Excellence. Clinical Knowledge Summaries: Contraception – IUS/IUD: Types of IUS. See http://cks.nice.org.uk/contraception-iusiud#!scenariorecommendation (accessed 4 August 2013).
- 4.Peri N, Graham D, Levine D. Imaging of intrauterine contraceptive devices. J Ultrasound Med 2007; 26: 1389–401. [DOI] [PubMed] [Google Scholar]
- 5.Bonilla-Musoles F, Pardo G, Simon C. How accurate is ultrasonography in monitoring IUD placement? J Clin Ultrasound 1990; 18: 395–9. [DOI] [PubMed] [Google Scholar]
- 6.Palo P. Transabdominal and transvaginal ultrasound detection of levonorgestrel IUD in the uterus. Acta Obstetricia et Gynecologica Scandinavica 1997; 76: 244–7. [PubMed] [Google Scholar]
- 7.Bates J. Practical Gynaecological Ultrasound, 2nd edn Cambridge: Cambridge University Press, 2006. [Google Scholar]
- 8.Bega G, Lev-Toaff AS, O’Kane P, et al. Three dimensional ultrasonography in gynecology: technical aspects and clinical applications (Review). J Ultrasound Med 2003; 22: 1249–69. [DOI] [PubMed] [Google Scholar]
- 9.Benacerraf B, Shipp T, Bromely B. Three-dimensional ultrasound detection of abnormally located intrauterine contraceptive devices which are a source of pelvic pain and abnormal bleeding. Ultrasound Obstet Gynecol 2009; 34: 110–5. [DOI] [PubMed] [Google Scholar]
- 10.Lee A, Eppel W, Sam C, et al. Intrauterine device localization by three dimensional transvaginal sonography. Ultrasound Obstet Gynecol 1997; 10: 289–92. [DOI] [PubMed] [Google Scholar]
- 11.Smith B. The Practical Application and Clinical Use of Modern 3D Ultrasound Technology in Gynaecology, Europe: Toshiba Medical Systems Corporation, 2011. [Google Scholar]
- 12.Abuhamad A. The Z technique: an easy approach to the display of the mid-coronal plane of the uterus in volume sonography. J Ultrasound Med 2006; 25: 607–12. [DOI] [PubMed] [Google Scholar]
- 13.Bell J. Doing Your Research Project: A Guide for First-Time Researchers in Education, Health and Social Science, Maidenhead: Open University Press, 2010. [Google Scholar]
- 14.Moschos E, Twickler DM. Does the type of intrauterine device affect conspicuity on 2D and 3D ultrasound? Am J Roentgenol 2011; 196: 1439–43. [DOI] [PubMed] [Google Scholar]
- 15.Van Schoubroeck D, Van Den Bosch T, Mortelman P, et al. Sonographic determination of the position of a levonorgestrel intrauterine device. Ultrasound Obstet Gynecol 2009; 33: 121–4. [DOI] [PubMed] [Google Scholar]
- 16.Valsky DV, Cohen SM, Hochner-Celnikier D, et al. The shadow of the intrauterine device. J Ultrasound Med 2006; 25: 613–6. [DOI] [PubMed] [Google Scholar]
- 17.Shipp TD, Bromley B, Benacerraf BR. The width of the uterine cavity is narrower in patients with an embedded intrauterine device (IUD) compared to a normally positioned IUD. J Ultrasound Med 2010; 29: 1453–6. [DOI] [PubMed] [Google Scholar]
- 18.Wildemeersch D, Janssens D, Andrade A. The Femilis LNG-IUS: contraceptive performance-an interim analysis. Euro J of Contracept Reprod Health Care 2009; 14: 103–10. [DOI] [PubMed] [Google Scholar]
- 19.Dikensoy E, Kutlar I, Gocmen A, et al. Two cases of uterine septum with intrauterine device. Br J Radiol 2005; 78: 952–3. [DOI] [PubMed] [Google Scholar]
- 20.Furst A, Harats H, Mor-Yosef S. Intrauterine contraceptive device and embryo sharing a bicornuate uterus: case report. Br J Gen Pract 1992; 42: 129–30. [PMC free article] [PubMed] [Google Scholar]
- 21.Tunçay YA, Tunçay E, Güzin K, et al. Transuterine migration as a complication of intrauterine contraceptive devices: six case reports. Eur J Contracept Reprod Health Care 2004; 9: 194–200. [DOI] [PubMed] [Google Scholar]


