

Abstract
Semiempirical quantum models are routinely used to study mechanisms of RNA catalysis and phosphoryl transfer reactions using combined quantum mechanical/molecular mechanical methods. Herein, we provide a broad assessment of the performance of existing semiempirical quantum models to describe nucleic acid structure and reactivity in order to quantify their limitations and guide the development of next-generation quantum models with improved accuracy. Neglect of diatomic diffierential overlap (NDDO) and self-consistent density-functional tight-binding (SCC-DFTB) semiempirical models are evaluated against high-level quantum mechanical benchmark calculations for seven biologically important data sets. The data sets include: proton affinities, polarizabilities, nucleobase dimer interactions, dimethyl phosphate anion, nucleoside sugar and glycosidic torsion conformations, and RNA phosphoryl transfer model reactions. As an additional baseline, comparisons are made with several commonly used density-functional models, including M062X and B3LYP (in some cases with dispersion corrections). The results show that, among the semiempirical models examined, the AM1/d-PhoT model is the most robust at predicting proton affinities. AM1/d-PhoT and DFTB3-3ob/OPhyd reproduce the MP2 potential energy surfaces of 6 associative RNA phosphoryl transfer model reactions reasonably well. Further, a recently developed linear-scaling “modified divide-and-conquer” model exhibits the most accurate results for binding energies of both hydrogen bonded and stacked nucleobase dimers. The semiempirical models considered here are shown to underestimate the isotropic polarizabilities of neutral molecules by approximately 30%. The semiempirical models also fail to adequately describe torsion profiles within the dimethyl phosphate anion, the nucleoside sugar ring puckers, and the rotations about the nucleoside glycosidic bond. The modeling of pentavalent phosphorus, particularly with thio substitutions often used experimentally as mechanistic probes, was problematic for all of the models considered. Analysis of the strengths and weakness of the models suggest that the creation of robust next-generation models should emphasize the improvement of relative conformational energies and barriers, and nonbond interactions.
Keywords: semiempirical methods, QM/MM, quantum mechanical force field, benchmark data, RNA catalysis
Introduction
Semiempirical quantum mechanical (QM) methods play an important role in theoretical chemistry by providing atomic and electronic levels of detail to complex chemical problems while retaining the computational efficiency necessary to routinely investigate large systems1-3 Semiempirical QM methods can be combined with molecular mechanical (MM) models to form QM/MM methods4,5, or linear-scaling quantum force fields (QMFFs)6,7 which are applied within molecular dynamics (MD) simulations to achieve the level of statistical sampling often necessary to make direct comparison with experiment. Semiempirical methods achieve their efficiency8,9 by replacing expensive multicenter integrals encountered in robust ab initio methods with computationally tractable approximations that are parametrized so that the resulting method retains suitably accurate small molecule geometries, heats of formation, and electronic properties. A broadly applicable semiempirical model can be made by parametrizing to a large set of reference data or by choosing parameters from theoretical arguments. Alternatively, specialized parameter sets can potentially achieve even higher accuracy for a limited subset of chemistry. New limitations or deficiencies in the model become apparent only through their application and testing to chemistries extending beyond the training set9. In this spirit, recent effort has been made to test and validate semiempirical methods10-17 to promote the development of new methods8,9,18-22, with particular emphasis on improving the description of biologically relevant systems and nonbonded interactions, such as hydrogen bonding and dispersion interactions20,23-30. In this work, we use large data sets related to biocatalysis, with particular emphasis on RNA catalysis31,32, to make extensive comparisons between neglect of diatomic diffierential overlap (NDDO) and self-consistent density-functional tight-binding (SCC-DFTB) semiempirical methods, including: PM79, PM619, AM1/d-PhoT18, AM133, DFTB3-3ob20, and DFTB2-mio34 and their closely related variations3,21,24,25,28,35 to high-level ab initio calculations.
The data sets are categorized as follows: proton affinities, polarizabilities, binding energies of nucleobase dimers, 2D conformational profiles of dimethyl phosphate anion (DMP), 2D conformational profiles of nucleoside sugar rings, 1D conformational profiles of nucleoside glycosidic torsions, and 2D (and 1D) energy surfaces of RNA phosphoryl transfer model reactions. The proton affinity and polarizability datasets are composed of a wide range of important molecules in biocatalysis36 involving amino acid side chain and backbone residues, nucleobases in both keto and enol tautomeric forms, A- and B-form nucleic acid riboses, and various phosphates and phosphoranes relevant to phosphoryl transfer reactions37 and RNA catalysis31,32,38. The complexes in the nucleobase dimer dataset are subcatego-rized into hydrogen bonding and dispersion interactions. These interactions are responsible for the flexible tertiary and quaternary structures of macromolecules and their function39. Dimethyl phosphate (DMP) is the simplest molecule to mimic the phosphodiester linkage in the highly charged nucleic acid backbone, which has been widely used as a model compound to simulate the properties of phosphate group40-43. Sugar rings are a key component of nucleic acids, which form the flexible link between the nucleic acid nucleobase and phosphate backbone44,45, The nucleobase and sugar ring are connected through a glycosidic bond, and the glycosidic torsion around this bond determines their relative orientation. The nucleoside sugar ring pucker conformation and glycosidic torsion play important roles in the structure and function of nucleic acids,46-50 and have been studied extensively with quantum electronic structure methods51-53. RNA phosphoryl transfer is a fundamental reaction51,54,55 in biology that is catalyzed by both proteins and RNA enzymes56-61.
The evaluation of the NDDO-based and SCC-DFTB semiempirical methods presents a clearer perspective of the strengths and weaknesses of the methods and provides insights for their usage and further improvement. The collected benchmark data sets also serve as an important tool for parametrization and/or verification of new computational methods.
Methods
The methods section is subdivided into subsections that describe details about the semiem-pirical and density-functional quantum mechanical models that are tested, and the reference data used for comparison (which in many cases involve high-level quantum calculations). The datasets used to compare the models and the ab initio methods used to construct the reference values are summarized in Table 1 and described in more detail below.
Table 1.
Benchmark data sets used and calculated in this work. PES stands for potential energy surface and “N” is the number of structures in each data set.
| Data set | N | level of theory |
|---|---|---|
| Proton affinity71 | 118 | CBS-QB3 |
| Polarizability | 58 | MP2/6-311++G(3df,2p)//MP2/6-31++G(d,p) |
| Nucleobase dimer76 | 34 | CCSD(T)/CBS//MP2/TZVPP and MP2/CBS//MP2/cc-pVTZ |
| 2D PES of DMP Conformation | 5184 | MP2/6-311++G(3df,2p)//MP2/6-31++G(d,p) |
| 2D PES of Sugar Conformation22 | 8×441 | MP2/6-311++G(3df,2p)//MP2/6-31++G(d,p) |
| 1D PES of Glycosidic Torsion | 8×72 | MP2/6-311++G(3df,2p)//MP2/6-31++G(d,p) |
| 2D PES of RNA Model Reaction | 2×441 | MP2/6-311++G(3df,2p)//MP2/6-31++G(d,p) |
| 1D PES of RNA Model Reaction | 6×111+69 | MP2/6-311++G(3df,2p)//MP2/6-31++G(d,p) |
Quantum Mechanical Models
The quantum mechanical models used for comparisons include the PM79, PM619, AM1/d-PhoT18, and AM133 neglect of diatomic differential overlap (NDDO) methods; the DFTB3-3ob20 and DFTB2-mio34 tight-binding methods; and the B3LYP62,63 and M062X64 density functional theory (DFT) methods. Many variations of these methods containing special corrections to improve the description of hydrogen bonds and dispersion interactions are also used in this manuscript. These variations include: PM6-DH+28, PM6-D365, AM1-D24,25, DFTB2-D35, DFTB2-γh8, the dispersion corrected DFT methods B3LYP-D365 and M062X-D365, and the long range corrected B3LYP methods CAM-B3LYP66 and CAM-B3LYP-D365,66. DFTB2-D-γh and DFTB3-D denote the DFTB2-γh and DFTB3-3ob methods augmented with the dispersion correction developed for DFTB2-D8, respectively. We note that PM7 natively includes hydrogen bonding and dispersion corrections9, and M062X has been parameterized to account for mid-ranged dispersion64. For brevity, we refer to AM1/d-PhoT, DFTB3-3ob, and DFTB2-mio as: AM1/d, DFTB3, and DFTB2, respectively, unless explicitly noted otherwise. In addition to the models above, which include modified functional forms, we also make use of some DFTB3 models with specialized parameters, which we label “DFTB3-NH”, “DFTB3-OP”, and “DFTB3-HNOP”. DFTB3-NH is equivalent to the DFTB3 “NHmix” model used in Ref. 8. Specifically, DFTB3-NH applies the reparametrized H-N tight binding matrix element splines developed in Ref. 20 to the sp3 hybridized nitrogens while retaining the DFTB3-3ob parameters for all other atom pairs. DFTB3-OP is equivalent to the DFTB3 “OPhyd” model developed in Ref. 21, which differs from standard DFTB3-3ob only through the use of reparametrized O-P tight binding matrix element splines. We note that the “OPhyd” DFTB3 parameters were specifically developed for improving the description of phosphate hydrolysis reactions21; however, we test their use outside of their original application area by applying them within proton affinity calculations, for example. We use DFTB3-HNOP as an abbreviation to denote a method that uses DFTB3-NH for nitrogen containing molecules and DFTB3-OP for phosphorous containing molecules.The recently developed mDC linear-scaling quantum mechanical force field2,3, which is based on DFTB3, is also included in the comparison of nucleobase dimer interactions.
Several density-functional methods, including B3LYP62,63 and M062X64 (including in some cases corrections for dispersion), post Hartree-Fock (MP2) and multi-level (CBS-QB3)67,68 methods were used in this work. All these ab initio calculations were performed using Gaussian 0969,70. The DFT calculations used an ultrafine numerical integration grid.
Proton Affinity Reference Data
The benchmark proton affinity data was systematically calculated at CBS-QB367,68 for the molecules studied in our previous work71, except for P(O)(SCH3)(O)(OH) −, which was excluded from the statistics because it often under went dissociation upon geometry optimization. The reference data was computed with CBS-QB3 because this level has previously been found to provide reliable proton affinities when compared to experiment71. With exception to the NDDO models, the proton affinity values were computed from approximate enthalpy differences corresponding to the reaction
| (1) |
upon geometry optimization at the corresponding level of theory. The enthalpy used for the ab initio methods and approximate DFTB methods were computed from standard normal mode analysis methods. The NDDO-based semiempirical methods, however, implicitly include enthalpic correction through the manner of their parametrization. The NDDO models underestimate the heat of formation of H+; therefore, the experimental value 367.2 kcal/mol was used in its place13,72-75.
A complete list of all proton affinities can be found in the Supporting Information. Table 3 summarizes the error statistics, including: the root mean square error (RMSE), the Pearson correlation coefficient (R) between the model and CBS-QB3 reference values, and the mean unsigned error (MUE) and mean signed error (MSE) and their corresponding standard deviations (STD). The error statistics in Table 3 and Figure 1 are divided into 6 categories. (1) The “amino acid” subset includes model compounds for amino acid site chain capped by a methyl group together with glycine and proline as amino acid backbone models. (2) The “nucleobase” subset contains multiple protonation sites of adenine (A), cytosine (C), guanine (G), thymine (T), and uracil (U). (3) The “nucleobase tautomer” subset are not technically proton affinities, but are instead the relative proton affinities between the two relevant tautomeric forms of the nucleobase. (4) The “ribose” subset contains three model compounds for the RNA ribose: 2-hydroxytetrahydrofuran (THF), 2-hydroxy-1,3,4-trimethyltetrahydrofuran (Methyl), and 2-hydroxy-1,4-dimethyl-3-methoxytetrahydrofuran (Ribose), which are successively more similar to the sugar ring of RNA. (5) The “phosphate” and (6) “phosphorane” subsets consist of metaphosphates, phosphates and phosphoranes representing vital states along the reaction path of RNA phosphoryl transfer reactions as well as their thio substituents, which are useful mechanism probes of ribozyme catalysis. In addition, the “adjusted phosphorane” set in Table 3 excludes the pentavalent phosphorus species that incorrectly geometry optimize to form tetravalent phosphorus compounds.
Table 3.
Error statistics of proton affinities (kcal/mol). The “adjusted phosphorane” set excludes the tetravalent phosphorus species that are supposed to be pentavalent. “N” is the number of such tetravalent phosphorus compounds in the phosphorane set.
| Error | M062X | B3LYP | AM1/d | AM1 | PM7 | PM6 | DFTB3-HNOP | DFTB3 | DFTB2 | |||||||||
|---|---|---|---|---|---|---|---|---|---|---|---|---|---|---|---|---|---|---|
| All Data
|
||||||||||||||||||
| RMSE (R) | 1.1 | (1.00) | 1.6 | (1.00) | 4.9 | (1.00) | 7.4 | (1.00) | 12.2 | (0.99) | 9.2 | (1.00) | 11.2 | (0.99) | 15.4 | (0.99) | 16.3 | (0.99) |
| MUE (STD) | 0.9 | (0.7) | 1.2 | (1.0) | 3.3 | (3.7) | 5.3 | (5.2) | 8.4 | (8.9) | 8.1 | (4.4) | 7.8 | (8.1) | 10.0 | (11.7) | 10.4 | (12.6) |
| MSE (STD) | -0.0 | (1.1) | 0.7 | (1.4) | -0.3 | (4.9) | -0.7 | (7.4) | -6.8 | (10.1) | -7.5 | (5.3) | 2.7 | (10.9) | 0.5 | (15.4) | -5.6 | (15.3) |
|
| ||||||||||||||||||
| Amino Acid
|
||||||||||||||||||
| RMSE (R) | 1.1 | (1.00) | 1.1 | (1.00) | 4.3 | (1.00) | 6.1 | (1.00) | 7.0 | (1.00) | 7.8 | (1.00) | 5.8 | (1.00) | 6.1 | (1.00) | 13.4 | (1.00) |
| MUE (STD) | 1.0 | (0.5) | 0.9 | (0.7) | 3.2 | (2.9) | 5.4 | (2.8) | 6.4 | (2.9) | 6.9 | (3.6) | 5.2 | (2.7) | 5.6 | (2.5) | 10.6 | (8.2) |
| MSE (STD) | -0.7 | (0.8) | 0.3 | (1.1) | 0.2 | (4.3) | -1.3 | (5.9) | -6.4 | (2.9) | -6.3 | (4.6) | 5.2 | (2.7) | 2.8 | (5.5) | -9.4 | (9.6) |
|
| ||||||||||||||||||
| Nucleobase
|
||||||||||||||||||
| RMSE (R) | 1.2 | (1.00) | 2.0 | (1.00) | 3.3 | (1.00) | 3.3 | (1.00) | 9.7 | (1.00) | 9.6 | (1.00) | 10.5 | (1.00) | 10.5 | (1.00) | 7.2 | (1.00) |
| MUE (STD) | 0.8 | (0.8) | 1.6 | (1.2) | 2.7 | (2.0) | 2.5 | (2.2) | 8.4 | (4.8) | 8.0 | (5.3) | 9.6 | (4.4) | 9.6 | (4.4) | 5.1 | (5.0) |
| MSE (STD) | -0.5 | (1.1) | 1.6 | (1.3) | -0.0 | (3.3) | -1.4 | (3.0) | -7.8 | (5.8) | -6.8 | (6.8) | 9.0 | (5.4) | 9.0 | (5.4) | -4.2 | (5.8) |
|
| ||||||||||||||||||
| Nucleobase Tautomer
|
||||||||||||||||||
| RMSE (R) | 0.6 | (1.00) | 0.9 | (1.00) | 1.9 | (0.98) | 2.1 | (1.00) | 3.0 | (0.96) | 5.3 | (0.69) | 4.4 | (0.85) | 4.4 | (0.85) | 6.7 | (0.59) |
| MUE (STD) | 0.5 | (0.2) | 0.8 | (0.4) | 1.5 | (1.2) | 1.9 | (1.1) | 2.6 | (1.6) | 4.6 | (2.6) | 4.0 | (2.0) | 4.0 | (2.0) | 5.7 | (3.5) |
| MSE (STD) | -0.3 | (0.5) | 0.5 | (0.7) | 1.5 | (1.2) | 1.9 | (1.1) | 2.1 | (2.2) | 3.3 | (4.1) | -3.3 | (3.0) | -3.3 | (3.0) | -4.1 | (5.3) |
|
| ||||||||||||||||||
| Ribose
|
||||||||||||||||||
| RMSE (R) | 1.1 | (0.96) | 2.1 | (0.88) | 5.4 | (-0.51) | 4.8 | (0.93) | 3.8 | (0.68) | 8.7 | (0.72) | 7.3 | (0.94) | 7.3 | (0.94) | 1.6 | (0.96) |
| MUE (STD) | 0.8 | (0.7) | 1.8 | (1.2) | 4.1 | (3.5) | 4.6 | (1.6) | 3.1 | (2.2) | 8.4 | (2.4) | 7.2 | (1.4) | 7.2 | (1.4) | 1.3 | (1.0) |
| MSE (STD) | 0.3 | (1.0) | -1.5 | (1.5) | 3.8 | (3.8) | 4.6 | (1.6) | -3.0 | (2.4) | -8.4 | (2.4) | 7.2 | (1.4) | 7.2 | (1.4) | -1.3 | (1.0) |
|
| ||||||||||||||||||
| Phosphate
|
||||||||||||||||||
| RMSE (R) | 1.2 | (1.00) | 1.2 | (1.00) | 4.5 | (1.00) | 12.6 | (0.99) | 4.3 | (1.00) | 8.1 | (1.00) | 4.4 | (1.00) | 4.7 | (1.00) | 13.2 | (1.00) |
| MUE (STD) | 1.0 | (0.7) | 1.0 | (0.7) | 3.5 | (2.7) | 10.0 | (7.8) | 3.7 | (2.2) | 7.2 | (3.7) | 3.5 | (2.6) | 3.8 | (2.8) | 9.3 | (9.4) |
| MSE (STD) | 0.4 | (1.2) | 0.7 | (1.0) | 0.5 | (4.4) | 0.1 | (12.6) | 1.4 | (4.0) | -7.0 | (4.0) | 2.5 | (3.5) | 2.5 | (4.0) | 4.2 | (12.5) |
|
| ||||||||||||||||||
| Phosphorane
|
||||||||||||||||||
| RMSE (R) | 1.0 | (0.98) | 1.1 | (0.98) | 7.7 | (0.63) | 7.1 | (0.84) | 22.4 | (0.60) | 10.7 | (0.85) | 18.8 | (0.43) | 29.8 | (0.38) | 30.3 | (0.61) |
| MUE (STD) | 0.7 | (0.6) | 0.8 | (0.7) | 4.2 | (6.4) | 6.1 | (3.7) | 16.9 | (14.7) | 10.3 | (2.9) | 11.4 | (15.0) | 21.5 | (20.6) | 24.4 | (18.0) |
| MSE (STD) | 0.4 | (0.9) | 0.1 | (1.1) | -2.8 | (7.1) | -1.1 | (7.0) | -16.1 | (15.6) | -10.3 | (2.9) | -11.2 | (15.2) | -20.9 | (21.2) | -20.2 | (22.6) |
|
| ||||||||||||||||||
| Phosphorane (adjusted)
|
||||||||||||||||||
| RMSE (R) | 1.0 | (0.98) | 1.1 | (0.98) | 2.8 | (0.91) | 7.1 | (0.84) | 3.2 | (0.95) | 10.7 | (0.85) | 4.6 | (0.85) | 4.8 | (0.80) | 9.6 | (0.86) |
| MUE (STD) | 0.7 | (0.6) | 0.8 | (0.7) | 2.3 | (1.6) | 6.1 | (3.7) | 2.6 | (1.9) | 10.3 | (2.9) | 3.1 | (3.3) | 3.2 | (3.6) | 7.5 | (6.0) |
| MSE (STD) | 0.4 | (0.9) | 0.1 | (1.1) | -0.8 | (2.7) | -1.1 | (7.0) | -0.9 | (3.1) | -10.3 | (2.9) | -2.9 | (3.5) | -2.1 | (4.3) | 0.9 | (9.5) |
| N | - | - | 2 | - | 12 | - | 6 | 11 | 12 | |||||||||
Figure 1.

Mean unsigned error (MUE) and mean signed error (MSE) with their standard deviations (STD) of proton affinities (kcal/mol).
Polarizability Reference Data
Isotropic dipole polarizabilities of the neutral molecules within the proton affinity data set were computed with each method and compared to MP2/6-311++G(3df,2p)//MP2/6-31++G(d,p) results. The ab initio method polarizabilities were computed analytically within Gaussian 09, whereas the semiempirical model polarizabilities were computed through finite differentiation of the molecular dipole moment with respect to applied dipole field strength. Figure 2 and Table 4 summarizes the error statistics of isotropic polarizabilities, which are divided into 5 categories, including the “amino acid”, “nucleobase”, “ribose”, “phosphate” and “phosphorane” subsets as described in the proton affinity reference data section. A complete list of all isotropic polarizabilities are presented in the Supporting Information.
Figure 2.

Mean unsigned error (MUE) and mean signed error (MSE) with their standard deviations (STD) of isotropic polarizabilities (Bohr3).
Table 4.
Error statistics of isotropic polarizabilities (Bohr3).
| Error | M062X | B3LYP | PM7 | PM6 | AM1 | AM1/d | DFTB3 | DFTB2 | ||||||||
|---|---|---|---|---|---|---|---|---|---|---|---|---|---|---|---|---|
| All Data
|
||||||||||||||||
| RMSE (R) | 1.8 | (1.00) | 1.8 | (1.00) | 18.4 | (0.95) | 18.0 | (0.95) | 18.7 | (0.96) | 23.2 | (0.97) | 26.3 | (0.99) | 26.8 | (0.99) |
| MUE (STD) | 1.6 | (0.86) | 1.5 | (0.96) | 17.4 | (5.92) | 17.1 | (5.76) | 17.9 | (5.42) | 22.5 | (5.37) | 25.7 | (5.48) | 26.2 | (5.48) |
| MSE (STD) | -1.5 | (0.90) | 1.5 | (1.05) | -17.4 | (5.92) | -17.1 | (5.76) | -17.9 | (5.42) | -22.5 | (5.37) | -25.7 | (5.48) | -26.2 | (5.48) |
|
| ||||||||||||||||
| Amino Acid
|
||||||||||||||||
| RMSE (R) | 0.8 | (1.00) | 1.3 | (1.00) | 18.7 | (0.99) | 18.3 | (0.99) | 18.3 | (0.99) | 18.0 | (0.99) | 21.0 | (0.99) | 21.4 | (0.99) |
| MUE (STD) | 0.8 | (0.28) | 1.3 | (0.33) | 18.4 | (3.40) | 18.0 | (3.31) | 18.0 | (3.27) | 17.6 | (3.84) | 20.5 | (4.24) | 21.0 | (4.07) |
| MSE (STD) | -0.6 | (0.52) | 1.3 | (0.33) | -18.4 | (3.40) | -18.0 | (3.31) | -18.0 | (3.27) | -17.6 | (3.84) | -20.5 | (4.24) | -21.0 | (4.07) |
|
| ||||||||||||||||
| Nucleobase
|
||||||||||||||||
| RMSE (R) | 3.1 | (1.00) | 0.5 | (1.00) | 20.1 | (0.99) | 19.0 | (0.99) | 19.0 | (0.99) | 19.6 | (1.00) | 29.3 | (0.98) | 31.1 | (0.99) |
| MUE (STD) | 3.0 | (0.46) | 0.4 | (0.17) | 20.1 | (1.24) | 19.0 | (1.39) | 18.9 | (1.62) | 19.6 | (1.41) | 29.0 | (4.35) | 30.9 | (3.58) |
| MSE (STD) | -3.0 | (0.46) | 0.2 | (0.43) | -20.1 | (1.24) | -19.0 | (1.39) | -18.9 | (1.62) | -19.6 | (1.41) | -29.0 | (4.35) | -30.9 | (3.58) |
|
| ||||||||||||||||
| Sugar Pucker
|
||||||||||||||||
| RMSE (R) | 0.4 | (1.00) | 2.8 | (1.00) | 29.9 | (1.00) | 29.3 | (1.00) | 28.9 | (1.00) | 27.9 | (1.00) | 28.0 | (1.00) | 28.7 | (1.00) |
| MUE (STD) | 0.4 | (0.13) | 2.7 | (0.80) | 29.2 | (6.55) | 28.6 | (6.40) | 28.2 | (6.28) | 27.2 | (6.00) | 27.4 | (5.79) | 28.0 | (6.09) |
| MSE (STD) | -0.4 | (0.13) | 2.7 | (0.80) | -29.2 | (6.55) | -28.6 | (6.40) | -28.2 | (6.28) | -27.2 | (6.00) | -27.4 | (5.79) | -28.0 | (6.09) |
|
| ||||||||||||||||
| Phosphate
|
||||||||||||||||
| RMSE (R) | 1.7 | (1.00) | 1.5 | (1.00) | 13.8 | (0.96) | 13.5 | (0.96) | 15.1 | (0.94) | 22.4 | (0.95) | 25.5 | (0.96) | 25.4 | (0.96) |
| MUE (STD) | 1.6 | (0.37) | 1.3 | (0.66) | 13.2 | (3.97) | 12.9 | (3.88) | 14.4 | (4.53) | 22.0 | (4.53) | 25.0 | (5.28) | 24.9 | (4.94) |
| MSE (STD) | -1.6 | (0.37) | 1.2 | (0.77) | -13.2 | (3.97) | -12.9 | (3.88) | -14.4 | (4.53) | -22.0 | (4.53) | -25.0 | (5.28) | -24.9 | (4.94) |
|
| ||||||||||||||||
| Phosphorane
|
||||||||||||||||
| RMSE (R) | 1.5 | (1.00) | 2.6 | (1.00) | 15.4 | (1.00) | 15.9 | (1.00) | 17.5 | (0.99) | 27.8 | (1.00) | 28.0 | (1.00) | 28.1 | (0.99) |
| MUE (STD) | 1.5 | (0.32) | 2.5 | (0.72) | 15.3 | (1.29) | 15.8 | (1.90) | 17.5 | (1.64) | 27.7 | (2.82) | 27.8 | (3.69) | 27.9 | (3.62) |
| MSE (STD) | -1.5 | (0.32) | 2.5 | (0.72) | -15.3 | (1.29) | -15.8 | (1.90) | -17.5 | (1.64) | -27.7 | (2.82) | -27.8 | (3.69) | -27.9 | (3.62) |
Nucleobase Dimer Reference Data
The benchmark calculations of the nucleobase dimers were taken from the JSCH-2005 database76,77, whose reference interaction energies were calculated with CCSD(T)/CBS//MP2/TZVPP or MP2/CBS//MP2/cc-pVTZ, as described in Ref. 76. The hydrogen bonded or stacked dimers in this test set include only those neutral complexes from the JSCH-2005 database76,77 that result from geometry optimization; that is, we do not include the dimers placed in artificial geometries. A complete list of dimers and extended analysis are provided in the Supporting Information.
The nucleobase interactions are compared in two ways. Table 5, and Figures 3 and 4 compare the interactions upon geometry optimization of both the dimer and the monomers, whereas Table 6, and Figures 5 and 6 compare the interactions based on single point calculations of dimers evaluated using the reference structures without inclusion of monomer deformation energies.
Table 5.
Error statistics of binding energies (kcal/mol) of optimized nucleobase dimers. The “N” denotes the number of stacked dimers that devolved into hydrogen bonded configurations.
| Error | M062X-D3 | M062X | CAM-B3LYP-D3 | B3LYP-D3 | CAM-B3LYP | B3LYP | PM7 | PM6-DH+ | PM6-D3 | PM6 | ||||||||||
|---|---|---|---|---|---|---|---|---|---|---|---|---|---|---|---|---|---|---|---|---|
| All Data
|
||||||||||||||||||||
| RMSE (R) | 2.7 | (0.98) | 3.1 | (0.98) | 2.8 | (0.89) | 2.3 | (0.93) | 3.9 | (0.88) | 5.6 | (0.86) | 4.1 | (0.80) | 3.0 | (0.88) | 3.4 | (0.87) | 8.7 | (0.88) |
| MUE (STD) | 2.4 | (1.0) | 2.9 | (1.2) | 1.4 | (2.5) | 1.4 | (1.8) | 3.7 | (1.4) | 5.3 | (1.7) | 3.1 | (2.7) | 2.3 | (1.9) | 2.8 | (1.9) | 8.2 | (2.9) |
| MSE (STD) | 2.3 | (1.4) | 2.8 | (1.3) | -0.1 | (2.8) | 0.7 | (2.2) | 2.7 | (2.9) | 4.7 | (3.0) | -1.6 | (3.8) | 1.0 | (2.8) | 1.7 | (2.9) | 8.2 | (2.9) |
|
| ||||||||||||||||||||
| H-bonded
|
||||||||||||||||||||
| RMSE (R) | 2.8 | (0.99) | 3.3 | (0.99) | 0.9 | (0.99) | 1.4 | (0.99) | 3.7 | (1.00) | 5.4 | (0.99) | 3.2 | (0.86) | 2.6 | (0.94) | 3.0 | (0.96) | 9.0 | (0.97) |
| MUE (STD) | 2.6 | (1.0) | 3.2 | (1.0) | 0.8 | (0.5) | 1.1 | (0.8) | 3.6 | (0.9) | 5.3 | (1.2) | 2.7 | (1.8) | 2.1 | (1.5) | 2.6 | (1.4) | 8.7 | (2.5) |
| MSE (STD) | 2.6 | (1.0) | 3.2 | (1.0) | 0.6 | (0.7) | 1.1 | (0.9) | 3.6 | (0.9) | 5.3 | (1.2) | -1.1 | (3.1) | 1.3 | (2.2) | 2.4 | (1.7) | 8.7 | (2.5) |
|
| ||||||||||||||||||||
| Stacked
|
||||||||||||||||||||
| RMSE (R) | 1.1 | (0.99) | 1.1 | (0.99) | 7.8 | (0.98) | 5.6 | (0.69) | 5.3 | (0.96) | 6.6 | (0.80) | 8.1 | (0.97) | 5.2 | (0.66) | 5.6 | (0.98) | 5.7 | (0.97) |
| MUE (STD) | 1.0 | (0.5) | 1.0 | (0.5) | 6.1 | (4.9) | 3.7 | (4.2) | 4.2 | (3.3) | 5.4 | (3.8) | 6.1 | (5.3) | 3.8 | (3.6) | 4.2 | (3.6) | 4.6 | (3.4) |
| MSE (STD) | -0.5 | (1.0) | 0.5 | (1.0) | -4.9 | (6.1) | -1.7 | (5.3) | -4.1 | (3.4) | 0.2 | (6.6) | -5.3 | (6.1) | -1.1 | (5.1) | -3.5 | (4.3) | 4.6 | (3.4) |
| N | - | - | 2 | 1 | 4 | 4 | 2 | 1 | 2 | 2 | ||||||||||
|
| ||||||||||||||||||||
| Error | AM1-D | AM1/d | AM1 | mDC | DFTB3-D | DFTB3 | DFTB2-D-γh | DFTB2-D | DFTB2-γh | DFTB2 | ||||||||||
|
| ||||||||||||||||||||
| All Data
|
||||||||||||||||||||
| RMSE (R) | 5.1 | (0.85) | 8.3 | (0.84) | 11.6 | (0.86) | 1.0 | (0.99) | 5.2 | (0.90) | 7.1 | (0.86) | 3.6 | (0.91) | 4.6 | (0.97) | 5.6 | (0.86) | 6.6 | (0.87) |
| MUE (STD) | 4.7 | (2.1) | 7.8 | (2.9) | 11.2 | (3.2) | 0.9 | (0.5) | 4.9 | (1.9) | 6.8 | (2.3) | 3.2 | (1.8) | 4.1 | (2.0) | 5.2 | (2.1) | 6.2 | (2.3) |
| MSE (STD) | 4.1 | (3.0) | 7.7 | (3.3) | 11.2 | (3.2) | -0.1 | (1.0) | 4.6 | (2.5) | 6.5 | (3.0) | 2.7 | (2.5) | 4.1 | (2.0) | 4.7 | (3.0) | 6.0 | (2.9) |
|
| ||||||||||||||||||||
| H-bonded
|
||||||||||||||||||||
| RMSE (R) | 5.3 | (0.95) | 8.8 | (0.93) | 12.0 | (0.92) | 1.1 | (0.99) | 5.4 | (0.96) | 7.5 | (0.95) | 3.6 | (0.97) | 4.8 | (0.98) | 5.6 | (0.96) | 6.8 | (0.97) |
| MUE (STD) | 5.0 | (1.9) | 8.5 | (2.2) | 11.7 | (3.0) | 0.9 | (0.5) | 5.2 | (1.7) | 7.2 | (2.0) | 3.2 | (1.7) | 4.5 | (1.9) | 5.2 | (1.9) | 6.5 | (2.0) |
| MSE (STD) | 4.9 | (2.0) | 8.5 | (2.2) | 11.7 | (3.0) | -0.0 | (1.1) | 5.2 | (1.7) | 7.2 | (2.0) | 3.2 | (1.8) | 4.5 | (1.9) | 5.2 | (1.9) | 6.5 | (2.0) |
|
| ||||||||||||||||||||
| Stacked
|
||||||||||||||||||||
| RMSE (R) | 3.0 | (0.84) | 3.6 | (0.90) | 8.0 | (0.91) | 0.7 | (1.00) | 3.2 | (0.77) | 3.6 | (0.96) | 3.8 | (0.73) | 2.2 | (1.00) | 5.6 | (0.87) | 5.2 | (0.88) |
| MUE (STD) | 2.4 | (1.8) | 2.7 | (2.4) | 7.6 | (2.4) | 0.6 | (0.3) | 2.7 | (1.7) | 3.3 | (1.3) | 2.6 | (2.7) | 1.8 | (1.3) | 4.7 | (2.9) | 4.1 | (3.2) |
| MSE (STD) | -2.1 | (2.2) | 1.5 | (3.3) | 7.6 | (2.4) | -0.3 | (0.6) | 0.2 | (3.2) | 1.0 | (3.4) | -0.9 | (3.7) | 1.8 | (1.3) | 0.7 | (5.5) | 2.0 | (4.8) |
| N | 2 | 4 | 4 | - | 1 | 4 | 1 | - | 3 | 3 | ||||||||||
Figure 3.

Mean unsigned error (MUE) and mean signed error (MSE) with their standard deviations (STD) of the nucleobase dimer binding energies (kcal/mol) evaluated from geometry optimized dimers and monomers by using semiempirical models with dispersion correction.
Figure 4.

Mean unsigned error (MUE) and mean signed error (MSE) with their standard deviations (STD) of the nucleobase dimer binding energies (kcal/mol) evaluated from geometry optimized dimers and monomers by using semiempirical models without dispersion correction.
Table 6.
Error statistics of interaction energies (kcal/mol) of nucleobase dimers evaluated from single point calculations at the reference structure geometries.
| Error | M062X-D3 | M062X | CAM-B3LYP-D3 | B3LYP-D3 | CAM-B3LYP | B3LYP | PM7 | PM6-DH+ | PM6-D3 | PM6 | ||||||||||
|---|---|---|---|---|---|---|---|---|---|---|---|---|---|---|---|---|---|---|---|---|
| All Data
|
||||||||||||||||||||
| RMSE (R) | 1.2 | (0.98) | 1.5 | (0.99) | 1.1 | (1.00) | 0.6 | (1.00) | 4.0 | (0.92) | 6.2 | (0.86) | 2.9 | (0.90) | 1.6 | (0.97) | 1.7 | (0.98) | 8.2 | (0.98) |
| MUE (STD) | 1.1 | (0.6) | 1.4 | (0.4) | 1.0 | (0.5) | 0.6 | (0.3) | 3.0 | (2.7) | 5.1 | (3.5) | 2.4 | (1.7) | 1.2 | (1.0) | 1.5 | (0.8) | 8.0 | (1.4) |
| MSE (STD) | 0.5 | (1.1) | 1.1 | (1.0) | -0.9 | (0.7) | -0.4 | (0.5) | 3.0 | (2.7) | 5.1 | (3.5) | -1.0 | (2.8) | 0.5 | (1.5) | 1.1 | (1.3) | 8.0 | (1.4) |
|
| ||||||||||||||||||||
| H-bonded
|
||||||||||||||||||||
| RMSE (R) | 1.0 | (1.00) | 1.5 | (1.00) | 1.2 | (1.00) | 0.6 | (1.00) | 2.1 | (1.00) | 3.9 | (1.00) | 3.1 | (0.89) | 1.6 | (0.97) | 1.8 | (0.98) | 8.2 | (0.98) |
| MUE (STD) | 0.9 | (0.4) | 1.4 | (0.4) | 1.0 | (0.5) | 0.6 | (0.3) | 2.0 | (0.5) | 3.8 | (0.6) | 2.6 | (1.7) | 1.2 | (1.1) | 1.6 | (0.8) | 8.1 | (1.4) |
| MSE (STD) | 0.9 | (0.4) | 1.4 | (0.4) | -1.0 | (0.5) | -0.5 | (0.4) | 2.0 | (0.5) | 3.8 | (0.6) | -1.1 | (2.9) | 0.5 | (1.6) | 1.3 | (1.2) | 8.1 | (1.4) |
|
| ||||||||||||||||||||
| Stacked
|
||||||||||||||||||||
| RMSE (R) | 2.4 | (1.00) | 1.4 | (1.00) | 0.7 | (0.99) | 0.5 | (0.99) | 10.2 | (0.88) | 14.5 | (0.80) | 1.4 | (0.98) | 0.9 | (0.98) | 1.1 | (1.00) | 7.9 | (0.94) |
| MUE (STD) | 2.4 | (0.3) | 1.4 | (0.3) | 0.6 | (0.2) | 0.5 | (0.3) | 10.0 | (1.8) | 14.3 | (2.3) | 1.3 | (0.6) | 0.8 | (0.5) | 1.0 | (0.5) | 7.8 | (1.3) |
| MSE (STD) | -2.4 | (0.3) | -1.4 | (0.3) | 0.4 | (0.5) | 0.3 | (0.4) | 10.0 | (1.8) | 14.3 | (2.3) | 0.2 | (1.4) | 0.6 | (0.7) | -0.4 | (1.0) | 7.8 | (1.3) |
|
| ||||||||||||||||||||
| Error | AM1-D | AM1/d | AM1 | mDC | DFTB3-D | DFTB3 | DFTB2-D-γh | DFTB2-D | DFTB2-γh | DFTB2 | ||||||||||
|
| ||||||||||||||||||||
| All Data
|
||||||||||||||||||||
| RMSE (R) | 2.1 | (0.95) | 11.1 | (0.92) | 14.5 | (0.82) | 1.3 | (0.99) | 5.0 | (0.96) | 7.7 | (0.95) | 3.8 | (0.96) | 4.9 | (0.95) | 6.4 | (0.94) | 7.6 | (0.95) |
| MUE (STD) | 1.8 | (1.1) | 10.9 | (2.3) | 14.1 | (3.3) | 1.1 | (0.7) | 4.7 | (1.6) | 7.5 | (1.8) | 3.3 | (1.7) | 4.6 | (1.9) | 6.1 | (2.0) | 7.3 | (2.0) |
| MSE (STD) | 1.0 | (1.8) | 10.9 | (2.3) | 14.1 | (3.3) | -0.0 | (1.3) | 4.7 | (1.6) | 7.5 | (1.8) | 3.3 | (1.7) | 4.6 | (1.9) | 6.1 | (2.0) | 7.3 | (2.0) |
|
| ||||||||||||||||||||
| H-bonded
|
||||||||||||||||||||
| RMSE (R) | 2.1 | (0.96) | 11.1 | (0.93) | 14.3 | (0.85) | 1.3 | (0.99) | 5.2 | (0.98) | 7.3 | (0.97) | 4.0 | (0.97) | 5.2 | (0.97) | 6.0 | (0.96) | 7.3 | (0.96) |
| MUE (STD) | 1.8 | (1.1) | 10.8 | (2.3) | 13.9 | (3.4) | 1.1 | (0.7) | 5.0 | (1.4) | 7.1 | (1.6) | 3.6 | (1.6) | 4.9 | (1.7) | 5.7 | (1.8) | 7.0 | (1.9) |
| MSE (STD) | 1.3 | (1.7) | 10.8 | (2.3) | 13.9 | (3.4) | -0.0 | (1.3) | 5.0 | (1.4) | 7.1 | (1.6) | 3.6 | (1.6) | 4.9 | (1.7) | 5.7 | (1.8) | 7.0 | (1.9) |
|
| ||||||||||||||||||||
| Stacked
|
||||||||||||||||||||
| RMSE (R) | 1.6 | (1.00) | 11.7 | (0.88) | 16.4 | (0.86) | 1.5 | (0.97) | 2.3 | (0.99) | 9.9 | (0.93) | 1.4 | (1.00) | 1.8 | (1.00) | 9.1 | (0.97) | 9.5 | (0.96) |
| MUE (STD) | 1.4 | (0.8) | 11.5 | (2.4) | 16.2 | (2.3) | 1.3 | (0.8) | 2.2 | (0.6) | 9.9 | (1.2) | 1.4 | (0.3) | 1.7 | (0.5) | 9.1 | (0.8) | 9.4 | (0.9) |
| MSE (STD) | -1.3 | (0.9) | 11.5 | (2.4) | 16.2 | (2.3) | 0.1 | (1.5) | 2.2 | (0.6) | 9.9 | (1.2) | 1.4 | (0.3) | 1.7 | (0.5) | 9.1 | (0.8) | 9.4 | (0.9) |
Figure 5.

Mean unsigned error (MUE) and mean signed error (MSE) with their standard deviations (STD) of the nucleobase dimer interaction energies (kcal/mol) evaluated from single point calculations on the reference structure geometries by using semiempirical models with dispersion correction.
Figure 6.

Mean unsigned error (MUE) and mean signed error (MSE) with their standard deviations (STD) of the nucleobase dimer interaction energies (kcal/mol) evaluated from single point calculations on the reference structure geometries by using semiempirical models without dispersion correction.
2D Profiles of DMP Conformation Reference Data
The conformational energy profiles of dimethyl phosphate anion DMP are displayed in Figure 8 as 2D contours of the backbone torsion angles ζ and α (see Figure 7a). The contours were constructed by scanning and α in a series of constrained geometry optimizations from 0° to 360° in steps of 5°. The benchmark scans were performed using MP2/6-311++G(3df,2p)//MP2/6-31++G(d,p), which we shall refer to as MP2 henceforth, unless specifically noted otherwise.
Figure 8.

2D conformational contours of dimethyl phosphate anion DMP. The energy units along each contour curve are in kcal/mol and all energy values are calculated with respective to the global minimum.
Figure 7.

Definition of torsion angles in the (a) dimethyl phosphate anion and (b) nucleoside sugar ring. The sugar puckering parameters Zx and Zy are defined as, Zx = (ν1 + ν3)/(2cos(4π/5)) and Zy = (ν1 – ν3)/(2sin(4π/5)).
Table 7 lists the torsion angles and the relative energies of the minima and transition states of DMP. The minima labeled gg, tg, and tt denote gauche-gauche, trans-gauche and trans-trans conformations of DMP, respectively. Similarly, gg-tg, tg-tt, tg-gt, and tt-tt indicate the transition states connecting the two corresponding minima.
Table 7.
Torsion angles ζ and α (°), and relative energies ΔE (kcal/mol) of minima (gg, tg and tt) and transition states (gg-tg, tg-tt, tg-gt and tt-tt) of dimethyl phosphate anion (DMP).
| Methods | gg | tg | tt | gg-tg | tg-tt | tg-gt | tt-tt | ||||||||||||||
|---|---|---|---|---|---|---|---|---|---|---|---|---|---|---|---|---|---|---|---|---|---|
| ζ | α | ΔE | ζ | α | ΔE | ζ | α | ΔE | ζ | α | ΔE | ζ | α | ΔE | ζ | α | ΔE | ζ | α | ΔE | |
| MP2 | 69.9 | 69.9 | 0.0 | -162.3 | 69.3 | 1.7 | 151.5 | 151.5 | 3.7 | 130.6 | 69.9 | 2.6 | 157.5 | 126.6 | 3.8 | -87.3 | 87.3 | 2.8 | 180.0 | 180.0 | 3.7 |
| M062X | 70.1 | 70.1 | 0.0 | -166.4 | 70.1 | 1.5 | 154.7 | 154.7 | 3.5 | 133.1 | 70.7 | 2.5 | 159.1 | 132.3 | 3.6 | -85.5 | 86.0 | 2.6 | 180.0 | 180.0 | 3.4 |
| B3LYP | 73.6 | 73.6 | 0.0 | -167.2 | 71.6 | 1.1 | 148.1 | 148.1 | 2.8 | 132.3 | 73.3 | 1.9 | 154.7 | 130.7 | 2.8 | -88.1 | 88.1 | 2.2 | 180.0 | 180.0 | 2.9 |
| DFTB3-OP | 78.2 | 78.2 | 0.0 | -179.6 | 79.0 | 0.3 | 154.0 | 154.0 | 0.7 | 126.9 | 79.9 | 0.4 | 157.0 | 121.7 | 0.6 | - | - | - | 180.0 | 180.0 | 0.5 |
| DFTB3 | 79.0 | 79.0 | 0.0 | 179.6 | 80.0 | 0.3 | 160.3 | 160.3 | 0.4 | 126.6 | 81.2 | 0.4 | 157.9 | 121.9 | 0.5 | - | - | - | 180.0 | 180.0 | 0.4 |
| DFTB2 | 77.3 | 77.3 | 0.0 | - | - | - | - | - | - | - | - | - | - | - | - | - | - | - | 180.0 | 180.0 | 1.0 |
| PM7 | 66.7 | 66.7 | 0.0 | - | - | - | - | - | - | - | - | - | - | - | - | - | - | - | - | - | - |
| PM6 | 75.9 | 75.9 | 0.0 | - | - | - | - | - | - | - | - | - | - | - | - | - | - | - | - | - | - |
| AM1/d | 78.6 | 78.6 | 0.0 | - | - | - | - | - | - | - | - | - | - | - | - | - | - | - | - | - | - |
| AM1 | 78.6 | 78.6 | 0.0 | - | - | - | - | - | - | - | - | - | - | - | - | - | - | - | - | - | - |
2D Profiles of Sugar Conformation Reference Data
Figures 9 and 10 display sugar pucker energy profiles of the deoxyadenosine (dA), de-oxyguanosine (dG), deoxycytidine (dC), and thymidine (dT) DNA nucleosides and the adenosine (rA), guanosine (rG), cytidine (dC), and uridine (rU) RNA nucleosides, respectively. The Zx and Zy axis in these figures are “pucker parameters”, which are related to the proper torsions ν1 and ν3 in the sugar ring shown in Figure 7 by
| (2) |
| (3) |
Figure 9.
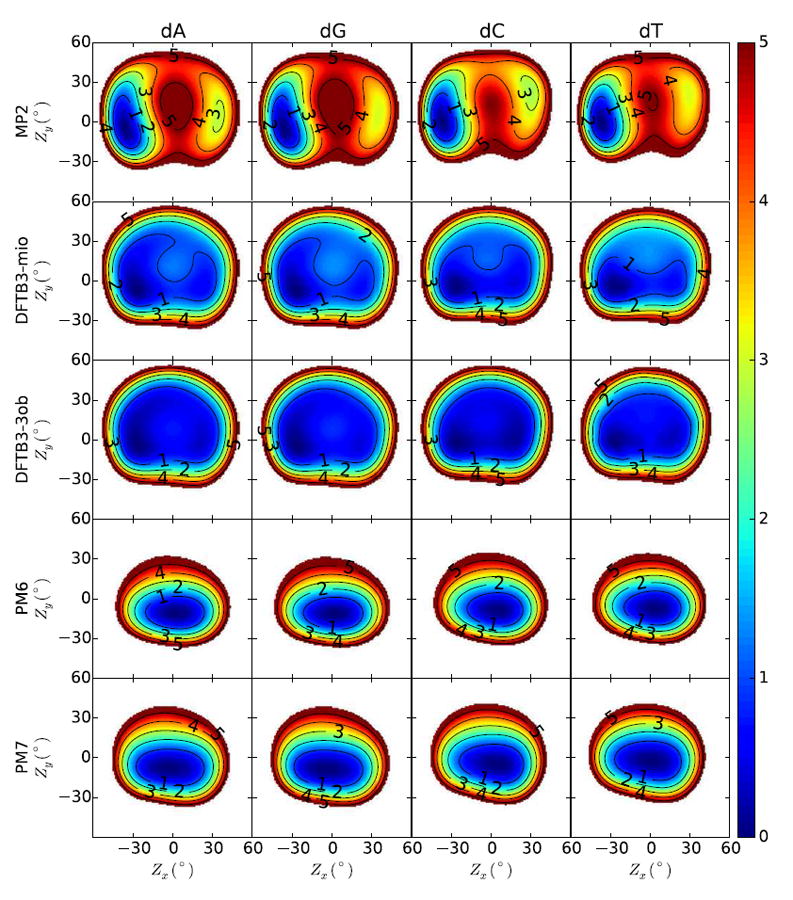
2D contours of sugar pseudorotation of DNA nucleosides. The energy units along each contour curve are in kcal/mol and all energy values are calculated with respect to the global minimum.
Figure 10.

2D contours of sugar pseudorotation of RNA nucleosides. The energy units along each contour curve are in kcal/mol and all energy values are calculated with respect to the global minimum.
The 2D scans are constructed from partial geometry optimizations, whereby the values of Zx and Zy are constrained to their desired values while enforcing the torsion constraints listed in Table 8 to mimic the nucleoside connection to the B-DNA or A-RNA backbone and to avoid intramolecular hydrogen bonding interactions. Following our previous work22, we use MP2/6-311++G(3df,2p)//MP2/6-31++G(d,p) to construct the reference 2D profiles.
Table 8.
Constrained dihedral angles in nucleosides. The constrained torsion values are taken from NAB program in the AmberTools 13 program suite78. The χ and ν1, ν3 torsion constraints are imposed on geometry optimizations in the construction of sugar conformation and glycosidic torion profiles, respectively. For glycosidic bond torsion (χ) numbering scheme for purines (R) and pyrimidines (Y) are labeled by subscripts and indicated separately.
| Dihedral angle | B-DNA | A-RNA | |
|---|---|---|---|
| β | H5′ -O5′ -C5′ -C4′ | -151.5 | -179.9 |
| γ | O5′-C5′-C4′-C3′ | 30.9 | 47.4 |
| ε | C4′-C3′-O3′-H3′ | 159.1 | -151.7 |
| C3′-C2′-O2′-H2′ | … | -169.7 | |
|
| |||
| χ R | O4′-C1′-N9-C4 | -99.4 | -166.1 |
| χY | O4′-C1′-N1-C2 | -99.4 | -166.1 |
|
| |||
| ν1 | O4′-C1′-C2′-C3′ | 28.7 | -25.8 |
| ν3 | C2′-C3′-C4′-O4′ | 29.1 | -36.2 |
The pseudorotation angles, puckering amplitudes, and the relative energies of the stationary points of the DNA and RNA nucleosides are listed in Tables 9 and 10, respectively. MIN1 and MIN2 are the “Eastern” (large Zx) and “Western” (small Zx) minima observed in the 2D contours, and TS1 and TS2 are the “Northern” (large Zy) and “Southern” (small Zy) transition states.
Table 9.
Pseudorotation phases Pθ (°), pucker amplitudes Ar (°) and relative energies ΔE (kcal/mol) of the minima (MIN) and transition states (TS) of DNA nucleosides.
| MIN1
|
MIN2
|
TS1
|
TS2
|
||||||||||
|---|---|---|---|---|---|---|---|---|---|---|---|---|---|
| Pθ | Ar | ΔE | Pθ | Ar | ΔE | Pθ | Ar | ΔE | Pθ | Ar | ΔE | ||
| dA | MP2 | 358.7 | 34.3 | 2.9 | 189.8 | 34.7 | 0.0 | 83.7 | 40.6 | 4.5 | 295.0 | 13.4 | 4.9 |
| DFTB3a | 347.0 | 23.4 | 0.6 | 194.6 | 28.3 | 0.0 | 66.5 | 28.6 | 1.1 | 289.1 | 8.1 | 0.9 | |
| DFTB3b | 349.3 | 22.4 | 0.3 | 191.9 | 26.9 | 0.0 | 58.7 | 26.9 | 0.6 | 299.9 | 8.3 | 0.6 | |
| PM6 | 286.6 | 11.0 | 0.0 | - | - | - | - | - | - | - | - | - | |
| PM7 | - | - | - | 251.9 | 8.7 | 0.0 | - | - | - | - | - | - | |
| dG | MP2 | 357.8 | 33.9 | 3.1 | 190.6 | 34.8 | 0.0 | 83.2 | 40.4 | 4.7 | 293.7 | 14.2 | 5.0 |
| DFTB3a | 345.1 | 23.4 | 0.7 | 195.3 | 28.6 | 0.0 | 67.8 | 28.3 | 1.3 | 290.8 | 8.9 | 1.0 | |
| DFTB3b | 346.8 | 22.3 | 0.4 | 193.1 | 27.2 | 0.0 | 61.9 | 26.7 | 0.7 | 283.7 | 7.9 | 0.7 | |
| PM6 | 280.4 | 11.4 | 0.0 | - | - | - | - | - | - | - | - | - | |
| PM7 | - | - | - | 243.2 | 10.0 | 0.0 | - | - | - | - | - | - | |
| dC | MP2 | 36.8 | 37.5 | 2.8 | 180.2 | 35.4 | 0.0 | 89.6 | 39.9 | 3.9 | 344.2 | 3.6 | 4.9 |
| DFTB3a | 353.1 | 18.4 | 0.5 | 190.3 | 27.1 | 0.0 | 91.4 | 29.0 | 1.1 | 282.6 | 4.2 | 0.7 | |
| DFTB3b | 357.1 | 18.1 | 0.1 | 187.6 | 25.5 | 0.0 | - | - | - | 235.2 | 4.0 | 0.4 | |
| PM6 | 303.4 | 10.1 | 0.0 | - | - | - | - | - | - | - | - | - | |
| PM7 | 315.9 | 7.9 | 0.0 | - | - | - | - | - | - | - | - | - | |
| dT | MP2 | 26.5 | 33.5 | 3.2 | 180.8 | 35.4 | 0.0 | 90.6 | 38.3 | 4.5 | 4.9 | 3.4 | 5.0 |
| DFTB3a | 354.9 | 17.3 | 0.7 | 189.3 | 27.5 | 0.0 | 95.2 | 22.5 | 1.7 | 310.2 | 4.0 | 0.8 | |
| DFTB3b | 358.2 | 17.0 | 0.3 | 186.9 | 26.0 | 0.0 | - | - | - | 269.9 | 2.4 | 0.5 | |
| PM6 | 299.8 | 8.1 | 0.0 | - | - | - | - | - | - | - | - | - | |
| PM7 | 302.5 | 3.6 | 0.0 | - | - | - | - | - | - | - | - | - | |
DFTB3-mio
DFTB3-3ob
Table 10.
Pseudorotation phases Pθ (°), pucker amplitudes Ar (°) and the relative energies ΔE (kcal/mol) of the minima (MIN) and transition states (TS) of RNA nucleosides.
| MIN1
|
MIN2
|
TS1
|
||||||||
|---|---|---|---|---|---|---|---|---|---|---|
| Pθ | Ar | ΔE | Pθ | Ar | ΔE | Pθ | Ar | ΔE | ||
| rA | MP2 | 8.5 | 42.5 | 0.0 | 200.8 | 33.1 | 0.0 | 87.9 | 32.2 | 3.7 |
| DFTB3a | 14.3 | 31.8 | 2.2 | 172.8 | 30.2 | 0.0 | 36.5 | 27.8 | 2.4 | |
| DFTB3b | - | - | - | 166.9 | 29.6 | 0.0 | - | - | - | |
| PM6 | - | - | - | 206.4 | 15.8 | 0.0 | - | - | - | |
| PM7 | - | - | - | 204.7 | 24.8 | 0.0 | - | - | - | |
| rG | MP2 | 9.1 | 42.5 | 0.1 | 197.9 | 33.3 | 0.0 | 85.5 | 34.0 | 3.7 |
| DFTB3a | 14.5 | 31.6 | 2.6 | 173.0 | 30.5 | 0.0 | 36.2 | 27.1 | 2.7 | |
| DFTB3b | - | - | - | 167.2 | 30.0 | 0.0 | - | - | - | |
| PM6 | - | - | - | 203.2 | 17.9 | 0.0 | - | - | - | |
| PM7 | - | - | - | 204.1 | 25.3 | 0.0 | - | - | - | |
| rC | MP2 | 13.5 | 41.4 | 0.0 | 207.5 | 31.1 | 0.9 | 91.2 | 12.6 | 3.8 |
| DFTB3a | - | - | - | 193.2 | 24.2 | 0.0 | - | - | - | |
| DFTB3b | - | - | - | 189.7 | 21.9 | 0.0 | - | - | - | |
| PM6 | - | - | - | 197.7 | 11.1 | 0.0 | - | - | - | |
| PM7 | - | - | - | 199.9 | 20.1 | 0.0 | - | - | - | |
| rU | MP2 | 12.7 | 42.0 | 0.0 | 207.8 | 31.9 | 0.9 | 89.2 | 14.3 | 4.3 |
| DFTB3a | - | - | - | 193.4 | 26.1 | 0.0 | - | - | - | |
| DFTB3b | - | - | - | 190.9 | 24.1 | 0.0 | - | - | - | |
| PM6 | - | - | - | 198.2 | 12.6 | 0.0 | - | - | - | |
| PM7 | - | - | - | 200.0 | 21.3 | 0.0 | - | - | - | |
DFTB3-mio
DFTB3-3ob
1D Profiles of Glycosidic Torsion Reference Data
Figure 11 displays 1D energy profiles of deoxyribonucleosides (dA, dG, dC and dT) and ribonucleosides (rA, rG, rC and rU) as a function of the glycosidic torsion coordinate. The 1D profiles were constructed by scanning the glycosidic torsion χ from 0° to 360° in steps of 5°. Several additional torsion constraints were imposed on the geometry optimizations to mimic the nuceleoside in the B-DNA or A-RNA and avoid intramolecular hydrogen bonding interactions. These torsion constraints are listed in Table 8 together with constraint parameters from NAB program78. The benchmark scans were performed using MP2/6-311++G(3df,2p)//MP2/6-31++G(d,p). Tables 11 and 12 list the glycosidic torsions and relative energies of the stationary points along the 1D reaction coordinate computed from M062X, AM1/d-PhoT, PM6 and DFTB3. Comparisons involving the remaining methods have been made available in the Supporting Information. “MIN1” and “MIN2” are local and global minima with syn and anti glycosidic torions, respectively. “TS1” and “TS2” are transition states with lower and higher barriers, which have glycosidic torsions of about 120° and 0°, respectively.
Figure 11.

1D conformational contours of glycosidic torion of nucleosides.
Table 11.
Glycosidic torsion χ (°) and relative energies ΔE (kcal/mol) of the minima (MIN) and transition states (TS) of DNA nucleosides.
| MIN1
|
MIN2
|
TS1
|
TS2
|
||||||
|---|---|---|---|---|---|---|---|---|---|
| χ | ΔE | χ | ΔE | χ | ΔE | χ | ΔE | ||
| dA | MP2 | 87.2 | 2.8 | 239.3 | 0.0 | 117.6 | 3.3 | 346.9 | 7.9 |
| M062X | 88.3 | 3.4 | 239.4 | 0.0 | 112.6 | 3.6 | 347.2 | 8.2 | |
| AM1/d | - | - | 242.6 | 0.0 | - | - | 351.1 | 7.7 | |
| PM6 | 29.0 | 7.0 | 239.7 | 0.0 | 50.4 | 7.3 | 344.8 | 8.2 | |
| DFTB3 | - | - | 223.1 | 0.0 | - | - | 352.3 | 5.1 | |
|
| |||||||||
| dG | MP2 | 68.5 | 3.3 | 245.9 | 0.0 | 116.8 | 4.3 | 351.2 | 8.0 |
| M062X | 62.0 | 3.5 | 242.5 | 0.0 | 113.6 | 4.6 | 351.4 | 8.1 | |
| AM1/d | - | - | 244.7 | 0.0 | - | - | 354.1 | 6.6 | |
| PM6 | - | - | 241.0 | 0.0 | - | - | 351.4 | 7.8 | |
| DFTB3 | - | - | 228.8 | 0.0 | - | - | 2.6 | 5.3 | |
|
| |||||||||
| dC | MP2 | 67.5 | 6.5 | 195.2 | 0.0 | 102.8 | 8.1 | 353.5 | 14.9 |
| M062X | 63.9 | 6.5 | 194.3 | 0.0 | 103.7 | 8.2 | 350.7 | 15.1 | |
| AM1/d | - | - | 225.1 | 0.0 | - | - | 351.4 | 13.5 | |
| PM6 | 19.7 | 10.7 | 232.0 | 0.0 | 38.2 | 11.0 | 348.9 | 11.5 | |
| DFTB3 | - | - | 193.7 | 0.0 | - | - | 349.0 | 11.3 | |
|
| |||||||||
| dT | MP2 | 68.1 | 6.2 | 235.8 | 0.0 | 104.9 | 7.0 | 346.6 | 13.2 |
| M062X | 62.8 | 6.0 | 235.3 | 0.0 | 103.1 | 7.0 | 346.1 | 12.9 | |
| AM1/d | 31.3 | 9.8 | 238.9 | 0.0 | 44.3 | 9.9 | 352.6 | 11.1 | |
| PM6 | 19.1 | 8.8 | 238.9 | 0.0 | 40.3 | 9.2 | 345.0 | 10.0 | |
| DFTB3 | - | - | 225.0 | 0.0 | - | - | 346.3 | 9.2 | |
Table 12.
Glycosidic torsion χ (°) and relative energies ΔE (kcal/mol) of the minima (MIN) and transition states (TS) of RNA nucleosides.
| MIN1
|
MIN2
|
TS1
|
TS2
|
||||||
|---|---|---|---|---|---|---|---|---|---|
| χ | ΔE | χ | ΔE | χ | ΔE | χ | ΔE | ||
| rA | MP2 | 93.8 | 2.8 | 192.8 | 0.0 | 133.5 | 4.4 | 19.0 | 12.9 |
| M062X | 95.4 | 3.4 | 193.1 | 0.0 | 132.7 | 4.7 | 16.1 | 12.6 | |
| AM1/d | 101.2 | 3.5 | 205.8 | 0.0 | 121.4 | 3.7 | 19.3 | 12.1 | |
| PM6 | 102.2 | 2.4 | 199.8 | 0.0 | 126.3 | 2.7 | 18.8 | 13.6 | |
| DFTB3 | 103.6 | 2.4 | 194.5 | 0.0 | 119.9 | 2.5 | 21.5 | 8.1 | |
|
| |||||||||
| rG | MP2 | 91.6 | 3.6 | 196.5 | 0.0 | 133.1 | 5.4 | 11.8 | 11.3 |
| M062X | 94.0 | 4.2 | 196.8 | 0.0 | 132.9 | 5.7 | 7.6 | 11.1 | |
| AM1/d | 100.2 | 4.1 | 206.8 | 0.0 | 122.7 | 4.3 | 19.6 | 10.3 | |
| PM6 | 102.9 | 3.1 | 202.5 | 0.0 | 125.1 | 3.3 | 16.1 | 12.5 | |
| DFTB3 | 103.1 | 3.1 | 199.2 | 0.0 | 121.9 | 3.3 | 15.3 | 7.6 | |
|
| |||||||||
| rC | MP2 | 97.2 | 7.6 | 193.4 | 0.0 | 135.7 | 10.3 | 10.2 | 21.2 |
| M062X | 97.0 | 7.9 | 193.2 | 0.0 | 136.9 | 10.3 | 7.7 | 21.0 | |
| AM1/d | - | - | 195.8 | 0.0 | - | - | 17.3 | 21.2 | |
| PM6 | 111.8 | 4.6 | 195.7 | 0.0 | 116.8 | 4.6 | 17.0 | 18.1 | |
| DFTB3 | 103.7 | 6.0 | 191.9 | 0.0 | 124.9 | 6.4 | 14.9 | 16.6 | |
|
| |||||||||
| rU | MP2 | 95.7 | 5.9 | 195.3 | 0.0 | 139.9 | 8.5 | 8.3 | 17.3 |
| M062X | 96.1 | 6.3 | 194.7 | 0.0 | 139.7 | 8.7 | 4.2 | 17.2 | |
| AM1/d | - | - | 203.0 | 0.0 | - | - | 18.3 | 17.4 | |
| PM6 | 102.7 | 3.7 | 198.7 | 0.0 | 123.1 | 3.9 | 15.3 | 15.8 | |
| DFTB3 | 101.7 | 4.8 | 194.9 | 0.0 | 127.5 | 5.3 | 18.9 | 14.0 | |
1D and 2D Profiles of Phosphoryl Transfer Reference Data
Figure 13 contains 2D contours of 2′O-transphosphorylation (RNA transesterification) model reactions: the departure of methoxide (MethO) from ethylene phosphate (EP), and the departure of ethoxide (EthO) from a 2′,3′ -cyclic phosphate model (SP). Henceforth, these reactions will be referred to as MethO…EP and EthO…SP, respectively. The transition state structures of the model reactions are shown in Figure 12. These energy profiles were constructed from relaxed potential energy scans of the P-O2′ forming bond and the P-O5′ breaking bond from 1.60 Å to 2.60 Å in steps of 0.05 Å. MP2 is used as the reference benchmark. Table 13 lists the bond lengths and relative energies of the stationary points. TS1 and MIN2 refer to the stationary points whose P-O2′ forming bond is larger than the P-O5′ breaking bond. TS2 and MIN3 denote the stationary points whose P-O2′ forming bond is smaller than the P-O5′ breaking bond. TS1 and TS2 are also called early and late TS, respectively51,55.
Figure 13.

2D contours of RNA phosphoryl transfer model reactions CH3O…EP and CH3CH2O…SP. The relative potential energies are calculated with respective to reactant energy of each model reaction in unit of kcal/mol.
Figure 12.

Structures of transition states for RNA phosphoryl transfer model reactions (a) CH3O…EP and (b) CH3CH2O…SP, and (c) a schematic for the native reaction in RNA.
Table 13.
The bond lengths of P-O2′ forming bond R1 (Å) and P-O5′ breaking bond R2 (Å), and the relative energy ΔE (kcal/mol) of stationary points of RNA phosphoryl transfer model reactions, CH3O…EP and CH3CH2O…SP.
| Methods | TS1
|
MIN2
|
TS2
|
MIN3
|
||||||||
|---|---|---|---|---|---|---|---|---|---|---|---|---|
| R1 | R2 | ΔE | R1 | R2 | ΔE | R1 | R2 | ΔE | R1 | R2 | ΔE | |
| CH3O…EP
|
||||||||||||
| MP2 | - | - | - | - | - | - | 1.81 | 2.56 | 43.49 | - | - | - |
| M062X | - | - | - | - | - | - | 1.78 | 2.53 | 43.59 | - | - | - |
| B3LYP | - | - | - | - | - | - | 1.84 | 2.46 | 43.04 | - | - | - |
| AM1/d | - | - | - | - | - | - | 1.88 | 2.33 | 42.22 | - | - | - |
| DFTB3-OP | 2.17 | 1.82 | 34.59 | 1.92 | 1.85 | 33.64 | 1.84 | 2.27 | 37.76 | - | - | - |
| DFTB3 Mech1a | 2.67 | 2.24 | 38.58 | 2.60 | 2.55 | 36.31 | 2.18 | 2.62 | 41.32 | - | - | - |
| DFTB3 Mech2a | - | - | - | - | - | - | 1.91 | 2.06 | 48.65 | - | - | - |
| DFTB2 | - | - | - | - | - | - | 2.15 | 2.25 | 31.05 | - | - | - |
| PM7 | 2.52 | 1.72 | 43.62 | 1.81 | 1.77 | 32.83 | 1.74 | 2.52 | 47.61 | - | - | - |
| PM6 | 2.77 | 1.79 | 28.03 | 1.94 | 1.85 | 17.48 | 1.84 | 2.86 | 38.62 | - | - | - |
| AM1 | 2.89 | 1.70 | 23.46 | 1.80 | 1.76 | 6.53 | 1.73 | 2.94 | 26.44 | - | - | - |
|
| ||||||||||||
| CH3CH2O…SP
|
||||||||||||
| MP2 | - | - | - | - | - | - | 1.84 | 2.48 | 29.88 | - | - | - |
| M062X | - | - | - | - | - | - | 1.80 | 2.49 | 30.78 | - | - | - |
| B3LYP | - | - | - | - | - | - | 1.86 | 2.38 | 28.87 | - | - | - |
| AM1/d | - | - | - | - | - | - | 1.88 | 2.37 | 26.58 | - | - | - |
| DFTB3-OP | 2.15 | 1.82 | 18.79 | 1.95 | 1.84 | 18.33 | 1.85 | 2.29 | 23.11 | - | - | - |
| DFTB3 Mech1a | 2.66 | 2.24 | 24.36 | 2.60 | 2.54 | 22.35 | 2.17 | 2.62 | 27.59 | 1.79 | 2.74 | 23.51 |
| DFTB3 Mech2a | - | - | - | - | - | - | 1.96 | 2.09 | 34.71 | - | - | - |
| DFTB2 | - | - | - | - | - | - | 1.86 | 2.55 | 21.71 | - | - | - |
| PM7 | 2.51 | 1.71 | 22.29 | 1.84 | 1.76 | 15.13 | 1.75 | 2.53 | 29.61 | - | - | - |
| PM6 | 2.83 | 1.78 | 10.14 | 2.04 | 1.83 | 0.56 | 1.85 | 2.87 | 21.74 | - | - | - |
| AM1 | 2.90 | 1.69 | 14.91 | 1.81 | 1.75 | -2.53 | 1.73 | 2.95 | 19.86 | - | - | - |
Mech1 and Mech2 refer to dissociative and associative mechanisms, respectively
Table 14 lists the values of the reaction coordinate and relative energy at the stationary points of of 7 RNA phosphoryl transfer reaction profiles computed in the gas-phase.51 Four of the reactions follow associative, concerted mechanisms: CH3O…EP, PhO…EP, 4-CNPhO…EP, and CH3COO…EP. Two of the reactions are associative, stepwise mechanisms: CH3CH3CHO…EP and CH3CH2O…EP. And one of the reactions is a dissociative mechanism: CH3O…PO3. The associative reaction profiles are a function of R, where R = RP−O5′– RP–O2′. The dissociative reaction profile is a function of the P-O bond length. Figures and error statistics of these energy profiles are provided in the Supporting Information.
Table 14.
The reaction coordinate ΔR (Å) and relative energy ΔE (kcal/mol) of stationary points of RNA phosphoryl transfer reactions. ΔR = RP−O5′- RP−O2′.
| MIN1
|
MIN2
|
TS1
|
TS2
|
||||||
|---|---|---|---|---|---|---|---|---|---|
| ΔR | ΔE | ΔR | ΔE | ΔR | ΔE | ΔR | ΔE | ||
| CH3CH3CHO…EP (associative, poor leaving group) | MP2 | -3.36 | 0.0 | -0.12 | 33.9 | -0.40 | 34.3 | 0.57 | 37.5 |
| M062X | -3.35 | 0.0 | -0.12 | 33.8 | -0.43 | 34.2 | 0.60 | 37.9 | |
| AM1/d | -3.42 | 0.0 | - | - | - | - | 0.39 | 40.1 | |
| DFTB3-OP | -3.46 | 0.0 | -0.03 | 31.5 | -0.38 | 33.1 | 0.40 | 34.3 | |
| PM7 | -3.37 | 0.0 | -0.01 | 29.8 | -0.82 | 41.8 | 0.71 | 38.4 | |
|
| |||||||||
| CH3CH2O…EP (associative, poor leaving group) | MP2 | -3.41 | 0.0 | -0.20 | 35.2 | -0.33 | 35.2 | 0.61 | 39.7 |
| M062X | -3.41 | 0.0 | -0.18 | 34.9 | -0.38 | 35.0 | 0.66 | 40.0 | |
| AM1/d | -3.32 | 0.0 | - | - | - | - | 0.43 | 41.8 | |
| DFTB3-OP | -3.46 | 0.0 | -0.05 | 32.7 | -0.36 | 33.7 | 0.38 | 36.0 | |
| PM7 | -3.36 | 0.0 | -0.03 | 31.2 | -0.80 | 42.3 | 0.73 | 42.3 | |
|
| |||||||||
| CH3O…EP (associative, poor leaving group) | MP2 | -3.41 | 0.0 | - | - | - | - | 0.75 | 43.5 |
| M062X | -3.39 | 0.0 | - | - | - | - | 0.74 | 43.6 | |
| AM1/d | -3.40 | 0.0 | - | - | - | - | 0.45 | 42.2 | |
| DFTB3-OP | -3.46 | 0.0 | -0.07 | 33.6 | -0.35 | 34.6 | 0.43 | 37.8 | |
| PM7 | -3.38 | 0.0 | -0.04 | 32.8 | -0.80 | 43.6 | 0.78 | 47.6 | |
|
| |||||||||
| PhO…EP (associative, enhanced leaving group) | MP2 | -3.32 | 0.0 | - | - | -0.51 | 23.4 | - | - |
| M062X | -3.36 | 0.0 | - | - | -0.53 | 23.3 | - | - | |
| AM1/d | -3.33 | 0.0 | - | - | -0.42 | 19.6 | - | - | |
| DFTB3-OP | -3.40 | 0.0 | -0.70 | 21.1 | -1.02 | 21.7 | -0.41 | 21.7 | |
| PM7 | -3.32 | 0.0 | - | - | -0.88 | 31.8 | - | - | |
|
| |||||||||
| 4-CNPhO…EP (associative, enhanced leaving group) | MP2 | -3.27 | 0.0 | - | - | -0.65 | 18.5 | - | - |
| M062X | -3.27 | 0.0 | - | - | -0.65 | 18.1 | - | - | |
| AM1/d | -3.30 | 0.0 | - | - | -0.74 | 13.0 | - | - | |
| DFTB3-OP | -3.40 | 0.0 | - | - | -1.08 | 18.2 | - | - | |
| PM7 | -3.28 | 0.0 | - | - | -0.92 | 27.3 | - | - | |
|
| |||||||||
| CH3COO…EP (associative, enhanced leaving group) | MP2 | -3.36 | 0.0 | - | - | -0.49 | 23.0 | - | - |
| M062X | -3.36 | 0.0 | - | - | -0.51 | 23.7 | - | - | |
| AM1/d | -3.36 | 0.0 | - | - | -0.54 | 19.0 | - | - | |
| DFTB3-OP | -3.40 | 0.0 | -0.68 | 20.3 | -1.03 | 21.0 | -0.41 | 20.8 | |
| PM7 | -3.34 | 0.0 | - | - | -0.86 | 34.4 | - | - | |
|
| |||||||||
| CH3O…PO3 (dissociative, poor leaving group) | MP2 | 1.75 | 0.0 | - | - | 3.14 | 25.8 | - | - |
| M062X | 1.74 | 0.0 | - | - | 3.21 | 28.9 | - | - | |
| AM1/d | 1.80 | 0.0 | - | - | 2.60 | 10.6 | - | - | |
| DFTB3-OP | 1.75 | 0.0 | - | - | 3.05 | 23.9 | - | - | |
| PM7 | 1.71 | 0.0 | - | - | 2.75 | 32.5 | - | - | |
Results and Discussion
Proton Affinity
Proton affinities and related metrics, such as gas phase acidities and basicities, have frequently been used to test and compare semiempirical models8,21,72-75. For example, Dewar72 found AM1 to adequately reproduce the experimental proton affinities of neutral molecules. Burk73,74 further compared the proton affinities of neutral compounds with AM1 and PM3 and concluded AM1 to be superior. More recently, Toomsalu75 compared AM1, PM3, PDDG, and PM6; and found PM6 and AM1 to best reproduce gas phase basicities and AM1 and PM3 to best reproduce gas phase acidities. As described in the Methods section, the benchmark proton affinity data used as reference values in the comparisons that follow were performed at the CBS-QB3 level and reported previously71.
The results in Figure 1 and Table 3 show that all the DFT and semiempirical models evaluated here give excellent overall linear correlations. Both M062X and B3LYP are in close agreement with CBS-QB3 calculations with overall MUEs of 0.9 and 1.2 kcal/mol, respectively. The NDDO-based semiempirical models systematically reproduce the proton affinities better than approximate DFTB models. Among the semiempirical methods, AM1/d-PhoT and AM1 produce the lowest overall MUEs of 3.3 kcal/mol and 5.3 kcal/mol, respectively; which is consistent with previous studies72,74,75. The lowest STDs of overall MSEs were found for AM1/d-PhoT (4.9 kcal/mol) and PM6 (5.3 kcal/mol), suggesting that they are the best for estimating “relative” proton affinities, although PM6 systematically underestimate “absolute” proton affinities. Use of both “NHmod” and “OPhyd” DFTB3 parameters slightly improves the amino acid and phosphorane proton affinities, respectively. Abnormally large negative proton affinity errors occur for molecules involving sulfur in the phosphorane set using AM1/d-PhoT, PM7, and all DFTB models due to their failure to reproduce the expected pentavalent phosphorus geometrical structure, although low MUEs set were obtained for the phosphate set with these models except DFTB2. Note that AM1/d-PhoT has not been specifically parameterized for sulfur and the sulfur parameters in AM1 are used here without modification. When those molecules are removed from the statistics, both DFTB3-HNOP and DFTB3 systematically overestimate the proton affinities except the phosphorane set. Chemical modifications that involve the substitution of phosphoryl oxygens with sulfur represent important experimental probes to study metal ion binding and ribozyme mechanisms37,79,80. Consequently, the modeling of pentavalent phosphorus both with and without thio substitutions is an important area that warrants attention in the development of next-generation semiempirical quantum models for nucleic acid reactivity.
Polarizability
Figure 2 and Table 4 show good linear correlations between the model and reference isotropic polarizabilities for all models. Both M062X and B3LYP closely match MP2 calculations with overall MUEs of -1.5 and 1.5 a.u., although M062X and B3LYP slightly under- and over-estimate the static isotropic polarizabilities, respectively. All the semiempirical methods evaluated here systematically underestimate the reference isotropic polarizabilities by approximately 30%, which is consistent with previous studies81-83, The systematic underestimation of polarizability by semiempirical methods is attributed to the use of a minimal basis set, because the accuracy of polarizability depends largely on the size of the basis81,82,84. For the case of DFTB models, it is exacerbated by monopole representation of charge fluctuations82.
Nucleobase Dimer
The JSCH-2005 data set of hydrogen bonded and stacked nucleobase dimers76 has been widely used to test noncovalent interactions3,17,24,27-29. The intermolecular interactions contained within JSCH-2005 involve both geometry optimized complexes and ad hoc, artificial geometries chosen to mimic the relative orientation of dimers within DNA or RNA. We limit the scope of our comparisons to those dimers whose reference structures were optimized to a stable minimum; however, we compare the models to the reference calculations twice. In the first comparison, the interactions are computed upon optimization of the complex’s geometry (Figures 3 and 4, and Table 5). In the second comparison, we compute the model interactions from single point calculations at the reference geometry (Figures 5 and 6, and Table 6). Large differences between these two comparisons are indicative of a significant change to the geometry upon optimization. For example, previous comparisons of AM1, PM3, AM1-D, and PM3-D have found that the inclusion of dispersion corrections not only greatly improve the stacked dimer interactions, but it proved vital to prevent destacking of the dimers into hydrogen bonded complexes upon geometry optimization24,25. Hydrogen-bonded DNA base pair interactions have also been shown to be improved with PM6-DH+29 and DFTB2-D35.
Our results indicate that the models with dispersion correction and/or hydrogen bonding correction greatly improve the binding energies of hydrogen bonded and stacked dimers16,24,27,28,85 However, most of dispersion corrected models, except M062X-D3, M062X, mDC and DFTB2-D, still fail to correctly locate all of the stable stacked dimers upon geometry optimization.
Among the models examined here, mDC produces the lowest overall interaction energy MUE (0.9 kcal/mol) upon geometry optimization. PM6-DH+ and DFTB2-D-γh give the lowest overall MUE amongst the NDDO and DFTB methods. The best models for hydrogen bonded nucleobase dimers are CAM-B3LYP-D3, mDC, and B3LYP-D3, whose MUEs are 0.7, 0.9, and 1.1 kcal/mol, respectively. The most accurate results for stacked nucleobase dimers are obtained with mDC, M062X-D3 and M062X with MUE of 0.6, 1.0, and 1.0 kcal/mol, respectively. The single point calculations indicate that all DFTB models underestimate the interaction energies.
2D Profiles of DMP Conformation
The MP2 energy profile of dimethyl phosphate anion (DMP) in Figure 8 has a plane of symmetry and contains three unique minima (gg, tg, and tt) and four significant transition states (gg-tg, tg-tt, tg-gt, and tt-tt). Their relative energies are all within 4 kcal/mol of the global minimum, as shown in Table 7. The MP2 stationary point relative mimima are slightly higher than those reported in previous works86,87, but agree to within 0.4 kcal/mol. The M062X energy profile is in excellent agreement with MP2; their stationary points are within -0.16 kcal/mol of each other, on average. The B3LYP and MP2 energy profiles qualitatively resemble, but the B3LYP stationary point relative energies are 25% lower.
The DFTB3-OPhyd and DFTB3 energy profiles are very similar to each other, but are in poor agreement with the ab initio profiles. The relative energies of local minima and transition states are less than 0.8 kcal/mol, which are 5 times smaller than MP2 and M062X, and suggests a lack of preference among the gg, tg and tt conformations. Furthermore, the tg-gt transition state is incorrectly predicted to be a shallow minimum.
The DFTB2 and NDDO-based semiempirical models only correctly predict the gg global minimum and, like DFTB3, produce a shallow minimum where the tg-gt transition state would be predicted. The DFTB2 tt-tt conformer is actually a gg-gg transition state connecting the two gg conformers.
2D Profiles of Sugar Conformation
Figures 9 and 10 display the 2D profiles of DNA and RNA sugar pseudorotation potential energy surfaces, respectively. In our previous work22, AM1/d-PhoT, PM6 and DFTB3-mio have been evaluated by comparing to the benchmark MP2 calculations. Here we focus on the latest semiempirical methods, PM7 and DFTB3-3ob. The DFTB3-3ob energy profiles resemble DFTB3-mio and their agreement with MP2 energy profiles is poor. The conspicuous feature of DFTB3-3ob and DFTB3-mio DNA profiles is the flatness of the potential energy surface. The relative energies of DFTB3-mio local minima and transition states are 3 to 5 times smaller than MP2, suggesting a lack of preference between the C2′ -endo and C3′- endo conformation. The relative energies of DFTB3-3ob stationary points are less than 0.8 kcal/mol, even smaller than those of DFTB3-mio. The puckering amplitude of DFTB3-3ob stationary points are also slightly smaller than DFTB3-mio. The northern pseudorotation path shown in DFTB3-3ob and DFTB3-mio profiles is not preferred, which is counter to steric arguments44 and previous ab initio computation22,88. Pyrimidine deoxynuclosides from DFTB3-3ob do not have a northern TS1. In the DFTB3-mio RNA nucleoside profiles, the pyrimidines have only one minimum, whereas the local minimum of purine nucleosides are barely bound. The DFTB3-3ob ribose energy profiles have only one minimum.
The PM7 energy profiles are similar to PM6; they both predict a single circular-shaped minimum for both DNA and RNA nucleosides. The puckering amplitudes of the PM6 stationary points are 2 to 3 times smaller than MP2, indicative of a preference for a flat sugar ring. The PM7 DNA and RNA nucleoside pucker amplitudes are smaller and larger than PM6, respectively.
We hypothesize that the failure of semiempirical methods to reproduce sugar ring conformation is largely caused by the use of a minimal basis set and, in the case of NDDO-based models, further aggravated by the atomic orbital orthogonality condition. An ad hoc correction potential has recently been developed to improve sugar pucker profiles for both NDDO and DFTB semiempirical models22.
1D Profiles of Glycosidic Torsion
The MP2 nucleoside glycosidic torsion profiles shown in Figure 11 have two minima: an anti-conformation global minimum (MIN2) and a syn-conformation local minimum (MIN1). The two minima are connected by two transition states (TS1 and TS2). The TS1 pathway is favored by 6.93 kcal/mol, on average.
The M062X energy profiles of DNA and RNA nucleosides closely match the benchmark MP2 results. The energy profiles from semiempirical methods are in qualitative agreement with MP2 and M062X. The semiempirical models correctly predict the locations of the global MIN2 and TS2; however, AM1/d and DFTB3 fail to predict at least one of the MIN1 local minima within the set of DNA nucleosides, as indicated in Table 11, and AM1/d fails to predict a local minimum for the rC and rU RNA nucleosides. Even when the semiempirical models do correctly predict the existence of a MIN1 local minimum, their depth is far too shallow (0.5 kcal/mol) in comparison to the ab initio results. Amongst the semiempirical models, DFTB3 underpredicts the height of the TS2 barrier by approximately 3 kcal/mol, whereas AM1/d and PM6 agree with MP2 to within 1 kcal/mol.
1D and 2D Profiles of RNA Phosphoryl Transfer Reactions
Figure 13 and Table 13 describe the RNA phosphoryl transfer model reactions shown in Fig. 12. The late transition state and close barrier observed in the MP2, M062X, and B3LYP 2D energy profiles suggest that both of the model reactions undergo an associative asynchronous concerted mechanism51,55. The AM1/d energy profiles are in good agreement with MP2; the TS barrier difference between AM1/d and MP2 methods is 2.29 kcal/mol on average. The DFTB3-OPhyd profiles seemingly resemble the ab initio results; however, upon closer inspection, DFTB3-OPhyd predicts an associative stepwise mechanism with a slightly bound intermediate.
The agreement between DFTB3, DFTB2, PM7, PM6, and AM1 energy profiles with MP2 is poor. The DFTB3 energy profiles show both dissociative and associative mechanisms. Although DFTB2 predicts associative concerted mechanisms, in agreement with the MP2 results, the DFTB2 reaction paths are noticeably different from MP2; the DFTB2 TS is 8 kcal/mol lower than MP2. The PM7, PM6 and AM1 energy profiles show associative stepwise mechanisms passing through an intermediate bound by more than 7 kcal/mol.
Table 14 compares stationary points for several RNA model reaction profiles. The MP2 reference calculations of the associative RNA model reactions involving poor leaving groups predict either no stable intermediate or a shallow intermediate, whereas PM7 incorrectly predicts an intermediate stabilized by approximately 10 kcal/mol. For the associative reactions with good leaving groups, PM7 overpredicts the barrier height, AM1/d underpredicts the barrier height, and DFTB3-OP produces reasonably accurate barrier heights. The MP2 dissociative RNA phosphoryl transfer model reaction barrier is reasonably well reproduced by DFTB3-OP; however, PM7 and AM1/d-PhoT over- and under-predicts the barrier height by approximately 7 and 15 kcal/mol, respectively.
Conclusion
In this work, we critically examine NDDO and SCC-DFTB semiempirical models against seven diffierent data sets that span important properties related to biocatalysis: proton affinities, polarizabilities, nucleobase dimer interactions, dimethyl phosphate anion conformation, nucleoside sugar ring and glycosidic torsion conformation, and RNA phosphoryl transfer model reactions.The results show that, among the semiempirical models examined here, AM1/d-PhoT is the best overall for predicting proton affinities, whereas PM6 systematically underestimate proton affinities. The modeling of pentavalent phosphorus, particularly with thio modifications used experimentally as mechanistic probes, was problematic for all of the semiempirical models considered, and is marked as an area that warrants closer attention in the development of new models. All the semiempirical methods here underestimate the polarizabilities by approximately 30%, which can be attributed to their use of a minimal valence basis set.
The mDC linear-scaling quantum mechanical force field produces the most accurate nucleobase dimer interactions. Dispersion corrections greatly improve hydrogen bonding and stacking of nucleobase dimers; however, many of the corrected models continue to fail to reproduce the structures of all stacked nucleobase dimers considered. Hence, the development of new models that provide improved accuracy for intermolecular interactions is important.
All of the tested semiempirical models poorly reproduced the ab initio conformational energy profiles of the dimethyl phosphate anion, nucleoside sugar rings, and glycosidic torsions. The DFTB models perform generally better than the NDDO methods for conformational energies except glycosidic torsion, but they still have considerable limitations.DFTB3-3ob correctly predicted all of the stable DMP conformations, but the rotational barriers between them are underestimated. DFTB2-mio and all of the NDDO-based models could only correctly locate the global minimum of DMP. DFTB3-3ob and DFTB3-mio correctly predict two DNA nucleoside sugar pucker conformations, but incorrectly predict only one stable RNA nucleoside sugar pucker conformation. PM7 and PM6 energy surfaces resemble 2D parabola with only one stable sugar pucker minimum corresponding to a flat sugar ring. The AM1/d-PhoT model also performs very poorly for sugar pucker profiles, although recently reported empirical corrections offer considerable improvement.
The AM1/d-PhoT and DFTB3-3ob/OPhyd associative RNA phosphoryl transfer model reaction profiles are in overall reasonable agreement with MP2; however, DFTB3-3ob/OPhyd often predicts a stepwise mechanism (albeit with a slightly bound intermediate) even when the MP2 mechanism indicates a concerted mechanism. On the other hand, the MP2 dissociative RNA phosphoryl transfer model reaction profile is poorly reproduced by AM1/d-PhoT, whose transition state barrier is 15 kcal/mol too small.
A long-term goal of this work is the creation of next-generation fast semiempirical models for RNA catalysis and phosphoryl transfer that are able to reproduce all of the properties detailed in this work with high accuracy. Analysis of the strengths and weakness of a wide range of existing models suggests several aspects that future development should consider. These include modifications that allow the better modeling of phosphoranes (both with and without thio substitutions) and relative conformational energies and barriers, and that improve the accuracy of intermolecular interactions through use of a multipolar representation for electrostatic interactions, explicit dispersion terms, and corrections that enhance electronic response properties.
Supplementary Material
Table 2.
Theoretical models applied in this work. NDDO and SCC-DFTB denote neglect of diatomic differential overlap and self-consistent-charge density-functional tight-binding methods, respectively.
| Model | Description and references |
|---|---|
| CBS | CBS-QB367,68 |
| MP2 | MP2/6-311++G(3df,2p)//MP2/6-31++G(d,p) |
| B3LYP | B3LYP/6-311++G(3df,2p)//B3LYP/6-31++G(d,p) |
| B3LYP-D3 | B3LYP-D3/6-311++G(3df,2p)//B3LYP-D3/6-31++G(d,p) (B3LYP with dispersion correction65) |
| CAM-B3LYP | CAM-B3LYP/6-311++G(3df,2p)//CAM-B3LYP/6-31++G(d,p) (B3LYP with long range correction66) |
| CAM-B3LYP-D3 | CAM-B3LYP-D3/6-311++G(3df,2p)//CAM-B3LYP-D3/6-31++G(d,p)66 |
| M062X | M062X/6-311++G(3df,2p)//M062X/6-31++G(d,p) |
| M062X-D3 | M062X-D3/6-311++G(3df,2p)//M062X-D3/6-31++G(d,p) (M062X with dispersion correction65) |
|
| |
| AM1 | NDDO-based Austin Model 133 |
| AM1-D | AM1 including dispersion correction24,25 |
| AM1/d | AM1/d-PhoT, AM1/d with specific reaction parametrization for phosphoryl transfer reactions18 |
| PM6 | NDDO-based Parameterized Model 619 |
| PM6-DH+ | PM6 with dispersion and hydrogen-bonding corrections28 |
| PM6-D3 | PM6 augmented with the dispersion correction developed for DFT65 |
| PM7 | NDDO-based Parameterized Model 79 |
|
| |
| DFTB2 | SCC-DFTB or DFTB2-mio developed for materials and biological systems34 |
| DFTB2-γh | DFTB2-mio with the γh function8 |
| DFTB2-D | DFTB2-mio with dispersion correction35 |
| DFTB2-D-γh | DFTB2-γh augmented with the dispersion correction developed for DFTB2 |
| DFTB3-mio | SCC-DFTB including the third-order expansion of the DFT total energy8 |
| DFTB3 | DFTB3-3ob developed for organic and biological application20 |
| DFTB3-HN | DFTB3-3ob with specialized H-N (“NHmod”) parameters for the sp3 hybridized nitrogen atoms8,20 |
| DFTB3-OP | DFTB3-3ob with specialized O-P (“OPhyd”) parameters for phosphate hydrolysis reactions, DFTB3-3ob/OPhyd21 |
| DFTB3-HNOP | DFTB3-HN for sp3 N-containing molecules and DFTB3-OP for P-containing molecules |
| DFTB3-D | DFTB3-3ob augmented with the dispersion correction developed for DFTB2 |
| mDC | A linear-scaling quantum mechanical force field based on DFTB3-3ob2,3 |
References
- 1.Stewart JJP. J Mol Model. 2009;15:765–805. doi: 10.1007/s00894-008-0420-y. [DOI] [PubMed] [Google Scholar]
- 2.Giese TJ, Chen H, Dissanayake T, Giambaşu GM, Heldenbrand H, Huang M, Kuechler ER, Lee T-S, Panteva MT, Radak BK, York DM. J Chem Theory Comput. 2013;9:1417–1427. doi: 10.1021/ct3010134. [DOI] [PMC free article] [PubMed] [Google Scholar]
- 3.Giese TJ, Chen H, Huang M, York DM. J Chem Theory Comput. 2014;10:1086–1098. doi: 10.1021/ct401035t. [DOI] [PMC free article] [PubMed] [Google Scholar]
- 4.Warshel A. Acc Chem Res. 2002;35:385–395. doi: 10.1021/ar010033z. [DOI] [PubMed] [Google Scholar]
- 5.Garcia-Viloca M, Gao J, Karplus M, Truhlar DG. Science. 2004;303:186–195. doi: 10.1126/science.1088172. [DOI] [PubMed] [Google Scholar]
- 6.Giese TJ, Huang M, Chen H, York DM. 2014 Sep;47:2812–20. doi: 10.1021/ar500103g. [DOI] [PMC free article] [PubMed] [Google Scholar]
- 7.Giese TJ, Yor DM. In: Many-Body Effects and Electrostatics in Biomolecules. Cu Q, Meuwly M, Ren P, editors. Springer Verlag; 2014. chapter accepted. [Google Scholar]
- 8.Gaus M, Cui Q, Elstner M. J Chem Theory Comput. 2011;7:931–948. doi: 10.1021/ct100684s. [DOI] [PMC free article] [PubMed] [Google Scholar]
- 9.Stewart JJP. J Mol Model. 2013;19:1–32. doi: 10.1007/s00894-012-1667-x. [DOI] [PMC free article] [PubMed] [Google Scholar]
- 10.Sattelmeyer KW, Tirado-Rives J, Jorgensen WL. J Phys Chem A. 2006;110:13551–13559. doi: 10.1021/jp064544k. [DOI] [PubMed] [Google Scholar]
- 11.Otte N, Scholten M, Thiel W. J Phys Chem A. 2007;111:5751–5755. doi: 10.1021/jp0700130. [DOI] [PubMed] [Google Scholar]
- 12.Barnett CB, Naidoo KJ. J Phys Chem B. 2010;114:17142–17154. doi: 10.1021/jp107620h. [DOI] [PubMed] [Google Scholar]
- 13.Korth M, Thiel W. J Chem Theory Comput. 2011;7:2929–2936. doi: 10.1021/ct200434a. [DOI] [PubMed] [Google Scholar]
- 14.Petraglia R, Corminboeuf C. J Chem Theory Comput. 2013;9:3020–3025. doi: 10.1021/ct4003948. [DOI] [PubMed] [Google Scholar]
- 15.Hostaš J, Řezáč J, Hobza P. Chem Phys Lett. 2013;568:161–166. [Google Scholar]
- 16.Sedlak R, Janowski T, Pitoňák M, Rezáč J, Pulay P, Hobza P. J Chem Theory Comput. 2013;9:3364–3374. doi: 10.1021/ct400036b. [DOI] [PMC free article] [PubMed] [Google Scholar]
- 17.Li A, Muddana HS, Gilson MK. J Chem Theory Comput. 2014;10:1563–1575. doi: 10.1021/ct401111c. [DOI] [PMC free article] [PubMed] [Google Scholar]
- 18.Nam K, Cui Q, Gao J, York DM. J Chem Theory Comput. 2007;3:486–504. doi: 10.1021/ct6002466. [DOI] [PubMed] [Google Scholar]
- 19.Stewart JJP. J Mol Model. 2007;13:1173–1213. doi: 10.1007/s00894-007-0233-4. [DOI] [PMC free article] [PubMed] [Google Scholar]
- 20.Gaus M, Goez A, Elstner M. J Chem Theory Comput. 2013;9:338–354. doi: 10.1021/ct300849w. [DOI] [PubMed] [Google Scholar]
- 21.Gaus M, Lu X, Elstner M, Cui Q. J Chem Theory Comput. 2014;10:1518–1537. doi: 10.1021/ct401002w. [DOI] [PMC free article] [PubMed] [Google Scholar]
- 22.Huang M, Giese TJ, Lee TS, York DM. J Chem Theory Comput. 2014;10:1538–1545. doi: 10.1021/ct401013s. [DOI] [PMC free article] [PubMed] [Google Scholar]
- 23.Giese TJ, Sherer EC, Cramer CJ, York DM. J Chem Theory Comput. 2005;1:1275–1285. doi: 10.1021/ct050102l. [DOI] [PubMed] [Google Scholar]
- 24.McNamara JP, Hillier IH. Phys Chem Chem Phys. 2007;9:2362–2370. doi: 10.1039/b701890h. [DOI] [PubMed] [Google Scholar]
- 25.Morgado CA, McNamara JP, Hillier IH, Burton NA, Vincent MA. J Chem Theory Comput. 2007;3:1656–1664. doi: 10.1021/ct700072a. [DOI] [PubMed] [Google Scholar]
- 26.Feng F, Wang H, Fang WH, Yu JG. J Theor Comput Chem. 2009;08:691–711. [Google Scholar]
- 27.Řezáč J, Fanfrlík J, Salahub D, Hobza P. J Chem Theory Comput. 2009;5:1749–1760. doi: 10.1021/ct9000922. [DOI] [PubMed] [Google Scholar]
- 28.Korth M, Pitoňák M, Rezáč J, Hobza P. J Chem Theory Comput. 2010;6:344–352. doi: 10.1021/ct900541n. [DOI] [PubMed] [Google Scholar]
- 29.Korth M. J Chem Theory Comput. 2010;6:3808–3816. [Google Scholar]
- 30.Rezác J, Hobza P. J Chem Theory Comput. 2012;8:141–151. doi: 10.1021/ct200751e. [DOI] [PubMed] [Google Scholar]
- 31.Strobel SA, Cochrane JC. 2007 Dec;11:636–643. doi: 10.1016/j.cbpa.2007.09.010. [DOI] [PMC free article] [PubMed] [Google Scholar]
- 32.Lilley DM, Eckstein F, editors. Ribozymes and RNA Catalysis. RSC Biomolecular Series, RSC Publishing; Cambridge: 2008. [Google Scholar]
- 33.Dewar MJS, Zoebisch E, Healy EF, Stewart JJP. J Am Chem Soc. 1985;107:3902–3909. [Google Scholar]
- 34.Elstner M, Porezag D, Jungnickel G, Elsner J, Haugk M, Frauenheim T, Suhai S, Seifert G. Phys Rev B. 1998;58:7260–7268. [Google Scholar]
- 35.Elstner M, Hobza P, Frauenheim T, Suhai S, Kaxiras E. J Chem Phys. 2001;114:5149–5155. [Google Scholar]
- 36.Silverman RB. The Organic Chemistry of Enzyme-Catalyzed Reactions. Academic Press; San Diego, CA: 2000. [Google Scholar]
- 37.Lassila JK, Zalatan JG, Herschlag D. Annu Rev Biochem. 2011;80:669–702. doi: 10.1146/annurev-biochem-060409-092741. [DOI] [PMC free article] [PubMed] [Google Scholar]
- 38.Ward WL, Plakos K, DeRose VJ. Chem Rev. 2014;114:4318–4342. doi: 10.1021/cr400476k. [DOI] [PMC free article] [PubMed] [Google Scholar]
- 39.Hobza P. Acc Chem Res. 2012;45:663–672. doi: 10.1021/ar200255p. [DOI] [PubMed] [Google Scholar]
- 40.Guan Y, T GJ., Jr J Mol Struct. 1996;379:31–41. [Google Scholar]
- 41.Kuo I-F, Tobias DJ. J Phys Chem B. 2001;105:5827–5832. [Google Scholar]
- 42.Petrov AS, Funseth-Smotzer J, Pack GR. J Quantum Chem. 2005;102:645–655. [Google Scholar]
- 43.Wang F-F, Zhao D-X, Gong L-D. 2009 Jun;124:139–150. [Google Scholar]
- 44.Saenger W. Principles of Nucleic Acid Structure. Springer-Verlag; New York: 1984. [Google Scholar]
- 45.Bloomfield VA, Crothers DM, Tinoco I., Jr . Nucleic Acids: Structures, Properties, and Functions. University Science Books; Sausalito, CA: 2000. [Google Scholar]
- 46.Rich A. Nature Struct Biol. 2003;10:247–249. doi: 10.1038/nsb0403-247. [DOI] [PubMed] [Google Scholar]
- 47.Rana TM. Nat Rev Mol Cell Biol. 2007;8:23–36. doi: 10.1038/nrm2085. [DOI] [PubMed] [Google Scholar]
- 48.Torres RA, Bruice TC. J Am Chem Soc. 2000;122:781–791. [Google Scholar]
- 49.Zhang N, Zhang S, Szostak JW. J Am Chem Soc. 2012;134:3691–3694. doi: 10.1021/ja212027q. [DOI] [PMC free article] [PubMed] [Google Scholar]
- 50.Zhou J, Lv C, Liang B, Chen M, Yang W, Li H. J Mol Biol. 2010;401:690–695. doi: 10.1016/j.jmb.2010.06.061. [DOI] [PMC free article] [PubMed] [Google Scholar]
- 51.Huang M, York DM. Phys Chem Chem Phys. 2014;16:15846–15855. doi: 10.1039/c4cp01050g. [DOI] [PMC free article] [PubMed] [Google Scholar]
- 52.Zgarbová M, Otyepka M, Šponer J, Mládek A, Banáš P, Cheatham TE, III, Jurečka P. J Chem Theory Comput. 2011;7:2886–2902. doi: 10.1021/ct200162x. [DOI] [PMC free article] [PubMed] [Google Scholar]
- 53.Yildirim I, Stern HA, Kennedy SD, Tubbs JD, Turner DH. 2010 May;6:1520–1531. doi: 10.1021/ct900604a. [DOI] [PMC free article] [PubMed] [Google Scholar]
- 54.Perreault DM, Anslyn EV. Angew Chem Int Ed. 1997;36:432–450. [Google Scholar]
- 55.Chen H, Giese TJ, Huang M, Wong K-Y, Harris ME, York DM. Chem Eur J. 2014;20:14336–14343. doi: 10.1002/chem.201403862. [DOI] [PMC free article] [PubMed] [Google Scholar]
- 56.Gu H, Zhang S, Wong K-Y, Radak BK, Dissanayake T, Kellerman DL, Dai Q, Miyagi M, Anderson VE, York DM, Piccirilli JA, Harris ME. Proc Natl Acad Sci USA. 2013;110:13002–13007. doi: 10.1073/pnas.1215086110. [DOI] [PMC free article] [PubMed] [Google Scholar]
- 57.Rupert PB, Massey AP, Sigurdsson ST, Ferr′e-D’Amar′e AR. Science. 2002;298:1421–1424. doi: 10.1126/science.1076093. [DOI] [PubMed] [Google Scholar]
- 58.Klein DJ, Ferré-D’Amaré AR. 2006 Sep;313:1752–1756. doi: 10.1126/science.1129666. [DOI] [PubMed] [Google Scholar]
- 59.Martick M, Lee T-S, York DM, Scott WG. Chem Biol. 2008;15:332–342. doi: 10.1016/j.chembiol.2008.03.010. [DOI] [PMC free article] [PubMed] [Google Scholar]
- 60.Cerrone-Szakal AL, Siegfried NA, Bevilacqua PC. J Am Chem Soc. 2008;130:14504–14520. doi: 10.1021/ja801816k. [DOI] [PubMed] [Google Scholar]
- 61.Wilson TJ, Lilley DM. RNA. 2011;17:213–221. doi: 10.1261/rna.2473711. [DOI] [PMC free article] [PubMed] [Google Scholar]
- 62.Becke AD. J Chem Phys. 1993;98:5648–5652. [Google Scholar]
- 63.Lee C, Yang W, Parr RG. Phys Rev B. 1988;37:785–789. doi: 10.1103/physrevb.37.785. [DOI] [PubMed] [Google Scholar]
- 64.Zhao Y, Truhlar DG. Theor Chem Acc. 2008;120:215–241. [Google Scholar]
- 65.Grimme S, Antony J, Ehrlich S, Krieg H. J Chem Phys. 2010;132:154104–154123. doi: 10.1063/1.3382344. [DOI] [PubMed] [Google Scholar]
- 66.Yanai T, Tew DP, Handy NC. Chem Phys Lett. 2004;393:51–57. [Google Scholar]
- 67.Montgomery JA, Jr, Frisch MJ, Ochterski JW, Petersson GA. J Chem Phys. 1999;110:2822–2827. [Google Scholar]
- 68.Montgomery JA, Jr, Frisch MJ, Ochterski JW, Petersson GA. J Chem Phys. 2000;112:6532–6542. [Google Scholar]
- 69.Frisch MJ, Trucks GW, Schlegel HB, Scuseria GE, Robb MA, Cheeseman JR, Scalmani G, Barone V, Mennucci B, Petersson GA, Nakatsuji H, Caricato M, Li X, Hratchian HP, Izmaylov AF, Bloino J, Zheng G, Sonnenberg JL, Hada M, Ehara M, Toyota K, Fukuda R, Hasegawa J, Ishida M, Nakajima T, Honda Y, Kitao O, Nakai H, T V, Montgomery JA, Jr, Peralta JE, Ogliaro F, Bearpark M, Heyd JJ, Brothers E, Kudin KN, Staroverov VN, Kobayashi R, Normand J, Raghavachari K, Rendell A, Burant JC, Iyengar SS, Tomasi J, Cossi M, Rega N, Millam JM, Klene M, Knox JE, Cross JB, Bakken V, Adamo C, Jaramillo J, Gomperts R, Stratmann RE, Yazyev O, Austin AJ, Cammi R, Pomelli C, Ochterski JW, Martin RL, Morokuma K, Zakrzewski VG, Voth GA, Salvador P, Dannenberg JJ, Dapprich S, Daniels AD, Farkas O, Foresman JB, Ortiz JV, Cioslowski J, Fox DJ. Gaussian 09, Revision A.02. [Google Scholar]
- 70.Frisch MJ, Trucks GW, Schlegel HB, Scuseria GE, Robb MA, Cheeseman JR, Scalmani G, Barone V, Mennucci B, Petersson GA, Nakatsuji H, Caricato M, Li X, Hratchian HP, Izmaylov AF, Bloino J, Zheng G, Sonnenberg JL, Hada M, Ehara M, Toyota K, Fukuda R, Hasegawa J, Ishida M, Nakajima T, Honda Y, Kitao O, Nakai H, Vreven T, Montgomery JA, Jr, Peralta JE, Ogliaro F, Bearpark M, Heyd JJ, Brothers E, Kudin KN, Staroverov VN, Kobayashi R, Normand J, Raghavachari K, Rendell A, Burant JC, Iyengar SS, Tomasi J, Cossi M, Rega N, Millam JM, Klene M, Knox JE, Cross JB, Bakken V, Adamo C, Jaramillo J, Gomperts R, Stratmann RE, Yazyev O, Austin AJ, Cammi R, Pomelli C, Ochterski JW, Martin RL, Morokuma K, Zakrzewski VG, Voth GA, Salvador P, Dannenberg JJ, Dapprich S, Daniels AD, Farkas O, Foresman JB, Ortiz JV, Cioslowski J, Fox DJ. Gaussian09 Revision D.01. [Google Scholar]
- 71.Moser A, Range K, York DM. J Phys Chem B. 2010;114:13911–13921. doi: 10.1021/jp107450n. [DOI] [PMC free article] [PubMed] [Google Scholar]
- 72.Dewar MJS, Dieter KM. J Am Chem Soc. 1986;108:8075–8086. [Google Scholar]
- 73.Burk P, Koppel IA. Theor Chim Acta. 1993;86:417–427. [Google Scholar]
- 74.Burk P, Herodes K, Koppel I, Koppel I. Int J Quantum Chem. 1993;48:633–641. [Google Scholar]
- 75.Toomsalu E, Koppel IA, Burk P. J Chem Theory Comput. 2013;9:3947–3958. doi: 10.1021/ct4003916. [DOI] [PubMed] [Google Scholar]
- 76.Jurečka P, Šponer J, Černý J, Hobza P. Phys Chem Chem Phys. 2006;8:1985–1993. doi: 10.1039/b600027d. [DOI] [PubMed] [Google Scholar]
- 77.Řezáč J, Jurečka P, Riley KE, Černý J, Valdes H, Pluháčková K, Berka K, Řezáč T, Pitoňák M, Vondrášek J, Hobza P. Collect Czechoslov Chem Commun. 2008;73:1261–1270. [Google Scholar]
- 78.Case DA, Darden TA, Cheatham TE, III, Simmerling CL, Wang J, Duke RE, Luo R, Walker RC, Zhang W, Merz KM, Roberts B, Hayik S, Roitberg M, Seabra G, Swails J, Götz AW, Kolossváry I, Wong KF, Paesani F, Vanicek J, Wolf RM, Liu J, Wu X, Brozell SR, Steinbrecher T, Gohlke H, Cai Q, Ye X, Wang J, Hsieh MJ, Cui G, Roe DR, Mathews DH, Seetin MG, Salomon-Ferrer R, Sagui C, Babin V, Luchko T, Gusarov S, Kovalenko A, Kollman PA. AMBER 12. University of California; San Francisco, San Francisco, CA: 2012. [Google Scholar]
- 79.Hamm ML, Nikolic D, van Breemen RB, Piccirilli JA. J Am Chem Soc. 2000;122:12069–12079. [Google Scholar]
- 80.Kath-Schorr S, Wilson TJ, Li N-S, Lu J, Piccirilli JA, Lilley DMJ. J Am Chem Soc. 2012;134:16717–16724. doi: 10.1021/ja3067429. [DOI] [PMC free article] [PubMed] [Google Scholar]
- 81.Kaminski S, Gaus M, Elstner M. J Phys Chem A. 2012;116:11927–11937. doi: 10.1021/jp307264f. [DOI] [PubMed] [Google Scholar]
- 82.Kaminski S, Giese TJ, Gaus M, York DM, Elstner M. J Phys Chem A. 2012;116:9131–9141. doi: 10.1021/jp306239c. [DOI] [PMC free article] [PubMed] [Google Scholar]
- 83.Matsuzawa N, Dixon DA. J Phys Chem. 1992;96:6232–6241. [Google Scholar]
- 84.Hammond JR, Govind N, Kowalski K, Autschbach J, Xantheas SS. 2009 Dec;131:214103. doi: 10.1063/1.3263604. [DOI] [PubMed] [Google Scholar]
- 85.Foster ME, Sohlberg K. Phys Chem Chem Phys. 2010;12:307–22. doi: 10.1039/b912859j. [DOI] [PubMed] [Google Scholar]
- 86.Florián J, Baumruk V, Štrajbl M, Bedanárová L, Štěpánek J. J Phys Chem. 1996;100:1559–1568. [Google Scholar]
- 87.Banavali NK, MacKerell AD. J Am Chem Soc. 2001;123:6747–6755. doi: 10.1021/ja010295w. [DOI] [PubMed] [Google Scholar]
- 88.Foloppe N, Nilsson L, MacKerell AD., Jr Biopolymers(Nucleic Acid Sciences) 2002;61:61–76. [Google Scholar]
Associated Data
This section collects any data citations, data availability statements, or supplementary materials included in this article.