Abstract
The evolution of novel traits can involve many mutations scattered throughout the genome1,2. Detecting and validating such a suite of alleles, particularly if they arose long ago, remains a key challenge in evolutionary genetics1-3. Here we dissect an evolutionary tradeoff of unprecedented genetic complexity between long-diverged species. When cultured in 1% glucose medium supplemented with galactose, Saccharomyces cerevisiae, but not S. bayanus or other Saccharomyces species, delayed commitment to galactose metabolism until glucose was exhausted. Promoters of seven galactose (GAL) metabolic genes from S. cerevisiae, when introduced together into S. bayanus, largely recapitulated the delay phenotype in 1% glucose-galactose medium, and most had partial effects when tested in isolation. Variation in GAL coding regions also contributed to the delay when tested individually in 1% glucose-galactose medium. When combined, S. cerevisiae GAL coding regions gave rise to profound growth defects in the S. bayanus background. In medium containing 2.5% glucose supplemented with galactose, wild-type S. cerevisiae repressed GAL gene expression and had a robust growth advantage relative to S. bayanus; transgenesis of S. cerevisiae GAL promoter alleles or GAL coding regions was sufficient for partial reconstruction of these phenotypes. S. cerevisiae GAL genes thus encode a regulatory program of slow induction and avid repression, and a fitness detriment during the glucose-galactose transition but a benefit when glucose is in excess. Together, these results make clear that genetic mapping of complex phenotypes is within reach, even in deeply diverged species.
A central goal of evolutionary genetics is to understand how organisms acquire phenotypic novelties. Such traits, if they have evolved over long timescales, can have a genetic basis quite distinct from those arisen more recently4. In landmark cases, single genes underlying species differences have been pinpointed and validated5, but the polygenic architecture of ancient traits has remained a mystery.
In hybrids formed by mating Saccharomyces cerevisiae with other Saccharomyces species6, we noted a pattern of coherent, cis-regulatory variation in the seven genes of the galactose metabolic pathway. During growth in medium with glucose as the sole carbon source, the S. cerevisiae allele at each GAL gene conferred low expression relative to other Saccharomyces, except for the repressor GAL80, at which the S. cerevisiae allele drove expression up (Figure 1b). Likewise, purebred S. cerevisiae expressed GAL effectors at low levels in glucose, and GAL80 at high levels, relative to other species (Figure 1b and ref. 7). S. paradoxus, the sister species to S. cerevisiae, had an intermediate expression phenotype (Figure 1b). Thus, the S. cerevisiae GAL program is one of heightened glucose repression relative to other species, as a product of cis-regulatory changes at the five loci that encode the seven GAL genes. Because such a pattern is unlikely under neutrality8, these data raised the possibility that selective pressure on the GAL pathway had changed along the S. cerevisiae lineage.
Figure 1. Polygenic cis-regulatory evolution among yeast species in galactose metabolic genes.
a) Tree of Saccharomyces species studied here18. b) Ratios of expression between the indicated species and S. cerevisiae, of the indicated galactose metabolism gene during culture in glucose medium6. Total, expression measured in purebred species; cis, expression from the indicated species’ allele in a diploid hybrid between this species and S. cerevisiae, reflecting effects of cis-regulatory divergence.
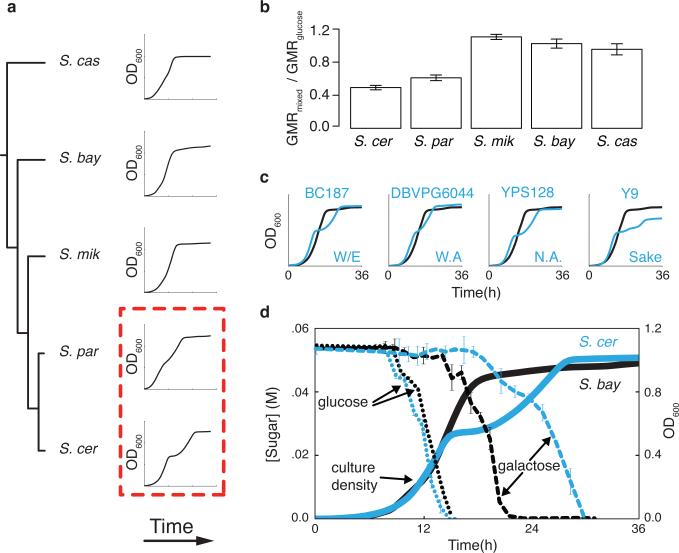
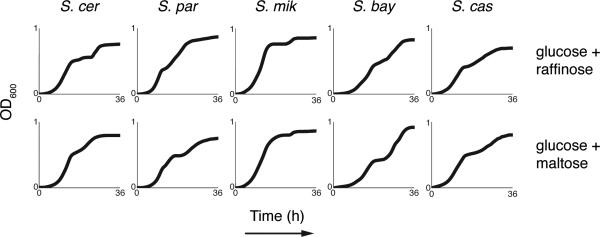
In S. cerevisiae, pre-expression of metabolic genes in glucose medium can boost fitness upon a switch to other carbon sources9-11. We therefore expected that GAL expression divergence in glucose could have phenotypic correlates in other conditions. Culturing cells in 1% glucose medium supplemented with galactose, we observed a qualitative distinction between species (Figure 2a). In S. cerevisiae, growth was retarded by a diauxic lag midway through the timecourse, reflecting the expected delay in assembling galactose metabolic machinery once glucose is exhausted9,10,12. In more distantly related yeasts, we observed no lag in 1% glucose-galactose medium supplemented with galactose (Figure 2a-b), although S. paradoxus had a modest lag (Figure 2a-b) that echoed its intermediate regulatory phenotype (Figure 1b). Glucose mixtures with maltose and raffinose engendered a lag in all members of the clade (Extended Data Figure 1). S. cerevisiae strains from distinct populations all exhibited a lag in glucosegalactose cultures (Figure 2c). These data highlight S. cerevisiae as an extreme among Saccharomyces with respect to two attributes of galactose metabolism: reduced GAL gene expression during growth in pure glucose, and diauxic lag in 1% glucose-galactose medium supplemented with galactose.
Figure 2. Diauxic lag, in 1% glucose-galactose medium, is conserved within S. cerevisiae and divergent among species.
a) Growth of Saccharomyces type strains inoculated into medium containing 1% glucose and 1% galactose. b) Geometric means of the growth rates (GMR) from a, normalized to the analogous quantity in glucose medium. c) Growth of S. cerevisiae isolates (blue) from the indicated populations (W/E, Wine/European; W.A., West African; N.A., North American) and the S. bayanus type strain (black), inoculated into medium containing 1% glucose and 1% galactose. d) Growth (solid lines) of S. cerevisiae and S. bayanus inoculated into medium containing 1% glucose and 1% galactose, and medium concentrations of glucose and galactose (dotted and broken lines, respectively). Error bars report standard error of the mean.
To dissect further the divergence in galactose metabolic behaviors, we focused on a comparison of S. cerevisiae with its distant relative S. bayanus var. uvarum (S. bayanus). In 1% glucose-galactose medium, both species initially metabolized glucose with similar rates, indicating that neither used the sugars simultaneously (Figure 2d). In S. bayanus cultures, galactose consumption began at a point just before the complete exhaustion of glucose. For S. cerevisiae, glucose exhaustion triggered the diauxic lag, during which galactose levels in its culture medium were largely unchanged. After the lag, with the eventual resumption of log-phase growth by S. cerevisiae, galactose levels finally dropped (Figure 2d). These results implicate the transition between glucose and galactose metabolism as a nexus of phenotypic differences between the species.
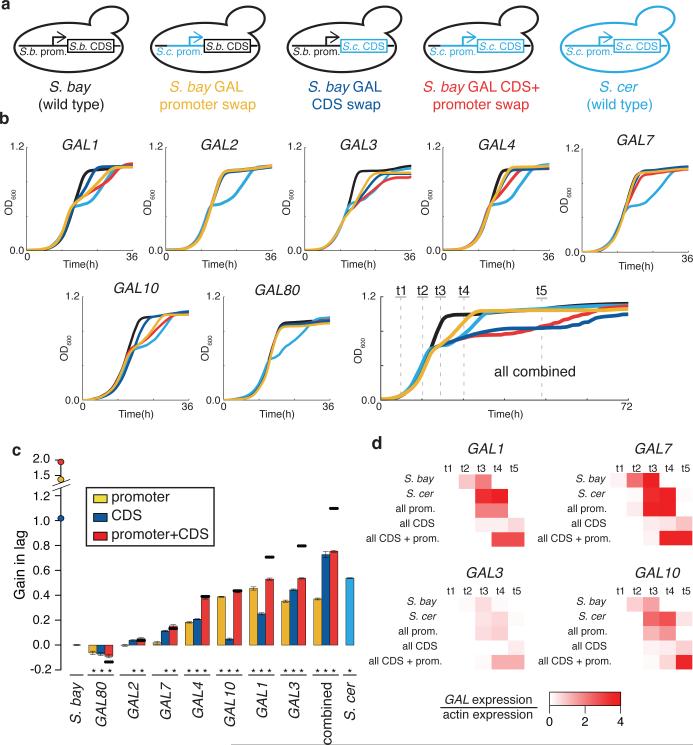
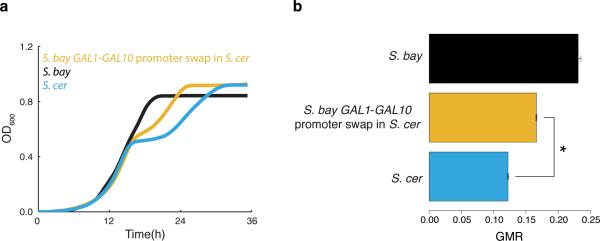
For direct tests of the phenotypic impact of divergence at the GAL genes, we replaced GAL gene sequences in one species by those of the other at the endogenous loci (Figure 3a). In a first investigation of GAL promoters, S. cerevisiae alleles of the regions upstream of GAL1, GAL3, GAL4, and GAL10 were each sufficient for a partial gain in diauxic lag in S. bayanus, in 1% glucose-galactose medium (Figure 3b-c). Control experiments established the inverse effect of S. bayanus GAL promoter alleles, reducing lag in the S. cerevisiae background (Extended Data Figure 2).
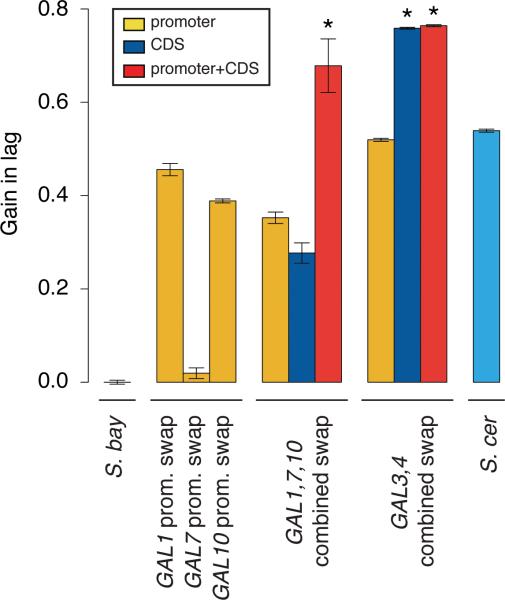
Figure 3. S. cerevisiae alleles of GAL genes confer diauxic lag in 1% glucose-galactose medium.
a) Replacement of S. cerevisiae GAL sequences into S. bayanus at the endogenous loci. b) Growth of S. bayanus harboring S. cerevisiae alleles of a single GAL gene, or of all seven genes, inoculated into medium containing 1% glucose and 1% galactose. c) Each bar reports the ratio of the GMR from b to that of wild-type S. bayanus, subtracted from 1; negative values are GMRs faster than wild-type. Error bars report standard error of the mean. Asterisks, significant differences (p < 0.001, Wilcoxon rank-sum) from wild-type S. bayanus. Also shown are expected phenotypes of promoter-CDS transgenics for a single gene (horizontal lines) or seven-locus transgenics (circles on y-axis), under an additive model of contributions from the regions combined in the respective strains. d) GAL gene expression at timepoints indicated in the final panel of b.
We next aimed at a more complete reconstruction of S. cerevisiae-like galactose metabolic behaviors, which we inferred to be derived, in S. bayanus as a representative of the likely ancestral state. An S. bayanus strain harboring all seven GAL promoters from S. cerevisiae recapitulated 69% of the lag phenotype of the S. cerevisiae parent (Figure 3b-c), with GAL gene expression peaking at the same timepoint as that of wild-type S. cerevisiae and at similar amplitude (Figure 3d). Comparison to the sum of lag effects from individual promoter swaps revealed negative epistasis in the seven-promoter replacement strain (Figure 3c), and in strains harboring intermediate S. cerevisiae promoter combinations (Extended Data Figure 3).
Transgenesis of individual S. cerevisiae GAL coding regions was also sufficient for a partial lag in S. bayanus, in the case of GAL1, GAL3, and GAL4 (Figure 3b-c). Swaps of GAL promoter-coding fusions revealed negative epistasis at GAL1 and GAL3: for these genes, the sum of phenotypes from the respective promoter- and coding transgenics was far more dramatic than the effect of the promoter-coding fusion (Figure 3c). Combining all seven S. cerevisiae GAL coding or promoter-coding regions in S. bayanus, we observed an exaggerated, long-term growth delay in 1% glucose-galactose medium, distinct from the temporary lag of wild-type strains and promoter transgenics (Figure 3b). This defect reflected dysfunction of multiple modules of the S. cerevisiae GAL pathway in S. bayanus, as it could be elicited by just the two regulators Gal3 and Gal4 swapped from S. cerevisiae, or just S. cerevisiae alleles of the enzymes Gal1, Gal7, and Gal10 (Extended Data Figure 3). Coding and promoter-coding swap strains did ultimately resume active growth (Figure 3b) and metabolize galactose from mixed-sugar medium (Extended Data Figure 4), and their GAL expression induction was markedly delayed (Figure 3d). These strains also grew poorly in pure galactose medium (Extended Data Figure 5). Together, our data make clear that diauxic lag in 1% glucosegalactose medium can be largely recapitulated by divergent GAL gene promoters; GAL protein alleles from S. cerevisiae make a partial contribution to lag when tested in isolation and, when combined in S. bayanus, confer growth defects far exceeding those of either wild-type.
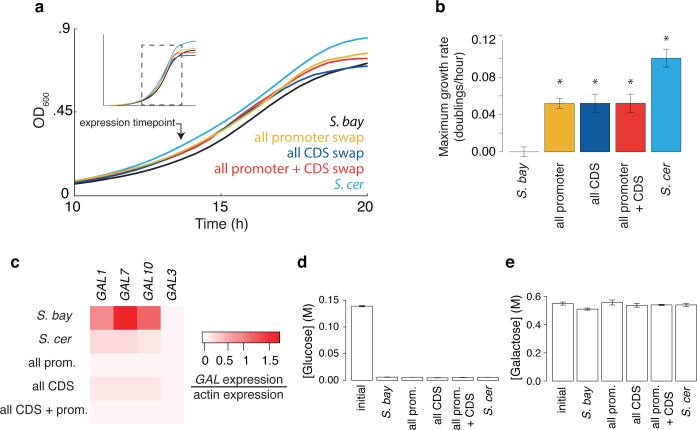
In light of the conservation of diauxic lag across S. cerevisiae (Figure 2c), we hypothesized that this species had maintained its divergent galactose metabolic behavior on the basis of a fitness benefit. Among the potential mechanisms for such an advantage, we focused on the possibility that as S. cerevisiae represses GAL genes in glucose-replete conditions (Figure 1), it avoids the liability of expressing unused proteins and enables rapid growth10,13. When cultured in 2.5% glucose medium also containing galactose, wild-type S. cerevisiae exhibited a 10% faster growth rate (Figure 4a-b), and 4-9 fold lower expression of GAL enzymes (Figure 4c), than S. bayanus. Both species metabolized glucose almost exclusively across the timecourse (Figure 4d-e). Replacement of all seven S. bayanus GAL promoters with S. cerevisiae alleles recapitulated the program of low GAL gene expression (Figure 4c), and conferred a growth rate halfway between those of the wild-type species (Figure 4a-b), in 2.5% glucose medium supplemented with galactose. The S. bayanus strain harboring all seven S. cerevisiae GAL coding regions also expressed GAL genes at low levels (Figure 4c), which mirrored this strain's exaggerated delay in GAL gene induction (Figure 3b-d), and was associated with a partial growth benefit (Figure 4a-b). Promoter-coding replacement conferred no additional phenotype over and above the effects of transgenesis of either region type alone (Figure 4a-c). We conclude that S. cerevisiae GAL promoters, by shutting down expression of the galactose metabolic pathway, are adaptive in conditions of abundant glucose, and this program can be phenocopied by S. cerevisiae GAL protein alleles in S. bayanus. Sequence analyses revealed a high ratio of inter-specific divergence to intra-species polymorphism in GAL gene promoters, though not in GAL coding regions (Extended Data Tables 1-3), suggestive of a history of directional evolution at these loci.
Figure 4. S. cerevisiae GAL alleles confer a fitness advantage in 2.5% glucose medium supplemented with galactose.
a) Growth of S. bayanus strains harboring S. cerevisiae alleles of all seven GAL genes, and the wild-type species, inoculated into medium containing 2.5% glucose and 10% galactose. b) Each bar reports the difference in maximum growth rate between the indicated species and wild-type S. bayanus from a. Error bars report standard error of the mean, and asterisks indicate rates significantly different (p < 1 X 10⁻⁸, Wilcoxon rank-sum) from wild-type S. bayanus. c) GAL gene expression at the timepoint indicated by the arrow in a. d-e) In each panel, the first bar reports sugar concentration in medium before inoculation; the remaining bars report sugar concentrations in medium after growth timecourses in a.
In this work, we have dissected glucose-specialist phenotypes that distinguish S. cerevisiae from other members of the Saccharomyces clade. S. cerevisiae is reluctant to transition from glucose to galactose metabolism, and has a growth advantage in a high-glucose environment. Additionally, the S. cerevisiae program confers an increase in biomass accumulation during growth in pure galactose (Extended Data Figure 5c) and could also be beneficial when glucose availability fluctuates rapidly11. As S. cerevisiae alleles of GAL gene promoters are largely sufficient for this family of traits, they may have served as an easily evolvable, and likely adaptive, origin of these characters. By contrast, the S. cerevisiae GAL proteome, which confers synthetic growth defects in modern-day S. bayanus, may have evolved slowly over a rugged fitness landscape, under distinct forces or at a different period. Such a model would dovetail with the cis-regulatory basis of a related, but genetically simple, galactose metabolism trait that evolved more recently between yeasts13. For any suite of divergent regulatory regions, observing cis-acting effects on gene expression can open a first window onto their phenotypic relevance and that of the gene products they control. With this paradigm, evolutionary biologists need not be limited by polygenicity in the mapping of genotype to phenotype, even between long-diverged species.
Materials and methods
Yeast strains
Strains used in this study are listed in Supplementary Table 1. Abbreviations in figures and tables are as follows: S. cer, Saccharomyces cerevisiae; S. par, Saccharomyces paradoxus; S. mik, Saccharomyces mikatae; S. bay, Saccharomyces bayanus; S. cas, Saccharomyces castellii. Allele-swap strains constructed in haploid S. bayanus JRY294 or JRY296 (isogenic MATa and MATα derivatives of type strain CBS7001) used the MIRAGE method14 with several modifications as follows. A 1.7kb region containing the K. lactis URA3 coding sequence and regulatory region was amplified from the pCORE-UH plasmid15 and used for each half of the inverted repeat. The S. cerevisiae GAL region to be swapped in was attached to one half of the inverted repeat cassette by overlap extension PCR, after which the two halves of the final cassette were ligated together. Due to the different sizes of the two halves of the inverted repeat cassette, a second restriction digestion step as described in ref. 14 was not necessary to remove non-desired ligation products. Transformation with the cassette, followed by confirmation of positive transformants and plating onto 5-FOA medium, resulted in excision of the inverted repeat from the target genome, leaving behind a marker-less allele swap at the locus. Sanger sequencing was used to verify the correct nucleotide sequence of each swapped allele. The S. cerevisae allele of each promoter and CDS was amplified from genomic DNA of YHL068 (ref. 6). Promoter, coding, and promoter-coding fusion swap strains were engineered by replacing 600bp of intergenic region directly upstream of the CDS, the CDS, or these two regions combined, respectively, in S. bayanus with orthologous regions from S. cerevisiae. For allele swaps in the S. cerevisiae background in Extended Data Figure 2, 720bp of the region between the GAL1 and GAL10 open reading frames was amplified from S. bayanus strain CBS7001 and used to construct a MIRAGE cassette as above, and transformed into S. cerevisiae strain JRY313 (isogenic MATa derivative of BY4743) and selected as above. For each transgenic, two or more independent transformants were used as replicates for growth profiling and sugar concentration measurements. Combining unlinked allele swaps into a single genome was accomplished by single-cell mating of single-locus swaps, followed by sporulation, tetrad dissection, and diagnostic PCR to identify segregant colonies with the allele combinations of interest. S. cerevisiae alleles of GAL1, GAL7 and GAL10 were combined in the S. bayanus background by successive allele swap transformations.
Growth curves and quantification
All growth experiments were conducted at 26°C in YP media (2% bacto-peptone, 1% yeast extract) supplemented with various carbon sources as follows. Experiments measuring diauxic lag in 1% glucose medium supplemented with galactose utilized medium containing 1% glucose and 1% galactose. Experiments measuring growth profiles in other non-galactose carbon sources utilized media containing 1% glucose and 1% of the secondary carbon source as indicated. Experiments measuring maximum growth rates in high-glucose media containing galactose utilized medium containing 2.5% glucose and 10% galactose. Experiments measuring growth profiles in pure galactose medium utilized media containing 2% galactose.
Growth timecourses were carried out as follows. Strains were grown in YP containing 2% galactose (Figure 4 and Extended Data Figure 5) or 2% glucose (all other figures) for 24 hours with shaking at 200rpm. Each strain was then back-diluted into the same medium to an OD of 0.1 and grown for an additional 6 hours. These log-phase cultures were then back-diluted to an OD of 0.02 in a 96-well plate containing 150μl of YP with the appropriate amount of a given carbon source. Plates were covered with a gas-permeable membrane, placed in a Tecan F200 plate reader and incubated with orbital shaking for the duration of each experiment. OD600 measurements were made every 30 minutes.
Gain in lag was calculated from growth curves as (1 - geometric mean rate) of a given strain. Geometric mean rate (GMR) was calculated as in ref. 11, with the following differences. A window of 0.1 to 0.8 OD units was used for quantification in all figures apart from Figure 2b. In Figure 2b, GMR was calculated within a window bounded by 20% and 80% of the maximum final yield attained during the time course for each species. Maximum growth rate was calculated as in ref. 10 except that a window of 0.01 to 0.3 OD units was used and a geometric mean of growth rates was calculated. Final growth yield was calculated as the difference between initial and final OD600 measurements as in ref. 16.
Replication schemes and analysis were as follows. To enable qualitative comparisons among species in Figures 2a, 2b and 2c, on a given 96-well plate, six biological replicate cultures of each strain were assayed. On each growth plate, replicate fitness values greater than two standard deviations from the mean of fitness values for that strain were considered artifacts of technical error and discarded. Displayed data for a given strain are the results of growth measurements from one plate and are representative of at least two plates cultured on different days. Experiments in Figure 2d were as in Figure 2a-2c except that four biological replicate cultures were measured.
To enable highly powered quantitative comparisons among strains of growth in 1% glucose-galactose medium in Figure 3b-c, 12 biological replicate cultures of each transgenic strain were assayed across several plates and days, in each case alongside replicates of wild-type S. bayanus and S. cerevisiae. The growth rate of a given strain measured on a given plate was normalized to the value for wild-type S. bayanus on that plate, and these normalized measurements were then averaged across plates. Because we included wild-type strains on each plate, their growth measurements as displayed in Figure 3b-c are averages over 78 and 54 replicates of S. bayanus and S. cerevisiae, respectively. Artifact filtering was as above. Differences in growth among strains were assessed for statistical significance by a two-sided Wilcoxon rank-sum test and a Bonferroni correction was applied in instances of multiple tests.
To enable highly powered quantitative comparisons among strains of growth in medium containing 2.5% glucose and 10% galactose in Figure 4a-b, we assayed growth of 250, 170, 204, 136, and 192 biological replicate cultures of wild-type S. bayanus, wild-type S. cerevisiae, the combinatorial promoter transgenic strains, the combinatorial promoter-coding transgenic strains, and the combinatorial coding transgenic strains, respectively, across several plates and days. As above, growth measurements for each strain in turn assayed on a given plate was normalized to the wild-type S. bayanus cultured on that plate, and normalized growth rate measurements were combined across plates. Artifact filtering and statistical testing were as above.
Experiments in Extended Data Figure 1 were as in Figure 2a-2c. Experiments for Extended Data Figure 2 were as in Figure 3 except that 12 replicate cultures were measured for each strain. Experiments for Extended Data Figure 3 were as in Figure 3b-c. Experiments for Extended Data Figure 4 were as in Figure 2a-2c.
Sugar measurements
For growth timecourse experiments in which sugar concentration was measured, an appropriate number of wells (see below) were inoculated into a 96-well plate and cultured in the Tecan F200 plate reader as above, such that media from at least two replicate wells could be harvested at each timepoint of interest and at least four replicate cultures of each strain would remain untouched for growth curve analysis. Samples were taken for sugar measurement by cutting the membrane covering the 96-well plate with a razor and extracting all 150μl of cell culture in a given well. Care was taken to only puncture the membrane above the harvested well such that adjacent wells were not affected. Cells and debris were pelleted from the sampled culture by brief centrifugation and the supernatant was extracted for quantification of glucose and galactose. Glucose was measured using the GlucCell glucose monitoring system (Chemglass Life Sciences). Galactose was measured with the Amplex Red Galactose Oxidase assay kit (Molecular Probes, Life Technologies). For galactose measurements, a Tecan Safire plate reader (Tecan) was used to quantify fluorescence and the relationship between fluorescence and galactose concentration was determined using a standard curve.
Data in Figure 2d were obtained by sampling two biological replicate cultures at each timepoint. Data in Figure 4d, 4e and Extended Data Figure 4 were obtained by sampling three biological replicate cultures at both the start and endpoints of the growth timecourse. For all experiments, three technical replicates were assayed for each biological replicate culture sampled, and mean values are reported. All data are representative of two identical experiments conducted on different days.
Quantitative PCR
Timepoint samples for qPCR analysis were obtained from cultures analogously to those obtained for sugar consumption quantification detailed above. Between two and fifteen replicate wells were harvested at each timepoint and pooled in order to have sufficient biological material for RNA isolation. RNA was isolated using an RNeasy mini kit (Qiagen) and cDNA was synthesized using SuperScript III (Life Technologies). DyNAmo HS SYBR green (Thermo Scientific) was used for quantitative PCR and all quantification was done on a CFX96 machine (BioRad). Gene expression levels relative to ACT1 were calculated using the 2^ΔΔCt method17. Three technical replicates per biological sample were assayed, and mean values are reported. Primer sequences and cycling times are in Supplementary Table 2.
Sequence analyses
Custom Python scripts were used to extract coding sequences and 600bp promoter regions for type strains of S. paradoxus, S. mikatae, and S. bayanus18 for each gene that had an ortholog in each of the five Saccharomyces sensu strico species as reported in ref. 18. S. cerevisiae population sequences were downloaded from the following sources:
YJM978, UWOPS83-787, Y55, UWOPS05-217.3, 273614N, YS9, BC187, YPS128, DBVPG6765, YJM975, L1374, DBVPG1106, K11, SK1, 378604X, YJM981, UWOPS87-2421, DBVPG1373, NCYC3601, YPS606, Y12, UWOPS05-227.2, and YS2 from http://www.yeastrc.org/g2p/home.do; Sigma1278b, ZTW1, T7, and YJM789 from http://www.yeastgenome.org/; and RM11 from http://www.broadinstitute.org/annotation/genome/saccharomyces_cerevisiae. S .cerevisiae sequences were aligned to each of the other three species in turn using FSA (ref. 19), using the ‘--nucprot’ option for the coding sequence alignments. For each set of species alignments, nucleotide replacement and polymorphic sites were tabulated using Polymorphorama20 for coding regions and custom Python scripts for promoter regions.
Sequence analyses of the seven genes of the GAL pathway (GAL1, GAL2, GAL3, GAL4, GAL7, GAL10, and GAL80) using S. paradoxus, S. mikatae, or S. bayanus as an outgroup were done as follows. For a given species comparison, we first calculated the NITG statistic21 for the promoter regions of the GAL genes using synonymous sites in the downstream gene as putative neutral sites, as
where i counts genes of the group, Ds and Dr denote the number of divergent synonymous and divergent promoter sites respectively, and Ps and Pr denote the number of polymorphic synonymous and polymorphic promoter sites respectively.
Minor alleles with a frequency of less than 0.15 were ignored22,23 and all site counts were corrected for multiple hits using a Jukes-Cantor model. In computing NITG for the seven genes of the GAL pathway, we considered that since GAL1 and GAL10 are adjacent genes on chromosome II sharing a 662bp promoter region, simply counting sites within 600bp promoter regions for each gene separately would have resulted in double-counting of 532bp. To avoid this, we aligned the 662bp intergenic region of these two genes and considered it one locus in the NITG calculation. Synonymous sites for this region were taken as the sum of such sites in both the GAL1 and GAL10 coding sequences. To evaluate significance, we generated 10,000 randomly chosen groups of six genes each and computed NITG across the promoters of each such null group as above. The empirical significance of the true NITG value for GAL gene promoters was then taken as the proportion of null groups whose promoters gave an NITG less than or equal to the true value. We assessed selection acting on non-synonymous sites in GAL coding sequences with a pipeline analogous to the above, except that GAL1 and GAL10 were considered separate loci, as the coding sequences do not overlap; thus our resampling test used 10,000 random groups of seven coding regions each. Tests for selection using the Neutrality Index statistic24 [(polymorphic non-synonymous sites/polymorphic synonymous sites) / (divergent non-synonymous / divergent synonymous sites), with a similar formulation for non-synonymous sites] used the same pipeline as above except that we tabulated the average NI across genes of a group, and compared this average quantity for the GAL genes against resampled groups of the same size.
DXY (ref. 25), the average number of pairwise differences between outgroup species and S. cerevisiae strains, and intrapopulation nucleotide diversity26 (π), were calculated using custom Python scripts. Nucleotide diversity was ascertained on alignments containing only S. cerevisiae strains belonging to the European population, the most deeply sampled in our data set. Empirical significance of these statistics for GAL gene promotes and coding sequences was calculated using the resampling pipeline described above.
Code availability
Custom Python scripts used for data analysis are available upon request.
Extended Data
Extended Data Figure 1. Divergence in the S. cerevisiae diauxic lag trait is specific to growth in glucose-galactose medium.
Each trace reports growth of the indicated yeast inoculated into medium containing 1% glucose and 1% of the indicated secondary carbon source.
Extended Data Figure 2. The S. bayanus allele of the GAL1 and GAL10 promoters confers partial rescue of diauxic lag in S. cerevisiae in 1% glucose-galactose medium.
a) Data are as in Figure 3b of the main text, except that the yellow curve reports growth of an S. cerevisiae strain harboring the GAL1 and GAL10 promoters from S. bayanus. b) Each bar reports the geometric mean growth rate (GMR) of the strains shown in a. Error bars report standard error of the mean, and the asterisk indicates a significantly different rate (p < 1 X 10⁻¹⁵, Wilcoxon rank-sum) between the transgenic swap strain and wild-type S. cerevisiae.
Extended Data Figure 3. Intermediate combinations of S. cerevisiae GAL gene alleles confer an exaggerated lag defect on S. bayanus, in 1% glucose-galactose medium.
Each bar reports the ratio of the GMR to that of wild-type S. bayanus, subtracted from 1, from a timecourse of the indicated strain inoculated into medium containing 1% glucose and 1% galactose. The first through fourth bars, and the last bar, are from Figure 3c of the main text; each of the remaining bars reports results from an S. bayanus strain harboring S. cerevisiae alleles at the indicated combination of GAL loci. Symbols and analyses are as in Figure 3c of the main text.
Extended Data Figure 4. S. bayanus strains harboring S. cerevisiae alleles of all seven GAL loci, inoculated into 1% glucose-galactose medium, deplete growth media of galactose.
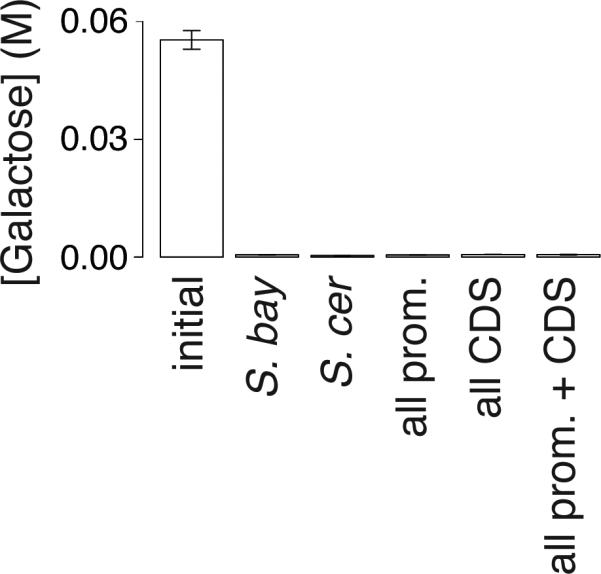
The first bar reports galactose concentration in medium before inoculation, and the remaining bars report concentrations after growth timecourses, in the experiments in Figure 3b of the main text.
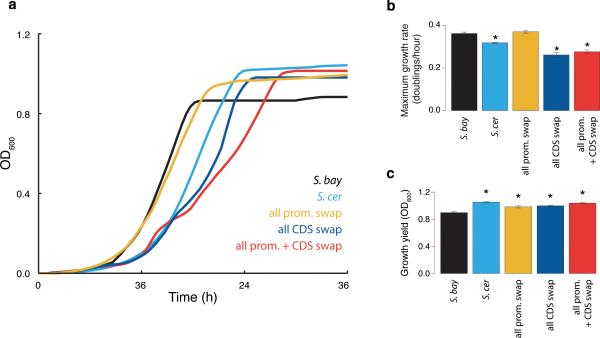
Extended Data Figure 5. In pure galactose medium, S. cerevisiae alleles of GAL loci are sufficient for increased biomass accumulation and, in the case of protein-coding regions, slow growth.
a) Each trace reports growth of an S. bayanus strain harboring S. cerevisiae alleles of all seven GAL genes, or a wild-type control, inoculated into medium containing 2% galactose. b) Each bar reports maximum growth rate from the respective timecourse in a. Error bars report standard error of the mean, and asterisks indicate values significantly different (p < 0.05, Wilcoxon rank-sum) from wild-type S. bayanus. c) Each bar reports growth yield from the respective timecourse in a. Error bars report standard error of the mean, and asterisks indicate values significantly different (p < 0.05, Wilcoxon rank-sum) from wild-type S. bayanus.
Extended Data Table 1. Excess of divergence relative to polymorphism in GAL promoter regions.
Each panel reports analyses of the NITG measure21 comparing polymorphism within S. cerevisiae to divergence between S. cerevisiae and the indicated outgroup species, taken across promoter sites (a) or non-synonymous coding sites (b), with normalization by the analogous measure from synonymous coding sites. In a given panel, the first row reports NITG across the seven GAL genes, the second row reports the mean NITG from 10,000 randomly drawn gene groups, and the bottom row reports empirical significance of the distinction between GAL genes and the genomic null.
| a | |||
|---|---|---|---|
| Outgroup |
|||
| Statistic | S. par | S. mik | S. bay |
| NITG GAL promoters | 0.32 | 0.37 | 0.31 |
| NITG genome promoters | 0.72 | 0.91 | 0.73 |
| p-value | 0.025 | 0.013 | 0.018 |
| b | |||
|---|---|---|---|
| Outgroup |
|||
| Statistic | S. par | S. mik | S. bay |
| NITG GAL non-synonymous sites | 0.98 | 0.92 | 1.03 |
| NITG genome non-synonymous sites | 1.28 | 1.21 | 1.27 |
| p-value | 0.25 | 0.19 | 0.26 |
Extended Data Table 2. Divergence between species, and polymorphism within S. cerevisiae, at GAL loci.
a) The first line reports mean DXY for GAL promoters in comparisons between S. cerevisiae and outgroup species. The second line reports the analogous statistics for the mean of 10,000 randomly drawn gene groups, and the third line reports empirical significance of the distinction between GAL genes and the genomic null. The fourth, fifth, and sixth lines are analogous to the above except that GAL coding regions were analyzed. b) The first line reports π for GAL promoters or coding regions within S. cerevisiae. The second line reports the analogous statistics for the mean of 10,000 randomly drawn gene groups, and the third line reports empirical significance of the distinction between GAL genes and the genomic null.
| a | |||
|---|---|---|---|
| Outgroup |
|||
| DXY | S. par | S. mik | S. bay |
| GAL promoters | 0.172 | 0.276 | 0.328 |
| genome promoters | 0.15 | 0.241 | 0.281 |
| p-value | 0.147 | 0.099 | 0.045 |
| GAL CDS | 0.102 | 0.155 | 0.188 |
| genome CDS | 0.096 | 0.153 | 0.190 |
| p-value | 0.337 | 0.429 | 0.573 |
| b | ||
|---|---|---|
| π | promoters | CDS |
| GAL | 0.00067 | 0.00069 |
| genome | 0.00194 | 0.00113 |
| p-value | 0.181 | 0.513 |
Extended Data Table 3. Evaluation of selection acting on S. cerevisiae promoter and coding sequences using the neutrality index statistic.
Data are as in Extended Data Table 1 except that the neutrality index24 was used for each test.
| a | |||
|---|---|---|---|
| Outgroup |
|||
| Statistic | S. par | S. mik | S. bay |
| GAL promoters | 0.32 | 0.42 | 0.35 |
| genome promoters | 0.94 | 1.13 | 0.92 |
| p-value | 0.003 | 0.009 | 0.014 |
| b | |||
|---|---|---|---|
| Outgroup |
|||
| Statistic | S. par | S. mik | S. bay |
| GAL non-synonymous sites | 1.43 | 1.24 | 1.44 |
| genome non-synonymous sites | 2.02 | 1.88 | 1.80 |
| p-value | .30 | .22 | .36 |
Supplementary Material
Acknowledgements
This work was supported by NIH GM087432 to R.B.B. and a Hellman Graduate Fellowship from UC Berkeley to J.I.R. The authors thank Adam Arkin for his generosity with advice and resources; Jasper Rine for yeast strains; Ophelia Venturelli for technical expertise; and Avi Flamholz, Josh Schraiber and Patrick Shih for helpful discussions.
Footnotes
Author Contributions
J.I.R. and R.B.B designed experiments, J.I.R and K.C.C. conducted experiments, J.I.R analyzed data, and J.I.R. and R.B.B wrote the paper.
The authors declare no competing financial interests.
References
- 1.The genetic theory of adaptation: a brief history. 2005;6:119–127. doi: 10.1038/nrg1523. [DOI] [PubMed] [Google Scholar]
- 2.Rockman MV. THE QTN PROGRAM AND THE ALLELES THAT MATTER FOR EVOLUTION: ALL THAT'S GOLD DOES NOT GLITTER. Evolution. 2012 doi: 10.1111/j.1558-5646.2011.01486.x. [DOI] [PMC free article] [PubMed] [Google Scholar]
- 3.Pritchard JK, Pickrell JK, Coop G. The genetics of human adaptation: hard sweeps, soft sweeps, and polygenic adaptation. Curr. Biol. 2010;20:R208–15. doi: 10.1016/j.cub.2009.11.055. [DOI] [PMC free article] [PubMed] [Google Scholar]
- 4.SAVOLAINEN O, Lascoux M, Merilä J. Ecological genomics of local adaptation. Nat. Rev. Genet. 2013;14:807–820. doi: 10.1038/nrg3522. [DOI] [PubMed] [Google Scholar]
- 5.A golden age for evolutionary genetics? Genomic studies of adaptation in natural populations. Trends in Genetics. 2010;26:484–492. doi: 10.1016/j.tig.2010.08.004. [DOI] [PubMed] [Google Scholar]
- 6.Schraiber JG, Mostovoy Y, Hsu TY, Brem RB. Inferring Evolutionary Histories of Pathway Regulation from Transcriptional Profiling Data. PLoS Comput. Biol. 2013;9:e1003255. doi: 10.1371/journal.pcbi.1003255. [DOI] [PMC free article] [PubMed] [Google Scholar]
- 7.Caudy AA, et al. A new system for comparative functional genomics of Saccharomyces yeasts. Genetics. 2013;195:275–287. doi: 10.1534/genetics.113.152918. [DOI] [PMC free article] [PubMed] [Google Scholar]
- 8.Bullard JH, Mostovoy Y, Dudoit S, Brem RB. Polygenic and directional regulatory evolution across pathways in Saccharomyces. Proc. Natl. Acad. Sci. U.S.A. 2010;107:5058–5063. doi: 10.1073/pnas.0912959107. [DOI] [PMC free article] [PubMed] [Google Scholar]
- 9.Venturelli OS, Zuleta I, Murray RM, El-Samad H. Population Diversification in a Yeast Metabolic Program Promotes Anticipation of Environmental Shifts. PLoS Biol. 2015;13:e1002042. doi: 10.1371/journal.pbio.1002042. [DOI] [PMC free article] [PubMed] [Google Scholar]
- 10.Wang J, et al. Natural Variation in Preparation for Nutrient Depletion Reveals a Cost–Benefit Tradeoff. PLoS Biol. 2015;13:e1002041. doi: 10.1371/journal.pbio.1002041. [DOI] [PMC free article] [PubMed] [Google Scholar]
- 11.New AM, et al. Different Levels of Catabolite Repression Optimize Growth in Stable and Variable Environments. PLoS Biol. 2014;12:e1001764. doi: 10.1371/journal.pbio.1001764. [DOI] [PMC free article] [PubMed] [Google Scholar]
- 12.De Deken RH. The Crabtree effect: a regulatory system in yeast. Microbiology (Reading, Engl.) 1966;44:149–156. doi: 10.1099/00221287-44-2-149. [DOI] [PubMed] [Google Scholar]
- 13.Peng W, Liu P, Xue Y, Acar M. Evolution of gene network activity by tuning the strength of negative-feedback regulation. Nat Commun. 2015;6:1–9. doi: 10.1038/ncomms7226. [DOI] [PubMed] [Google Scholar]
- 14.Nair NU, Zhao H. Mutagenic inverted repeat assisted genome engineering (MIRAGE). Nucleic Acids Res. 2009;37:e9. doi: 10.1093/nar/gkn943. [DOI] [PMC free article] [PubMed] [Google Scholar]
- 15.Storici F, Resnick MA. Methods in Enzymology. Vol. 409. Elsevier; 2006. pp. 329–345. [DOI] [PubMed] [Google Scholar]
- 16.Warringer J, et al. Trait variation in yeast is defined by population history. PLoS Genetics. 2011;7:e1002111. doi: 10.1371/journal.pgen.1002111. [DOI] [PMC free article] [PubMed] [Google Scholar]
- 17.Livak KJ, Schmittgen TD. Analysis of Relative Gene Expression Data Using Real-Time Quantitative PCR and the 2–ΔΔCT Method. Methods. 2001;25:402–408. doi: 10.1006/meth.2001.1262. [DOI] [PubMed] [Google Scholar]
- 18.Scannell DR, et al. The Awesome Power of Yeast Evolutionary Genetics: New Genome Sequences and Strain Resources for the Saccharomyces sensu stricto Genus. G3 (Bethesda) 2011;1:11–25. doi: 10.1534/g3.111.000273. [DOI] [PMC free article] [PubMed] [Google Scholar]
- 19.Bradley RK, et al. Fast statistical alignment. PLoS Comput. Biol. 2009;5:e1000392. doi: 10.1371/journal.pcbi.1000392. [DOI] [PMC free article] [PubMed] [Google Scholar]
- 20.Haddrill PR, Bachtrog D, Andolfatto P. Positive and Negative Selection on Noncoding DNA in Drosophila simulans. Mol Biol Evol. 2008;25:1825–1834. doi: 10.1093/molbev/msn125. [DOI] [PMC free article] [PubMed] [Google Scholar]
- 21.Stoletzki N, Eyre-Walker A. Estimation of the neutrality index. Mol Biol Evol. 2011;28:63–70. doi: 10.1093/molbev/msq249. [DOI] [PubMed] [Google Scholar]
- 22.Charlesworth J, Eyre-Walker A. The McDonald-Kreitman Test and Slightly Deleterious Mutations. Mol Biol Evol. 2008;25:1007–1015. doi: 10.1093/molbev/msn005. [DOI] [PubMed] [Google Scholar]
- 23.He BZ, Holloway AK, Maerkl SJ, Kreitman M. Does Positive Selection Drive Transcription Factor Binding Site Turnover? A Test with Drosophila Cis-Regulatory Modules. PLoS Genetics. 2011;7:e1002053. doi: 10.1371/journal.pgen.1002053. [DOI] [PMC free article] [PubMed] [Google Scholar]
- 24.Rand DM, Kann LM. Excess amino acid polymorphism in mitochondrial DNA: contrasts among genes from Drosophila, mice, and humans. Mol Biol Evol. 1996;13:735–748. doi: 10.1093/oxfordjournals.molbev.a025634. [DOI] [PubMed] [Google Scholar]
- 25.Nei M. Molecular Evolutionary Genetics. Columbia University Press; New York: 1987. [Google Scholar]
- 26.Nei M, Li WH. Mathematical model for studying genetic variation in terms of restriction endonucleases. Proc. Natl. Acad. Sci. U.S.A. 1979;76:5269–5273. doi: 10.1073/pnas.76.10.5269. [DOI] [PMC free article] [PubMed] [Google Scholar]
Associated Data
This section collects any data citations, data availability statements, or supplementary materials included in this article.


