Abstract
Purpose:
Analysis and comparison of airways imaged in pairs of inspiration and expiration lung CT scans provides important information for quantitative assessment of lung diseases like chronic obstructive pulmonary disease. However, airway tree reconstruction in expiration CT scans is a challenging problem. Typically, only a low number of airway branches are found in expiration scans, compared to inspiration scans. To detect more airways in expiration CT scans, the authors introduce a novel airway reconstruction approach and assess its performance.
Methods:
The method requires a pair of inspiration and expiration CT scans and utilizes information from the inspiration scan to facilitate reconstructing the airway tree in the expiration lung CT scan. First, an initial airway tree (high confidence) and airway candidates (limited confidence) are reconstructed in the expiration scan by utilizing a 3D graph-based reconstruction method. Then, the 3D airway tree is reconstructed in the inspiration scan. Second, correspondences between expiration and inspiration tree structures are identified by utilizing a novel hierarchical tree matching algorithm that utilizes a local CT image-based similarity criterion. Third, the tree information from the inspiration airway tree is used to select expiration candidates, resulting in the final expiration tree structure. The approach was evaluated on a diverse set of 40 scan pairs and compared to the baseline method, which utilizes only the expiration CT scan.
Results:
The proposed method produced a significant (p < 0.05) increase in airway tree length by 13.35 cm, on average, which represents an 11.21% increase relative to the baseline result using only the expiration CT scan. A detailed analysis of all additionally identified airways resulted in a true and false positive rate of 94.8% and 5.2%, respectively. The true positive rate was found to be significantly higher than the false positive rate (p < 0.05).
Conclusions:
The proposed method allowed increasing the number of found airways in expiration scans significantly. In addition, the algorithm establishes correspondence between inspiration and expiration airway trees, which can facilitate label transfer between airway trees and quantitative assessment of change in airways. The approach can be adapted to facilitate airway reconstruction in several longitudinal lung CT scans by means of mutual information transfer.
Keywords: airway reconstruction, expiration lung CT, tree matching
1. INTRODUCTION
Reconstruction of airway trees in chest CT scans is an important step for detection, characterization, and quantitative assessment of lung disease. While for several clinical applications, only an inspiration CT scan is necessary, the acquisition and analysis of paired inspiratory and expiratory CT scans enable physicians to quantitatively assess airway distensibility by comparing the airway luminal area between expiration and inspiration. This analysis provides important information for the assessment of lung diseases like chronic obstructive pulmonary disease (COPD) and asthma.1–7 For example, distensibility of airways is reduced and shows a strong correlation with COPD severity and lung function, as assessed by spirometry.4,6 From full inspiration to expiration, the airway luminal area shrinks more at the distal airways compared with the proximal airways.2,6 These smaller airways lack cartilage in their walls and thus show greater caliber changes with lung inflation than larger central airways.6 The assessment of airway distensibility is often limited by the lower detection rate of airways on expiratory CTs, especially for smaller airways. However, airway distensibility is a particularly important parameter in the assessment of smaller airways. Thus, enhancing the detection of airways on expiratory CTs will help in improving our ability to study and assess lung diseases by utilizing respiratory-gated CT imaging.
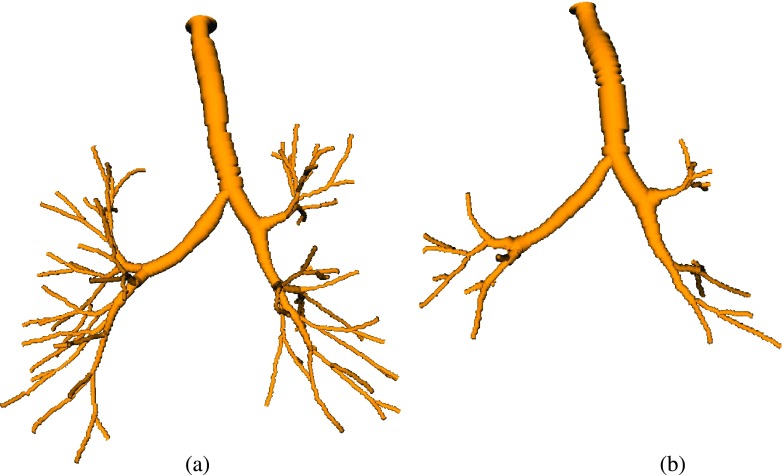
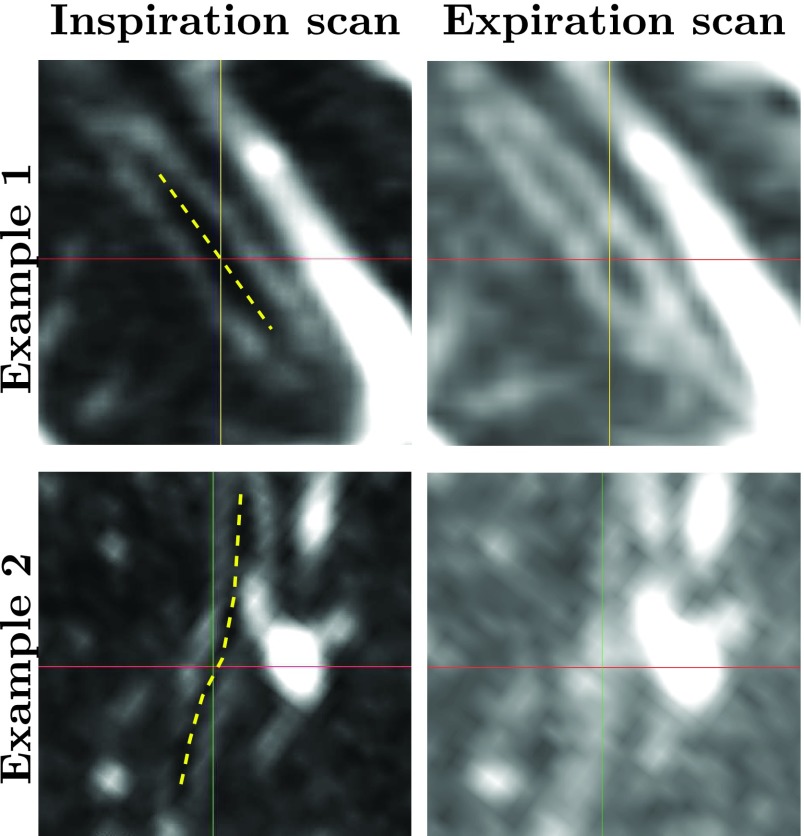
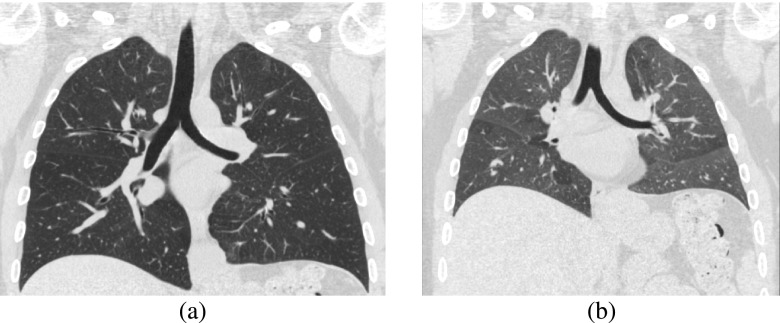
In the literature, several methods for segmentation of airways from CT scans have been reported, and detailed reviews can be found in the works of Pu et al.8 and Lo et al.9 Many of the published methods are based on some form of region-growing and utilize gray-value features. These methods are typically intended to be used for the segmentation of inspiration scans only, but this is often not explicitly mentioned in publications. However, the identification of airways in expiration scans is considerably more difficult compared to inspiration scans (Fig. 1), due to the reduced airway lumen (Fig. 2) and an increased radiodensity of the surrounding parenchyma (Fig. 3). Thus, while such conventional methods may also be applied to expiration scans, the obtained results are often suboptimal. For example, in an evaluation by van Ginneken et al.,10 their approach was able to extract on average 59 branches when applied to expiration scans, compared to 170 branches when applied to inspiration scans of the same patients.
FIG. 1.
Airway tree reconstruction results on an (a) inspiration scan and (b) corresponding expiration scan. Renderings of the airways are based on the centerline and radius estimate information.
FIG. 2.
Comparison of distal airways in inspiration and expiration CT scans of the same subject. The images show two examples of registered distal airway branches using a gray-value window of −1000 to −500 HU. The approximate centers of the investigated airway branches in the inspiration scans are shown as yellow dashed lines. The branch in example 1 is more difficult to identify in the expiration scan compared to the inspiration scan, while the branch in example 2 has no visible airway lumen in the expiration scan at all.
FIG. 3.
Comparison of lung parenchyma of (a) inspiration and (b) expiration CT scans of the same subject. Both images show coronal slices of the CT scans using a gray-value window of −1000 to 100 HU.
To the best of our knowledge, no explicit airway segmentation methods for expiration scans were published so far. One possible approach to improve airway detection performance in expiration scan could be to utilize a pair of inspiration and expiration CT volumes combined. Such an approach could utilize the fact that if an expiration scan is acquired in clinical routine, there is typically also an inspiration scan acquired during the same scan session.11 An additional benefit of a 4D approach could be that it can facilitate establishing a match between airway tree branches in expiration and inspiration volumes, which could be helpful for subsequent analysis steps.
However, up to now, only one group has explored the topic of combining information from several CT scans of the same subject. In their approach, Petersen et al.12,13 merge segmentation results from several (more then two) longitudinal inspiration scans into one consensus tree structure. The authors utilize a groupwise registration of the CT scans to establish voxelwise correspondences and then apply a rank-order filtering of the segmentations to establish a common structure. For a pair of inspiration and expiration scans, it would not be sufficient to register both scans and transform the segmentation result from one scan to the other, because a branch visible in one of the scans may not be visible in the other scan (e.g., example 2 in Fig. 2) and thus does not allow meaningful airway measurements.
In this paper, we present a method to improve the airway detection performance in expiration lung CT scans by utilizing information from the corresponding inspiration scan. The method is based on our previous work on graph-based 3D airway tree reconstruction from a single lung CT scan14 (Sec. 2) and enables it to combine evidence from expiration and inspiration scans. Therefore, we introduce a tree matching approach which is suitable for establishing correspondences between skeletons with substantially different complexity and demonstrate its application for improved airway detection in expiration scans. We evaluate the performance of the method on 40 expiration CT scans from four different cohorts, including patients with severe lung disease, and compare it to the standard 3D method. In addition, the presented approach provides correspondence between inspiration and expiration airways. Also, it can be extended to more than two scans.
2. PRIOR WORK ON 3D GRAPH-BASED AIRWAY TREE RECONSTRUCTION
In prior work, we presented a 3D graph-based airway tree reconstruction method.14 It performs an initial detection of potential airway branch and connection candidates before the method selects the candidates that will be included in the final airway tree by using an optimization procedure.
2.A. Generation of branch and connection candidates
Airway candidates are identified utilizing tube detection filters, which identify dark elongated tube-like structures in the CT volume. The filter results provide a measure of tube-likeliness together with radius estimates, which are transformed into a centerline-based representations using a height ridge traversal. The airway detection allows identification of thin, weakly contrasted airways, but it is not very specific and may result in many false responses. Potential connection paths between these airway branch candidates are established based on distance and gray-value path information.
2.B. Optimization-based tree reconstruction
The airway branch and connection candidates that will be included in the final airway tree reconstruction result are selected utilizing an optimization procedure. Therefore, they are represented in a graph and each airway branch and connection candidate is assigned a confidence (weight) that the candidate is actually part of the airway tree utilizing a combination of gray-value, local-shape, and structural information obtained from the CT scan. The optimization procedure first generates a fully connected loop-free tree structure utilizing an adapted version of Prim’s minimum spanning tree algorithm.15 Then, airway branches with insufficient confidence are removed using a pruning strategy based on the global graph partitioning algorithm.16
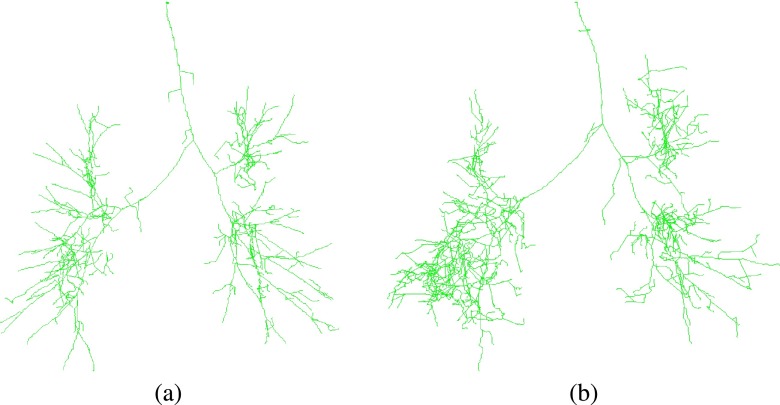
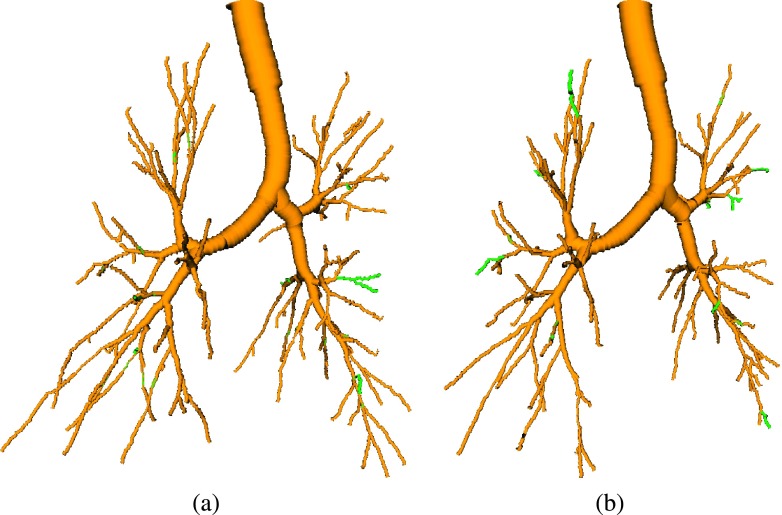
The method has been evaluated on a diverse set of inspiration CT scans of normal and diseased lungs as well as on the publicly available EXACT’09 database (see Lo et al.9) and results were presented in the work of Bauer et al.14 Processing results of the method on an inspiration and a corresponding expiration scan are depicted in Fig. 1. Intermediate processing results before pruning the initial tree structures are shown in Fig. 4. The method’s airway branch candidate detection is sensitive to weak evidence of an airway in the CT scan. As can be seen in Fig. 4(b), more additional airway branch candidates were identified by the method in the expiration, which are not included in the final airway tree structure. Most of these airway candidates are false positives, resulting from image noise or reconstruction artifacts, but some are actual airways. Distinguishing true from false airways in a bottom-up fashion is difficult because of ambiguities in image information.
FIG. 4.
Intermediate processing result of the 3D airway tree reconstruction algorithm (Ref. 14) on (a) an inspiration scan and (b) a corresponding expiration scan. Airway candidates are shown as green centerlines. The corresponding final airway reconstructions are shown in Fig. 1.
Once the airway tree reconstruction is completed, its result can be utilized as an initialization for a consecutive surface segmentation method (e.g., Liu et al.17) to produce an accurate segmentations of inner and outer airway wall surface.
3. METHOD
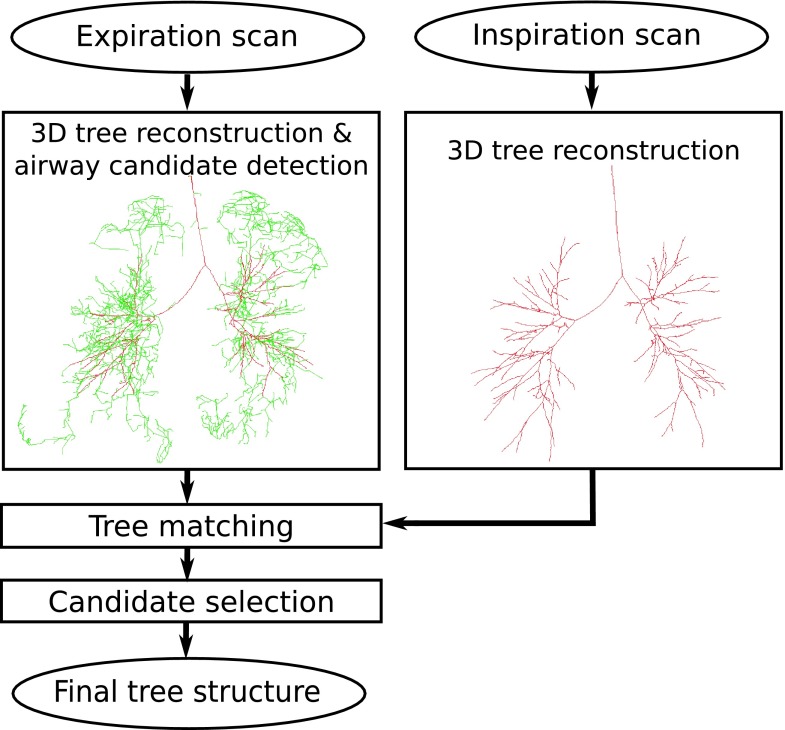
Our method utilizes information from the reconstructed inspiration airway tree to facilitate reconstructing the airway tree in the expiration lung CT scans. An overview of the approach is given in Fig. 5. First, the expiration scan and the corresponding inspiration scan are processed independently using the 3D airway tree reconstruction method described in Sec. 2. For the expiration scan, we maintain all airway candidates that normally would be removed by the optimization procedure of the 3D reconstruction method. Note that all these airway candidates show some, but limited, evidence for airways; they are tubular objects that are darker than their surrounding and are in close proximity to the resulting airway tree.14 However, the evidence from the expiration scan alone is insufficient for the 3D method to reliably distinguish true airways from background, and thus, they would not be included. To overcome this issue, we match the inspiration scan tree structure onto the expiration scan result and include all airway candidates with a matching partner in the inspiration scan to the expiration result.
FIG. 5.
Main processing steps of our approach to airway reconstruction in an expiration scan utilizing information derived from the corresponding inspiration scan. 3D tree reconstruction result is shown as red centerlines, and airway candidates as green centerlines (see color online version).
3.A. Representation of airway tree structures
For our application, the intermediate result (tree), including the final result as well as the additional airway branch candidates, of the algorithm described in Sec. 2 is represented using a structural centerline and radius-based description.
Each tree is represented as a rooted directed spanning tree T = (X, E), where the nodes are represented by centerline points X = {x1, x2, …, xn}, which are connected by directed edges E = {e1, e2, …, en−1}. Each centerline point, except the root node, has exactly one parent node p(xi) and an associated radius r(xi) obtained from the initial airway candidate detection (Sec. 2). Based on this notation, we define the signed distance to the surface of a tree structure and the closest centerline point of a tree with
| (1) |
| (2) |
respectively, where ‖...‖ represents the Euclidean norm. In this context, note that y is a point of the tree structure T and subtracting r(y) accounts for the radius of the airway. Thus, sd(x, T) is negative if x is inside of the tree structure and positive if x is outside of the tree structure.
3.B. Tree matching
After initial independent processing of inspiration and expiration scans with the 3D algorithm described in Sec. 2, we want to identify airway branch candidates in the expiration scan tree TE, which have a corresponding part in the inspiration scan result TI. This could be achieved either with a CT volume registration or tree matching approach. Registering pairs of lung CT scans such that airways accurately match, as required by our application, is nontrivial, requires complex algorithms, and is computationally expensive. In comparison, tree matching methods are more efficient, but methods published (e.g., see Metzen et al.18 for an overview) are typically not designed to deal with a potentially large imbalance in tree sizes, as it is the case in our application (Fig. 5).
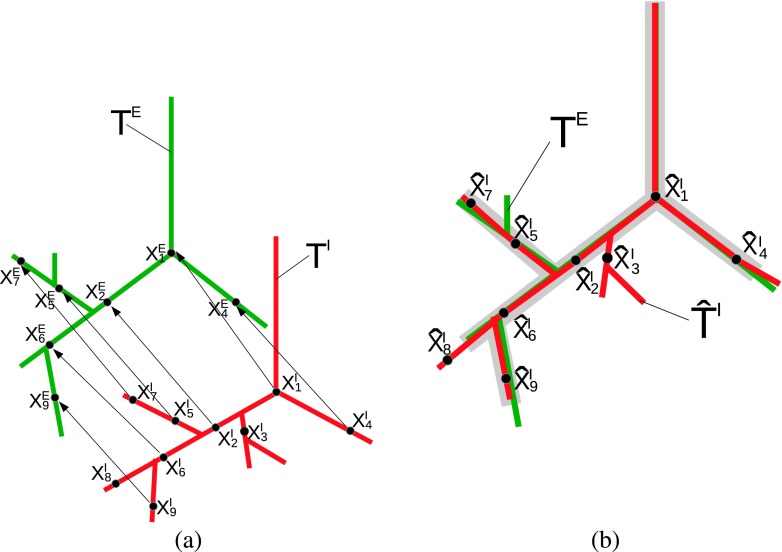
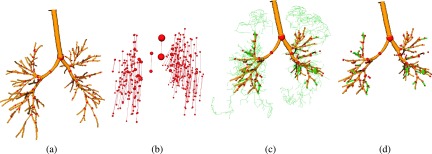
To avoid the above outlined issues, we propose a novel hierarchical tree matching algorithm, which utilizes a local CT-based similarity measure, to establish correspondence between expiration and inspiration tree structures by means of a displacement field [Fig. 6(a)]. This information is then utilized to identify branches common in both airway trees [gray area in Fig. 6(b)] to facilitate the expiration scan airway tree reconstruction process.
FIG. 6.
Matching of inspiration airway tree TI (red) and expiration airway tree TE (green). (a) Airway trees and displacement vectors for points on the inspiration tree, enabling transforming TI into the coordinate system of TE. Note that and do not have any correspondence in the expiration tree structure. (b) Transformed inspiration airway tree . Branches common in both airway trees are indicated with gray color (see color online version).
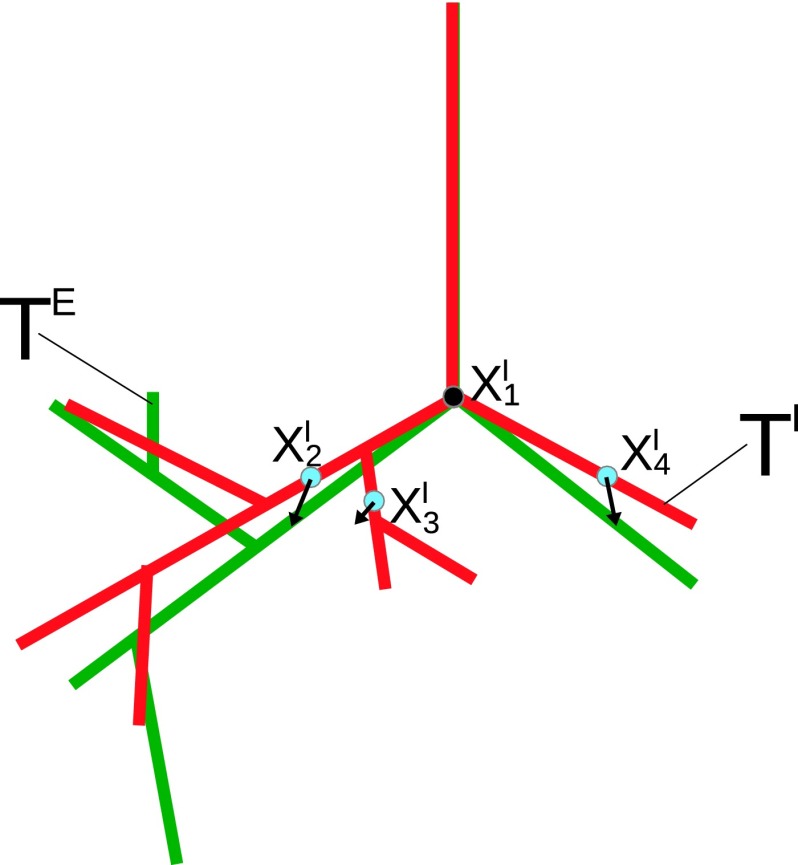
First, we automatically identify the end points of the trachea and in the inspiration and expiration scans [Fig. 6(a)], respectively, utilizing the method by Gu et al.19 gives the associated displacement vector . Second, starting from , a set of sample points SI along the centerline of the inspiration tree TI is obtained (Fig. 7). The sampling distance between the sample points [red points in Fig. 7(a)] is adaptive and set to the locally estimated radius. This results in a larger spacing on thicker branches and a smaller spacing on thinner branches. Third, for all these sample points, the algorithm obtains the associated displacement vectors in a hierarchical fashion, first processing points close to the trachea, working toward more distal parts of the tree structure. This hierarchical processing scheme allows the algorithm to utilize the parent sample point’s displacement vector as an estimate for the current sample point’s displacement vector (Fig. 8). The sampling points are sorted based on their geodesic distance from the trachea and are processed in this sequence. Other centerline points of the inspiration scan tree structure are transformed to the expiration scan based on interpolation between these sampling points.
FIG. 7.
Example of sample points SI located on the inspiration tree TI. (a) Sampling point density on airway skeleton, and (b) corresponding estimated airway radius.
FIG. 8.
After applying a displacement vector to the whole inspiration tree structure (red), nearby sample points (blue dots) are close to their true location (see color online version).
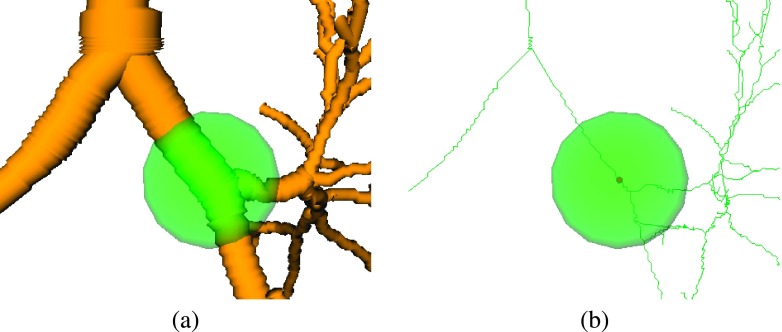
For each sampling point , the displacement vector is determined utilizing a spatially constraint template matching based on a spherical image patch. The image patch is centered around the centerline point with an adaptive diameter of [Figs. 9 and 10(a)]. Thus, the area does cover the airway lumen, but also the airway wall and local neighborhood. This image patch is matched to the expiration scan CE utilizing image registration with a similarity transformation (translation and rotation). Because of the hierarchical processing order of the sampling points, the displacement vector of the parent sample point serves as an initial estimate for the translation. We define the center of rotation as the center of the image patch and initialize with the rotation set to zero. The registration procedure optimizes the normalized cross correlation under the spatial constraint that , resulting in the sampling point’s final displacement vector. An example of the image patch before and after registration is shown in Figs. 10(c) and 10(d), respectively. The registration optimizes translation and rotation of the image patch. While the rotation component allows to obtain a more accurate matching, it is not utilized for calculating the final displacement vector.
FIG. 9.
Image patch (green sphere) centered around used by spatially constraint template matching to determine displacement vector .
FIG. 10.
Locally constraint template matching to determine displacement vector . A local image patch from the inspiration scan (a) is matched to the expiration scan (b). (c) Initial position and (d) final position of the image patch after registration overlaid on the expiration image.
The above described matching procedure is applied to all the sample points, resulting in the desired displacement vectors. Because we are only interested in determining the displacement for portions of the inspiration scan tree that have a corresponding part in the expiration tree structure, we use an early stop criterion to reduce computation time. Utilizing the initial displacement vector estimate for a sampling point of the inspiration scan, we test if the centerline point has a plausible correspondence in the expiration tree structure. If , we consider the sample point as too far away from the expiration tree structure to produce a valid match. Consequently, with all subsequent sampling points in its subtree are not further processed.
After determining displacement vectors for all sample points, TI is transformed into , and correspondences between the trees are established based on the signed distances between xE ∈ TE and [Fig. 6(b)],
| (3) |
3.C. Airway candidate selection
Using above described tree matching allows us to identify parts of the expiration tree that have correspondences in the inspiration tree (Fig. 11). We utilize this additionally obtained evidence to distinguish airway candidates that are true airways from background. For this purpose, we analyze all branches in the intermediate unpruned expiration scan tree structure. If an airway branch candidate has an at least 1 cm long continuous centerline piece with correspondence in the inspiration scan, the piece of the branch is included in the final expiration tree structure. The 1 cm threshold avoids that spurious noise-induced side branches get included in the final result. Figure 11(d) shows additionally selected airway candidate branches as bright green cylinders.
FIG. 11.
Tree matching and airway candidate selection. (a) Inspiration airway tree with a subset of matched points shown as red spheres. Note that only 10% of the actually matched sampling points are shown to reduce the complexity of the figures. (b) Displacement field of matched sampling points. (c) Expiration airway tree with 3D result (yellow), airway branch candidates (green), and matched points (red). (d) Resulting expiration airway tree with additionally selected airway candidates shown in green (see color online version).
4. EXPERIMENTAL SETUP
4.A. Image data
For development and evaluation of the method, pairs of inspiration and expiration chest CT scan from four different cohorts were available, including chest CT scans from subjects without any abnormalities (normals), subjects with COPD (including GOLD 1–4), asbestosis, and asthma (both severe and nonsevere). For each cohort, scan pairs of 20 subjects were available. Using stratified sampling, we split the data into two groups. A set with 40 scan pairs were utilized for method development and parameter adjustment. The remaining 40 scan pairs were exclusively utilized for performance assessment.
All inspiration scans were acquired at total lung capacity (TLC) and all expiration scans were acquired at functional residual capacity (FRC). Inspiration scans and corresponding expiration scans had matching in-plane pixel spacing and slice thickness, ranging from 0.49 to 0.74 mm (mean: 0.62 ± 0.06 mm) and 0.5 to 0.75 mm (mean: 0.71 ± 0.08 mm), respectively. Scans from cohorts normal, COPD, and asbestosis were obtained with Siemens scanners (22 scan pairs with Somatom Definition Flash and 18 scan pairs with Sensation 64) with a tube voltage of 240 kVp and tube currents in the range from 100 to 440 mA (median: 220 mA). Images were reconstructed using a B35f kernel. For cohort asthma, the CT datasets were only available to the authors after conversion from DICOM format to a file format that did only preserve a small subset of scan parameters.
4.B. Evaluation procedure and performance measures
To assess the performance of our method, we applied it to scans in the evaluation set. For comparison to a baseline, we also applied the previously presented 3D airway tree reconstruction method14 to the expiration scans. In the following, we will refer to them as “proposed” and “baseline” method. After tree reconstruction, all centerlines additionally included by the proposed method were visually inspected by a pulmonologist with several years experience and labeled as “true airway” or “false airway.” The utilized software facilitates the evaluation process and allowed visualization of airway tree structure, selection of individual centerline points, and visualization of associated cross sectional image slices. Based on the obtained results, the centerline lengths of the tree structures as well as the lengths of all branches labeled as true airways and false airways were measured and statistically analyzed.
Furthermore, we provide statistics about the number of additionally included branches. Note that the centerline of an added airway branch could potentially have one part labeled as true airway and the other part labeled as false airway. Therefore, centerline length is the preferred performance metric for assessment of detection performance. Because an additionally included airway may either represent a continuation of an existing airway or a new branch, we utilized the following approach for counting branches: every branch point and every terminal point in a newly added subtree counts as an additional branch.
Note that the described evaluation procedure has focused on assessing the achievable change in airway tree length at expiration. For an assessment of the base method (Sec. 2), the reader is referred to Bauer et al.14
5. RESULTS
5.A. Airway tree reconstruction performance
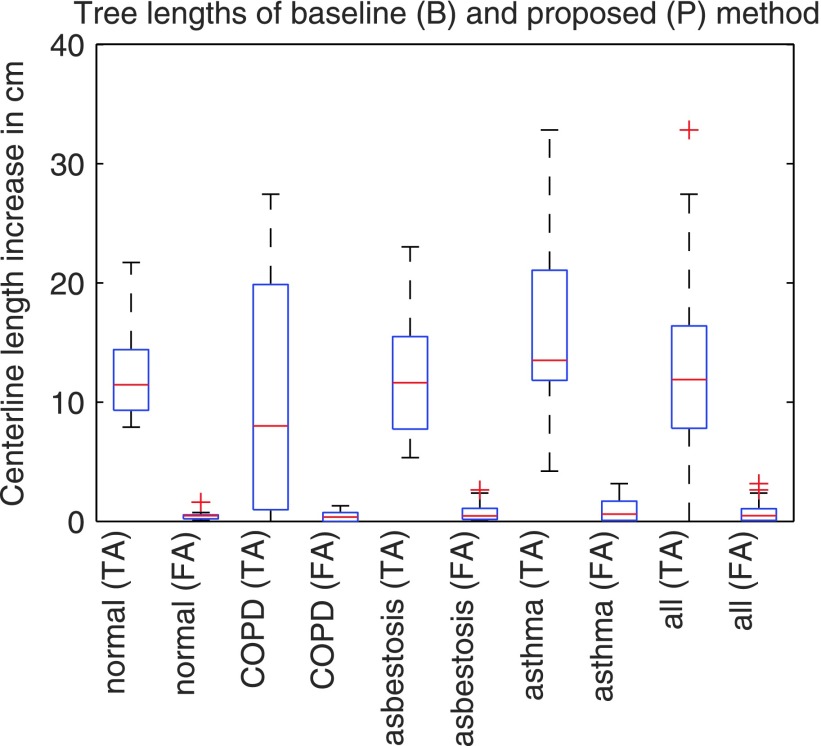
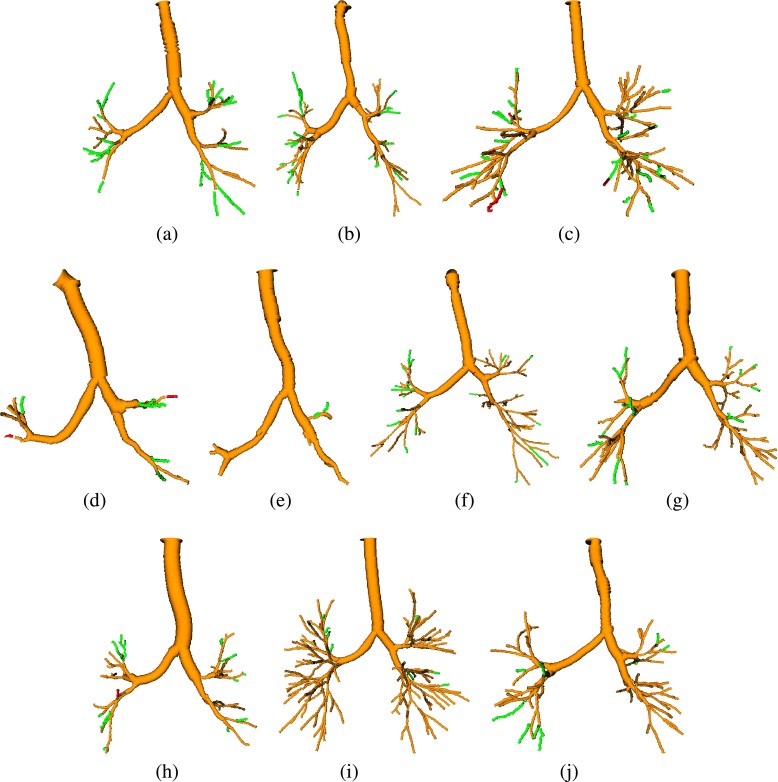
The resulting airway tree lengths for the baseline and proposed algorithm are summarized in Table I per cohort and combined over all test sets, respectively. Also, for all additional airways found with the proposed method, Table II and Fig. 12 provide statistics for true airways and false airways. Statistics about the number of additionally included branches are provided in Table III. In this context, note that our approach can only add airway centerlines to the baseline result, but cannot remove them. Compared to the baseline method, our approach identified on average 16.48 additional airway branches and allowed increasing the average centerline lengths of the airway trees in the expiration scans from 119.08 to 132.43 cm. Thus, the average increase in tree length was 13.35 cm or 11.21% relative to the results of the baseline method. This change was found to be statistically significant in Wilcoxon signed-rank tests for each cohort as well as the complete test set (p < 0.05). The majority (94.76%) of additionally identified centerlines were true airways. For each cohort and all cohorts combined, the difference between additionally identified true airways and false airways was also found to be statistically significant in Wilcoxon signed-rank tests (p < 0.05). Examples for segmentation results are shown in Fig. 13.
TABLE I.
Summary of tree lengths for each cohort and method. Provided measurements are mean ± standard deviation in cm. The difference between baseline and proposed method is analyzed in detail in Table II.
| Cohort | Baseline | Proposed |
|---|---|---|
| Normal | 129.14 ± 12.16 | 142.11 ± 13.45 |
| COPD | 91.29 ± 60.54 | 102.47 ± 65.63 |
| Asbestosis | 94.47 ± 44.94 | 107.36 ± 44.73 |
| Asthma | 161.41 ± 94.55 | 177.77 ± 92.64 |
| All | 119.08 ± 65.18 | 132.43 ± 66.49 |
TABLE II.
Increase in centerline lengths for each cohort. Centerlines that were added by the proposed method are reported by their total length (in cm) and as a percentage of the baseline method’s tree length (column baseline in Table I). True and false airways are quantified by their length and as a percentage of the additionally included centerlines.
| Cohort | Total | True airways | False airways |
|---|---|---|---|
| Normal | 12.97 (10.04%) | 12.47 (96.14%) | 0.50 (3.86%) |
| COPD | 11.18 (11.49%) | 10.71 (95.80%) | 0.46 (4.20%) |
| Asbestosis | 12.89 (13.64%) | 12.04 (93.41%) | 0.85 (6.59%) |
| Asthma | 16.36 (10.14%) | 15.38 (94.00%) | 0.98 (6.00%) |
| All | 13.35 (11.21%) | 12.65 (94.76%) | 0.70 (5.24%) |
FIG. 12.
Increase in true airways (TA) and false airways (FA) centerline lengths.
TABLE III.
Average and standard deviation of the number of additional branches found by the proposed approach per cohort.
| Cohort | Number of additional branches |
|---|---|
| Normal | 17.50 ± 4.88 |
| COPD | 12.00 ± 10.35 |
| Asbestosis | 15.90 ± 4.56 |
| Asthma | 20.50 ± 10.61 |
| All | 16.48 ± 8.40 |
FIG. 13.
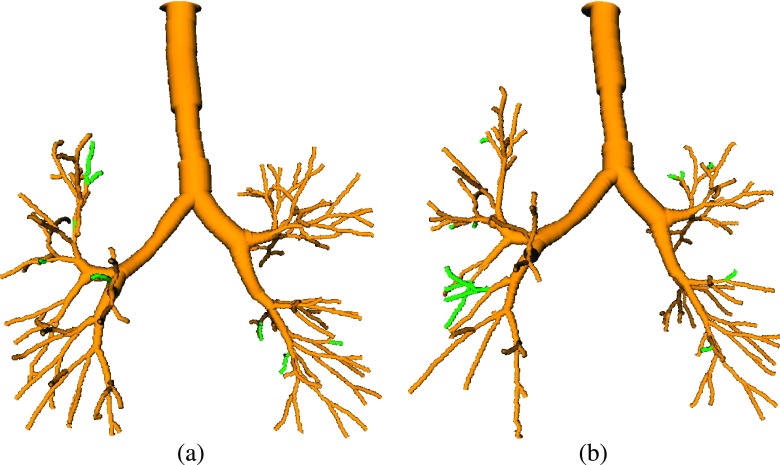
Examples of results, depicting the baseline result (yellow) and branches additionally included by the proposed method (green or red). True airways are shown in green, and false airways in red. [(a) and (b)] Examples with a large increase in tree length. (c) Example with the largest false airway length among all test cases. [(d) and (e)] Examples with a low increase in centerline length. [(f)–(j)] Examples of average results (see color online version).
5.B. Computing time
Our method initially performs 3D airway tree reconstruction on the inspiration scan and expiration scan separately before performing the tree matching and candidate selection steps. Applying the 3D method on a single CT scan (i.e., inspiration or expiration volume) takes on average about 10 min. The computational overhead for the proposed method (tree matching and candidate selection) was 1.5 min/test case, on average, using a nonoptimized implementation.
6. DISCUSSION
6.A. Airway tree reconstruction performance
The evaluation on a diverse set of 40 scan pairs (Sec. 5) has demonstrated the ability of our algorithm to significantly increase the centerline length of the airway trees in expiration scans (Table II and Fig. 12). The increase in true airways was found to be significantly larger than the increase in false airways on all cohorts, implying a net gain in true airways.
When looking at the box plots in Fig. 12, one can notice that for cohorts COPD, asbestosis, and asthma the interquartile range and extend of whiskers of the plots showing true airways increase, compared to the result on the normal cohort. This increase in variation can be explained as follows. First, in some cases, the method is quite successful in overcoming the obstacles that the baseline method faces when confronted with lung disease, resulting in more gain in tree length than for cohort normal. Second, some cases impose problems that are difficult to solve, even with detailed knowledge about the specific airway tree anatomy. For example, the box plot for COPD in Fig. 12 has a whisker that reaches zero. A closer examination of the CT scans in this cohort showed that there were several cases with severe obstructions of airways, resulting in not many visible airways, which imposes limits on the achievable gain in tree length.
6.B. Benefits and applications
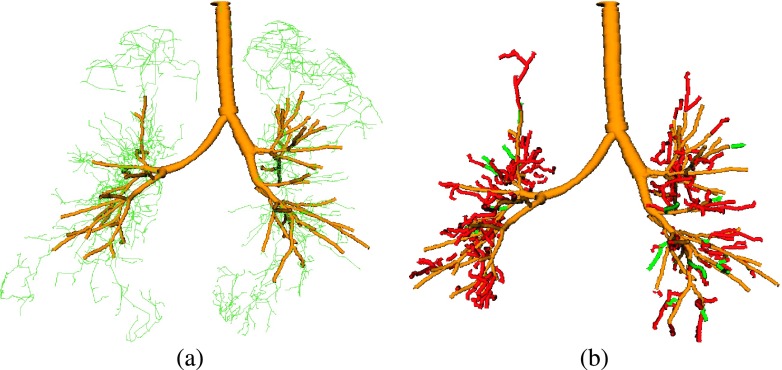
Compared to the 3D airway detection approach, the gain in centerline lengths of the airway trees, while keeping the amount of false airways low, is possible by utilizing information about airways found in the inspiration scan. Achieving a similar performance by solely utilizing the expiration scan is difficult, because of ambiguities. For example, Fig. 14 shows the result of the 3D reconstruction method (Sec. 2) after relaxing the method’s pruning criterion to the level such that all true airways, as produced by our proposed method [compare Fig. 13(c)], are included in the result. The vast majority of additionally added centerlines are false airways. This example illustrates the limitations of standard expiration scan airway detection without utilizing additional knowledge. The proposed approach overcomes this limitation.
FIG. 14.
Effect of relaxing the pruning criteria of the baseline method (Sec. 2). (a) Result (yellow) of the baseline method with additional airway candidates (green centerlines). (b) Result after relaxing the pruning criterion of the method such that all branches identified by the proposed method are included [compare Fig. 13(c)]. Some of the added branches are true airways (green), but most of them are false airways (red) (see color online version).
An additional advantage of our approach is that it establishes correspondence between airway trees in expiration and inspiration CT scans by generating a displacement field. This information could be utilized to transfer airway branch labels, compare local measurements (e.g., airway lumen diameter and wall thickness) between inspiration and expiration data sets, or roughly estimate lung deformation due to respiratory motion.
Our approach is computationally inexpensive, assuming that an independent (3D) airway detection step for inspiration and expiration scans would be performed anyway. One reason for the low additional overhead is the utilization of our novel hierarchical tree matching algorithm that avoids the combinatorial complexity caused by standard tree matching methods and does not need to establish a complete displacement field between inspiration and expiration scans.
The proposed method is quite flexible and can be utilized in different configurations. For example, it can be utilized to process a longitudinal pair of two inspiration scans (Fig. 15) or two expiration scans (Fig. 16). For such an application, an information transfer can be performed in both directions (i.e., form scan 1 to scan 2 and from scan 2 to scan 1). The same strategy could be used for pairs of inspiration and expiration scans, where the expiration tree provides information for the inspiration scan. However, in this case, we would expect only a low gain in the inspiration tree complexity. Further, the method can be extended to handle more than two CT data sets at the same time by means of mutual information transfer.
FIG. 15.
Results on a pair of longitudinal CT scans, both at TLC. The baseline method’s results are shown in yellow. Additionally found branches by utilizing our approach in combination with the other scan are shown in green. (a) Baseline scan. (b) Scan acquired several months later (see color online version).
FIG. 16.
Results on a CT scan pair, both acquired at residual volume (RV), from a study involving chest wall strapping (Ref. 20). The baseline method’s results are shown in yellow. Additionally found branches by utilizing our approach in combination with the other scan are shown in green. (a) With chest wall strapping. (b) Without chest wall strapping (see color online version).
6.C. Current limitations and future work
Segmenting many airway generations is nontrivial, especially in expiration scans. There are (hard) limitations for airway reconstruction due to low visibility of airways in expiration CT scans that cannot be overcome by subsequent analysis algorithms. Consequently, optimizing imaging protocols is an important future step to increase the number of detected airways. To guide this optimization process, experiments on more data sets are needed to characterize the impact of imaging parameters on the performance of our algorithm.
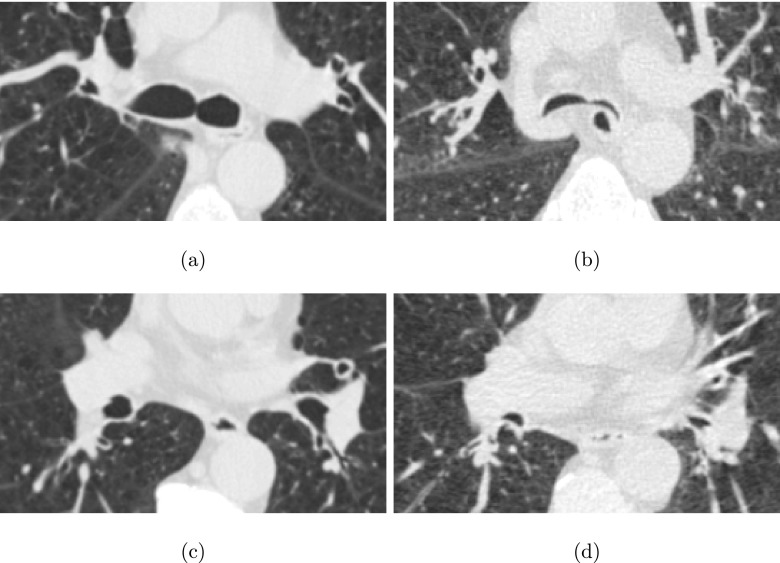
Our method is not completely free of errors or limitation. For example, Fig. 17 depicts cross sections from a pair of inspiration and expiration scans included in the test set. Due to tracheobronchomalacia, the shape of airways is quite different in the expiration scan, because airways appear deformed and almost collapse.21 This has two implications. First, the base performance of the 3D airway reconstruction method (Sec. 2) is impacted, leading to a lower number of potential candidates, which can affect our approach. Second, the change in airway appearance can lead to false matches, and subsequently, to early termination of centerline matching.
FIG. 17.
Comparison of airway shape in pairs of inspiration and expiration CT scans of a subject with tracheobronchomalacia. [(a) and (c)] Axial image slices from the inspiration scan. [(b) and (d)] Axial image slices from the expiration scan, showing roughly the same portion as in (a) and (c).
A limitation of our method is that the potential increase in detected expiration airways is bound by the airway tree reconstruction result of the inspiration scan. However, this is typically not a problem, unless there are severe imaging artifacts or other adverse circumstances that impact the inspiration scan airway tree reconstruction.
7. CONCLUSION
We have presented an approach for airway reconstruction in expiration lung CT scans that utilizes information about the airway tree found in the corresponding inspiration CT scan. The method is based on a novel hierarchical tree matching algorithm. The evaluation of this approach on a diverse set of 40 pairs of inspiration and expiration lung CT scans has demonstrated that significantly more airways were found compared to the standard approach. Thus, it is of utility for the quantitative assessment of lung diseases like COPD. In addition, the presented concept can be generalized to perform airway reconstruction in longitudinal (4D) lung image data.
ACKNOWLEDGMENTS
This work was supported in part by NIH/NHLBI Grant No. R01HL111453 as well as a PILOT grant from the Institute for Clinical and Translational Science at the University of Iowa via the NIH/NCATS Grant No. UL1TR000442. The authors thank Brian J. Smith at the University of Iowa for his support with statistical analysis.
REFERENCES
- 1.Scichilone N., La Sala A., Bellia M., Fallano K., Togias A., Brown R. H., Midiri M., and Bellia V., “The airway response to deep inspirations decreases with COPD severity and is associated with airway distensibility assessed by computed tomography,” J. Appl. Physiol. 105, 832–838 (2008). 10.1152/japplphysiol.01307.2007 [DOI] [PMC free article] [PubMed] [Google Scholar]
- 2.Castagnaro A., Rastelli A., Chetta A., Marangio E., Tzani P., Filippo M., Aiello M., D’Ippolito R., Olivieri D., Sverzellati N., and Zompatori M., “High-resolution computed tomography evaluation of airway distensibility in asthmatic and healthy subjects,” La Radiol. Med. 113, 43–55 (2008). 10.1007/s11547-008-0223-3 [DOI] [PubMed] [Google Scholar]
- 3.Hoshino M., Matsuoka S., Handa H., Miyazawa T., and Yagihashi K., “Correlation between airflow limitation and airway dimensions assessed by multidetector CT in asthma,” Respir. Med. 104, 794–800 (2010). 10.1016/j.rmed.2009.12.005 [DOI] [PubMed] [Google Scholar]
- 4.Diaz A. A., Come C. E., Ross J. C., San José Estépar R., Han M. K., Loring S. H., Silverman E. K., and Washko G. R., “Association between airway caliber changes with lung inflation and emphysema assessed by volumetric CT scan in subjects with COPD,” Chest 141, 736–744 (2012). 10.1378/chest.11-1026 [DOI] [PMC free article] [PubMed] [Google Scholar]
- 5.Pyrgos G., Scichilone N., Togias A., and Brown R. H., “Bronchodilation response to deep inspirations in asthma is dependent on airway distensibility and air trapping,” J. Appl. Physiol. 110, 472–479 (2011). 10.1152/japplphysiol.00603.2010 [DOI] [PMC free article] [PubMed] [Google Scholar]
- 6.Kambara K., Shimizu K., Makita H., Hasegawa M., Nagai K., Konno S., and Nishimura M., “Effect of lung volume on airway luminal area assessed by computed tomography in chronic obstructive pulmonary disease,” PLoS One 9, e90040 (2014). 10.1371/journal.pone.0090040 [DOI] [PMC free article] [PubMed] [Google Scholar]
- 7.Thomson N. C., Chaudhuri R., Spears M., Messow C.-M., MacNee W., Connell M., Murchison J. T., Sproule M., and McSharry C., “Poor symptom control is associated with reduced CT scan segmental airway lumen area in smokers with asthma,” Chest 147, 735–744 (2015). 10.1378/chest.14-1119 [DOI] [PubMed] [Google Scholar]
- 8.Pu J., Gu S., Liu S., Zhu S., Wilson D., Siegfried J. M., and Gur D., “CT based computerized identification and analysis of human airways: A review,” Med. Phys. 39, 2603–2616 (2012). 10.1118/1.4703901 [DOI] [PMC free article] [PubMed] [Google Scholar]
- 9.Lo P., van Ginneken B., Reinhardt J. M., Yavarna T., de Jong P. A., Irving B., Fetita C. I., Ortner M., Pinho R., Sijbers J., Feuerstein M., Fabijanska A., Bauer C., Beichel R., Mendoza C. S., Wiemker R., Lee J., Reeves A. P., Born S., Weinheimer O., van Rikxoort E. M., Tschirren J., Mori K., Odry B., Naidich D. P., Hartmann I., Hoffman E. A., Prokop M., Pedersen J. J. H., and de Bruijne M., “Extraction of airways from CT (EXACT’09),” IEEE Trans. Med. Imaging 31, 2093–2107 (2012). 10.1109/TMI.2012.2209674 [DOI] [PubMed] [Google Scholar]
- 10.van Ginneken B., Baggerman W., and van Rikxoort E. M., “Robust segmentation and anatomical labeling of the airway tree from thoracic CT scans,” in Medical Image Computing and Computer-Assisted Intervention–MICCAI (Springer, Berlin, Heidelberg, 2008), pp. 219–226. 10.1007/978-3-540-85988-8_27 [DOI] [PubMed] [Google Scholar]
- 11.Arakawa H. and Webb W. R., “Expiratory high-resolution CT scan,” Radiol. Clin. North Am. 36, 189–209 (1998). 10.1016/S0033-8389(05)70014-2 [DOI] [PubMed] [Google Scholar]
- 12.Petersen J., Modat M., Cardoso M. J., Dirksen A., Ourselin S., and de Bruijne M., “Optimal graph based segmentation using flow lines with application to airway wall segmentation,” in Medical Image Computing and Computer Assisted Intervention (Springer, Berlin Heidelberg, 2013), pp. 287–294. [Google Scholar]
- 13.Petersen J., Gorbunova V., Nielsen M., Dirksen A., Lo P., and de Bruijne M., “Longitudinal analysis of airways using registration,” in Fourth International Workshop on Pulmonary Image Analysis, Medical Image Computing and Computer Assisted Intervention (Springer, Berlin Heidelberg, 2013), pp. 11–22. [Google Scholar]
- 14.Bauer C., Eberlein M., and Beichel R. R., “Graph-based airway tree reconstruction from chest CT scans: Evaluation of different features on five cohorts,” IEEE Trans. Med. Imaging 34, 1063–1076 (2015). 10.1109/TMI.2014.2374615 [DOI] [PMC free article] [PubMed] [Google Scholar]
- 15.Cormen T. H., Leiserson C. E., Rivest R. L., and Stein C., Introduction to Algorithms, 3rd ed. (The MIT Press, Cambridge, 2009). [Google Scholar]
- 16.Graham M., Gibbs J., Cornish D., and Higgins W., “Robust 3-D airway tree segmentation for image-guided peripheral bronchoscopy,” IEEE Trans. Med. Imaging 29, 982–997 (2010). 10.1109/TMI.2009.2035813 [DOI] [PubMed] [Google Scholar]
- 17.Liu X., Chen D. Z., Tawhai M. H., Wu X., Hoffman E. A., and Sonka M., “Optimal graph search based segmentation of airway tree double surfaces across bifurcations,” IEEE Trans. Med. Imaging 32, 493–510 (2013). 10.1109/TMI.2012.2223760 [DOI] [PMC free article] [PubMed] [Google Scholar]
- 18.Metzen J. H., Kröger T., Schenk A., Zidowitz S., Peitgen H.-O., and Jiang X., “Matching of anatomical tree structures for registration of medical images,” Image Vision Comput. 27, 923–933 (2009). 10.1016/j.imavis.2008.04.002 [DOI] [Google Scholar]
- 19.Gu S., Zang Z., Siegfried J. M., Wilson D., Bigbee W. L., and Pu J., “Automated lobe-based airway labeling,” Int. J. Biomed. Imaging 2012, Article ID 382806. 10.1155/2012/382806 [DOI] [PMC free article] [PubMed] [Google Scholar]
- 20.Eberlein M., Schmidt G., and Brower R., “Chest wall strapping. An old physiology experiment with new relevance to small airways diseases,” Ann. Am. Thorac. Soc. 11, 1258–1266 (2014). 10.1513/AnnalsATS.201312-465OI [DOI] [PMC free article] [PubMed] [Google Scholar]
- 21.O’Donnell C., Bankier A., O’Donnell D., Loring S., and Boiselle P., “Static end-expiratory and dynamic forced expiratory tracheal collapse in COPD,” Clin. Radiol. 69, 357–362 (2014). 10.1016/j.crad.2013.11.003 [DOI] [PMC free article] [PubMed] [Google Scholar]


