

Abstract
Background and Purpose
The toll‐like receptor TLR4 is involved in neuropathic pain and in drug reward and reinforcement. The opioid inactive isomers (+)‐naltrexone and (+)‐naloxone act as TLR4 antagonists, reversing neuropathic pain and reducing opioid and cocaine reward and reinforcement. However, how these agents modulate TLR4 signalling is not clear. Here, we have elucidated the molecular mechanism of (+)‐naltrexone and (+)‐naloxone on TLR4 signalling.
Experimental Approach
BV‐2 mouse microglial cell line, primary rat microglia and primary rat peritoneal macrophages were treated with LPS and TLR4 signalling inhibitors. Effects were measured using Western blotting, luciferase reporter assays, fluorescence microscopy and ELISA
Key Results
(+)‐Naltrexone and (+)‐naloxone were equi‐potent inhibitors of the LPS‐induced TLR4 downstream signalling and induction of the pro‐inflammatory factors NO and TNF‐α. Similarly, (+)‐naltrexone or (+)‐naloxone inhibited production of reactive oxygen species and increased microglial phagocytosis, induced by LPS. However, (+)‐naltrexone and (+)‐naloxone did not directly inhibit the increased production of IL‐1β, induced by LPS. The drug interaction of (+)‐naloxone and (+)‐naltrexone was additive. (+)‐Naltrexone or (+)‐naloxone inhibited LPS‐induced activation of IFN regulatory factor 3 and production of IFN‐β. However, they did not inhibit TLR4 signalling via the activation of either NF‐κB, p38 or JNK in these cellular models.
Conclusions and Implications
(+)‐Naltrexone and (+)‐naloxone were TRIF‐IFN regulatory factor 3 axis‐biased TLR4 antagonists. They blocked TLR4 downstream signalling leading to NO, TNF‐α and reactive oxygen species. This pattern may explain, at least in part, the in vivo therapeutic effects of (+)‐naltrexone and (+)‐naloxone.
Abbreviations
- AP‐1
activator protein 1
- IRF3
IFN regulatory factor 3
- MD2
myeloid differentiation protein 2
- MyD88
myeloid differentiation primary response 88
- NBT
nitroblue tetrazolium
- STAT
signal transducer and activator of transcription
- TLR4
toll‐like receptor 4
- TRIF
TIR‐domain‐containing adapter‐inducing IFN‐β
Tables of Links
| TARGETS |
|---|
| Catalytic receptors |
| IFN receptors |
| TLR4, toll‐like receptor 4 |
| LIGANDS |
|---|
| (‐) Naloxone |
| (+) Naloxone |
| Naltrexone |
These Tables list key protein targets and ligands in this article which are hyperlinked to corresponding entries in http://www.guidetopharmacology.org, the common portal for data from the IUPHAR/BPS Guide to PHARMACOLOGY (Pawson et al., 2014) and are permanently archived in the Concise Guide to PHARMACOLOGY 2015/16 (Alexander et al., 2015).
Introduction
Historically, the biological basis of neuropathic pain (Grace et al., 2014; Ji et al., 2014) and drug reward (Hutchinson et al., 2011; Coller and Hutchinson, 2012) focused principally on neuronal activity. However, currently available drugs for these indications mostly affect signal transduction and transmission in neurons and have limited success in controlling the progressionof the disorders. Recent evidence indicates that inflammation in both central and peripheral immune systems is critically involved in the development and maintenance of chronic pain and drug reward (Hutchinson et al., 2011; Coller and Hutchinson, 2012; Grace et al., 2014; Ji et al., 2014).
The toll‐like receptor TLR4 is expressed on immunocompetent cells such as microglia and macrophages and is a critical trigger for the inflammatory activation of these cells (Hutchinson and Watkins, 2014). TLR4 detects pathogen‐associated molecular patterns (e.g. LPS) (Takeuchi and Akira, 2010), microbial‐associated molecular patterns (e.g. lipooligosaccharides) (De Castro et al., 2010), damage‐associated molecular patterns (e.g. high‐mobility group box 1) (Yang et al., 2010; Wang et al., 2013b) and xenobiotic‐associated molecular patterns (e.g. morphine) (Hutchinson et al., 2012; Wang et al., 2012b) and triggers both myeloid differentiation primary response 88 (MyD88) and TIR‐domain‐containing adapter‐inducing IFN‐β (TRIF)‐dependent signalling (Takeuchi and Akira, 2010). Both MyD88 and TRIF adaptor proteins lead to the activation of NF‐κB, whereas a different transcription factor, IFN regulatory factor 3 (IRF3), is activated by the TRIF pathway (Takeuchi and Akira, 2010). MyD88‐dependent signalling also activates the MAPK cascade, which is responsible for the activation of the transcription factor, activator protein 1 (AP‐1) (Takeuchi and Akira, 2010). Activation of NF‐κB and AP‐1 results in the up‐regulation of pro‐inflammatory cytokines, whereas activation of IRF3 induces production of type I IFN (Takeuchi and Akira, 2010). These factors can be secreted into extracellular space and down‐regulate glutamate transporter and GABA receptor expression, up‐regulate AMPA and NMDA receptor expression and function, and a variety of associated changes all in the direction of enhanced neuronal excitability, therefore contributing to neuropathic pain and drug dependence (Hutchinson et al., 2011; Coller and Hutchinson, 2012; Grace et al., 2014; Ji et al., 2014). Therefore, TLR4 comes to the forefront as a candidate therapeutic target for drug discovery (Wang et al., 2013b).
Long before the discovery of TLR4 (Poltorak et al., 1998), naltrexone and naloxone were found to block the biological effects of LPS (Sziebert et al., 1983), a component of the cell walls of Gram negative bacteria, which became recognized as a prototypic TLR4 agonist. Recently, we have found that naltrexone and naloxone non‐stereoselectively bind to the LPS binding pocket of myeloid differentiation protein 2 (MD2) (Hutchinson et al., 2012; Northcutt et al., 2015), the key co‐receptor of TLR4. Via this binding, naltrexone and naloxone reverse mechanical allodynia in several animal models of chronic pain (Hutchinson et al., 2008; Lewis et al., 2012). Compared with the opioid active (−)‐isomers, (+)‐naltrexone and (+)‐naloxone (Figure 1) are inactive at opioid receptors and do not antagonize the beneficial analgesic effect of opioids. Further, (+)‐naltrexone and (+)‐naloxone potentiated opioid‐induced analgesia and decreased opioid‐induced tolerance, hyperalgesia, conditioned place preference, self‐administration and incubation of craving (Wu et al., 2006; Hutchinson et al., 2010; Hutchinson et al., 2012; Theberge et al., 2013; Northcutt et al., 2015). Although (+)‐naltrexone and (+)‐naloxone show great translation potential in vivo (Watkins et al., 2014), how they modulate TLR4 signalling is still not fully understood. Here, we set out to elucidate the molecular mechanisms underlying the effect of (+)‐naltrexone and (+)‐naloxone on TLR4 signalling. The results demonstrate that (+)‐naltrexone and (+)‐naloxone behave similarly. These agents specifically inhibit the TRIF‐IRF3 signalling pathway and block downstream production of NO, TNF‐α and reactive oxygen species (ROS). Therefore, it is hypothesized that it is via these mechanisms that (+)‐naloxone and (+)‐naltrexone directly act to improve neuropathic pain and reduce opioid reward and reinstatement.
Figure 1.
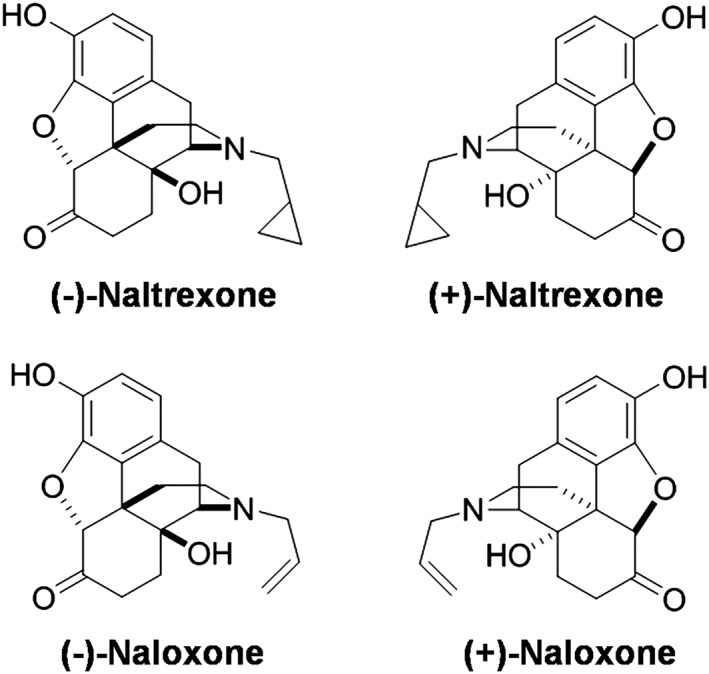
Structures of (±)‐naltrexone and (±)‐naloxone.
Methods
BV‐2 cell culture
BV‐2 murine microglial cells were grown in supplemented DMEM (including 10% FBS, 50 unit·mL−1 of penicillin and 50 μg·mL−1 of streptomycin). BV‐2 cells were detached from the flask by trypsin digestion when ~80% confluence was reached. Cells were seeded at a density of 4 × 10⁴ cells per well in 96‐well plates. After overnight incubation, media was aspirated and changed to DMEM media without FBS. Cells were then treated as indicated. It should be noted that the LPS concentrations used in this study had been optimized (Wang et al., 2013a). LPS induces ~90% of maximal response at the specified concentrations.
Isolation and primary cultures of rat microglia
All animal care and experimental procedures were approved by the Institutional Animal Care and Use Committee of the University of Colorado‐Boulder (project number 1403.03). Reporting of the animal studies follows the ARRIVE guidelines (McGrath & Lilley, 2015). Sprague‐Dawley rats were obtained from Harlan Laboratories (Madison, WI, USA).
Isolation and primary cultures of rat microglia were performed as described previously (Loram et al., 2012; Wang et al., 2013a). Briefly, brain cortices from P0/1 neonatal Sprague–Dawley rat pups were dissected and the overlying meninges removed. The cortical tissue was then minced with a scalpel blade and digested for 30 min in Liberase Blendzyme III (1.4 mWunsch units per brain, Roche Applied Science, Mannheim, Germany) and DNAse (0.1 U per brain, Sigma, St. Louis, MO, USA) at 37°C with agitation. The cells were triturated with a 21 gauge and a 23 gauge hypodermic needle. MEM media supplemented with 10% FBS, 50 unit·mL−1 of penicillin, 50 μg·mL−1 of streptomycin, 0.6% glucose and 2 mM l‐glutamine was added, and the cells were centrifuged. The supernatant was discarded, and the cells from each set of four brains were resuspended in 10 mL of supplemented MEM media. The cells were filtered through a 70 μm and then a 40 μm filter. The cells from four brains were plated in each 75 cm2 tissue culture flask. Cells were incubated at 37°C and 5% CO2 until confluence was reached (about 10 days). Media was changed every 3–4 days, with the first change being a complete media change and subsequent changes being 50% media changes. Once confluence was reached, microglial cells were isolated by shaking for 90 min on an orbital shaker at 160 rpm and plated into a 96‐well plate with a density of 40 000 cells per well; 48 h after plating, media was changed to MEM media without FBS. LPS (200 ng·mL−1) and (+)‐naltrexone/(+)‐naloxone were added. After 24 h treatment, media was collected for TNF‐α ELISA assay and NO assay. The cytotoxicity of (+)‐naltrexone/(+)‐naloxone on primary microglia was measured by Crystal violet staining.
Isolation and primary culture of rat peritoneal macrophages
Sprague–Dawley rats (male, 300‐350g) were anesthetized with isoflurane (2.5% in air) then decapitated. Peritoneal cells were removed by injecting cold Hank's balanced salt solution (30 mL) into the peritoneal cavity, the abdomen was briefly massaged and the fluid was removed (20–25 mL). The lavage fluid was centrifuged, and the cells were then washed with red blood cell lysis buffer (160 mM NH4Cl, 12 mM NaHCO3, 100 μM EDTA, pH to 7.3). After centrifugation, the cells were resuspended to 1 × 10⁶ cells mL−1 in culture media (Iscove's media containing 10% FBS 50 unit.mL−1 penicillin, 50 μg mL−1 streptomycin, and 2 mM L‐glutamine). Cells were seeded onto 96 well plates with density of 200,000 cells per well. After 2 h incubation at the incubator, non‐adherent cells were removed by washing with PBS and 200 μL supplemented Iscove's media was subsequently added to each well. After overnight incubation, media was changed to Iscove's media without FBS and LPS (20 ng mL−1) and (+)‐naltrexone/(+)‐naloxone were added. After 24 h treatment, media was collected for TNF‐α ELISA assay and NO assay. The cytotoxicity of (+)‐naltrexone and (+)‐naloxone on peritoneal macrophage was measured by the crystal violet staining method.
NO assay
Assays of NO were performed as described previously (Wang et al., 2012b; Wang et al., 2013a). Briefly, 100 μL of supernatant media was removed after cells were treated for 24 h and added to flat black 96‐well microfluor plates (Thermo Scientific, Waltham, MA, USA). Subsequently, 10 μL of 2,3‐diaminonaphthalene (0.05 mg·mL−1 in 0.62 M HCl) was added to each well and incubated for 15 min. The reaction was quenched by addition of 5 μL of 3 M NaOH, and the plate was read on a Beckman Coulter DTX880 reader (Fullerton, CA, USA) with excitation at 360 nm and emission at 430 nm.
The effect of the various drug combinations on LPS‐induced NO inhibition was analysed for synergy, according to the method described by Chou (2006. The shape of the concentration‐dependent curve (m, the coefficient signifying the shape of the concentration–effect relationship) and the median‐effect dose (D m, i.e. IC50) was determined according to the median‐effect equation: lg(f a/(1‐f a)) = m lg (D) − m lg(D m), where D is the dose (or concentration) of a drug, f a is the fraction affected by D (i.e. percentage inhibition/100) and f u is the fraction unaffected (f u = 1‐f a). The combination index (CI) of two drugs was calculated according to equation CI = (D)1/(Dm)1 (f a/(1‐f a))1/m1 + (D)2/(Dm)2 (f a/(1‐f a))1/m2, where CI < 1, =1, and >1 indicate synergism, additive effect and antagonism respectively.
NF‐κB luciferase reporter assay
A BV‐2 NF‐κB dual luciferase reporter cell line was constructed as described in earlier studies (Wang et al., 2012b; Wang et al., 2013a). The NF‐κB luciferase reporter BV‐2 cells were cultured in supplemented DMEM (10% FBS, 50 unit·mL−1 of penicillin, 50 μg·mL−1 of streptomycin, 2 μg·mL−1 of puromycin) and seeded at a density of 1 × 10⁴ cells per well in 96‐well plates. After 24 h incubation, media was replaced with supplemented Opti‐MEM (0.5% FBS, 50 unit·mL−1 of penicillin, 50 μg·mL−1 of streptomycin, 1× non‐essential amino acid). LPS (200 ng·mL−1) and (+)‐naltrexone/(+)‐naloxone were added to each well, and after 24 h, NF‐κB activity was detected by the Steady‐Glo Luciferase Assay System (Promega, Madison, MI, USA) according to the manufacturer's instructions.
ROS measurement
Dihydroethidium (DHE) is a cell‐permeable dye that, upon entering the cells, interacts with superoxide to form oxyethidium (Zhao et al., 2003), which in turn interacts with nucleic acids to emit a bright red colour quantitatively detectable by fluorescence microscopy. Microglial BV‐2 cells were pretreated with (+)‐naltrexone or (+)‐naloxone for 30 min and then stimulated with LPS (200 ng·mL−1) for 30 min. The cells were subsequently incubated with DHE (20 μM) for 15 min and washed thoroughly with Dulbecco PBS and immediately analysed for superoxide production under an EVOS FL Cell Imaging System (Life Technologies, Carlsbad, CA, USA).
Intracellular superoxide generation was also quantitatively measured by the formation of a dark blue formazan deposit resulting from superoxide‐mediated reduction of nitroblue tetrazolium (NBT) (Reed‐Geaghan et al., 2009). BV‐2 cells were treated with LPS (200 ng·mL−1) and (+)‐naltrexone/(+)‐naloxone for 24 h. Vehicle‐treated cells were used as controls. NBT (1 mg·mL−1) was added to the media at the end of the treatment periods. After incubation for 1 h at 37°C, the treated cells were washed twice with Dulbecco PBS and then dissolved in 200 μL of DMSO with gentle shaking for 10 min at room temperature. The absorbance of dark blue formazan was read on a Beckman Coulter DTX880 reader at 570 nm. The value of the LPS treated group was set as 100%.
Phagocytosis assay
The phagocytic activity of BV‐2 cells was measured by Vybrant phagocytosis assay kit according to the manufacturer's instructions. Briefly, BV‐2 cells were treated with LPS (200 ng·mL−1) and (+)‐naltrexone/(+)‐naloxone for 24 h. Vehicle‐treated cells were used as controls. Medium were removed, and 100 μL of fluorescein‐labelled Escherichia coli (K‐12 strain) suspension (1 mg·mL−1) was added into each well. The cells were then incubated for 2 h. After aspirating the fluorescein‐labelled E. coli, 100 μL of Trypan blue solution (0.25 mg·mL−1) was added and incubated for 1 min at room temperature to quench the fluorescence from E. coli particles that were not internalized. After removing the Trypan blue suspension, the fluorescence signal of the internalized fluorescein‐labelled E. coli was measured by a Beckman Coulter DTX880 reader with excitation at 480 nm and emission at 520 nm.
TNF‐α, IL‐1β and IFN‐β ELISA assays
TNF‐α, IL‐1β and IFN‐β were measured using commercially available ELISA kits according to the manufacturers' instructions.
Cell viability assay
Crystal violet staining was used to determine cell viability as described previously (Wang et al., 2013a). After treatment, cells were fixed with 3.7% paraformaldehyde for 5 min and then stained with 0.05% Crystal violet for 15 min. The plates were subsequently washed twice with tap water and dried for 30 min at room temperature; 200 μL of methanol was added to each well, and the plates were shaken for 15 min at room temperature to dissolve the dye. Absorbance at 540 nm was measured using a Beckman Coulter DTX880 reader.
Western blotting
The treated cells were washed with ice‐cold PBS and then were incubated for 10 min with lysis buffer containing 10 mM Tris–HCl (pH 7.4), 100 mM NaCl, 1 mM EDTA, 1 mM EGTA, 1 mM NaF, 20 mM Na4P2O7, 2 mM Na3VO4, 0.1% SDS, 0.5% (w/v) sodium deoxycholate, 1% Triton‐X 100, 1 mM PMSF, 60 μg·mL−1 aprotinin, 10 μg·mL−1 leupeptin and 1 μg·mL−1 pepstatin. The cells lysates were centrifuged at 12 000× g for 10 min. The samples were first separated by 10% SDS‐PAGE and then electroblotted to nitrocellulose membrane. After blocking with 5% BSA, the membranes were incubated with 0.5 μg·mL−1 of appropriate primary antibody in a cold room overnight. The membranes were washed five times in Tris‐Buffered Saline with 0.05% Tween 20 (TBST) for 5 min each and then incubated for 1 h at room temperature with secondary antibody – HRP conjugate (50 ng·mL−1). After extensive washing in TBST, the protein–antibody complexes were visualized by ImageQuant LAS 4000 (GE Healthcare, Waukesha, WI, USA) when reacting with Super‐Signal West Pico Chemiluminescent Substrate (Pierce, Rockford, IL, USA). Image J was used for densitometric analysis.
Data analysis
Data are presented as means ± SD, unless otherwise stated. Origin 7.5 (OriginLab Corporation, Northampton, MA, USA) was used for plotting the data and statistical analysis. Statistical significance was evaluated by unpaired Student's t‐test or one‐way ANOVA. Probability values were two‐tailed, and the statistical significance criterion P value was 0.05. Non‐linear logistic regression was used to plot and analyse concentration–response curves and to obtain IC50 values.
Materials
The murine microglial BV‐2 cell line was provided by Dr Rona Giffard (Stanford University). (+)‐Naltrexone and (+)‐naloxone were provided by Dr Kenner Rice of the National Institute on Drug Abuse (NIDA), National Institutes of Health (NIH). No impurities were detected by TLC, NMR analysis, elemental analyses and optical rotation. Compound T5342126 was synthesized as described in detail previously (Bevan et al., 2010). (−)‐Naltrexone, (−)‐naloxone, 2,3‐diaminonaphthalene, Crystal violet and GAPDH antibody were obtained from Sigma‐Aldrich. LPS was obtained from Invivogen (San Diego, CA, USA). Dual‐Glo luciferase assay system was purchased from Promega (Madison, MI, USA). DHE and the Vybrant phagocytosis assay kit were obtained from Life Technologies (Grand Island, NY, USA). Recombinant mouse TNF‐α and IFN‐γ were purchased from R&D Systems (Minneapolis, MA, USA). Mouse IL‐1β and TNF‐α ELISA kits, rat TNF‐α ELISA kit and 3,3′,5,5′‐tetramethylbenzidine (TMB) substrate reagent set were purchased from BD Bioscience (San Jose, CA, USA). Mouse IFN‐β ELISA kit was purchased from Biolegend (San Diego, CA, USA). Rabbit anti‐phosphor‐NF‐κB p65 antibody, anti‐phospho‐JNK antibody, anti‐phospho‐p38 MAPK antibody and anti‐phospho‐IRF3 were purchased from Cell Signaling Technology (Beverly, MA, USA).
Results
(+)‐Naltrexone and (+)‐naloxone inhibit LPS‐induced NO
Microglia are the resident cells of the innate immune system in the CNS (Neumann and Wekerle, 2013). TLR4 is primarily expressed in microglia rather than in astrocytes or neurons in the CNS (Zhang et al., 2014). Given this expression profile, the BV‐2 mouse microglial cell line was used to model the microglia, as these cells reproduce many of the responses of primary microglia, with high fidelity (Henn et al., 2009). TLR4 activation induces the downstream production of the inflammatory factor NO, which contributes to the development of neuropathic pain (Schmidtko et al., 2009) and drug addiction (Tayfun Uzbay and Oglesby, 2001; Toda et al., 2009).
Naltrexone (Figure 2A) and naloxone (Figure 2B) were non‐stereoselective inhibitors of the LPS‐induced NO production in BV‐2 cells. (+)‐Naloxone did not differ from (−)‐naloxone as an inhibitor of LPS‐induced NO production (one‐way ANOVA; Figure 2A) and no differences were observed between (+)‐naltrexone and (−)‐naltrexone (one‐way ANOVA; Figure 2B). Thus the (+)‐isomers had the same potency as the (−)‐isomers, indicating that the actions of naltrexone and naloxone, in this system, were independent of opioid receptors, which are strictly stereoselective for the (−)‐isomers. These results are consistent with our previous in vivo study that demonstrated that naltrexone and naloxone non‐stereoselectively reversed mechanical allodynia (Hutchinson et al., 2008). The concentration–effect curves were further analysed by the median‐effect equation of the mass action law (Figure 2C) (Chou, 2006). (+)‐Naloxone was as potent an inhibitor of LPS‐induced NO production as (+)‐naltrexone with IC50 = 105.5 μM (95% confidence interval: 95.4–115.6 μM) for (+)‐naltrexone and IC50 = 94.4 μM (95% confidence interval: 83.2–105.6 μM) for (+)‐naloxone. Further, no cellular toxicity was observed for naltrexone and naloxone, over a wide concentration range (Figure 2D).
Figure 2.
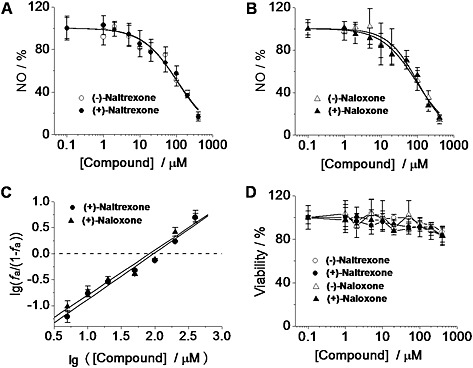
(±)‐Naltrexone and (±)‐naloxone inhibit LPS‐induced NO production in microglial BV‐2 cells. (A, B) BV‐2 cells were treated with LPS (200 ng·mL−1) and indicated concentrations of (±)‐naltrexone (A) or (±)‐naloxone (B) for 24 h. NO in the supernatant was detected by the 2,3‐diaminonaphthalene assay. The NO in the LPS (200 ng·mL−1) group was set as 100%. (C) Median‐effect plots of the inhibition by (+)‐naltrexone and (+)‐naloxone of LPS‐induced NO production . f a, fraction affected, that is, fraction of LPS‐induced NO being inhibited by (+)‐naltrexone/(+)‐naloxone. lg (x) means log10 (x). (D) BV‐2 cells were treated with various concentrations of (±)‐naltrexone or (±)‐naloxone for 24 h, and cell viability was monitored by Crystal violet staining. Data are presented as means ± SD (n = 6 in each group).
As shown in Figure 3A, the effect of the combination of 20 μM (+)‐naloxone and 20 μM (+)‐naltrexone was not different from that of 40 μM (+)‐naloxone (Student's t‐test) or 40 μM (+)‐naltrexone (Student's t‐test). The combined effect of (+)‐naltrexone and (+)‐naloxone was also analysed by the Chou–Talalay method (Chou, 2006) and the interaction of (+)‐naltrexone and (+)‐naloxone in inhibiting LPS‐induced NO production was found to be additive (Figure 3B), which is consistent with the previous finding that both (+)‐naloxone and (+)‐naltrexone fit into the hydrophobic pocket of MD2 with the same affinity (Hutchinson et al., 2012; Northcutt et al., 2015).
Figure 3.
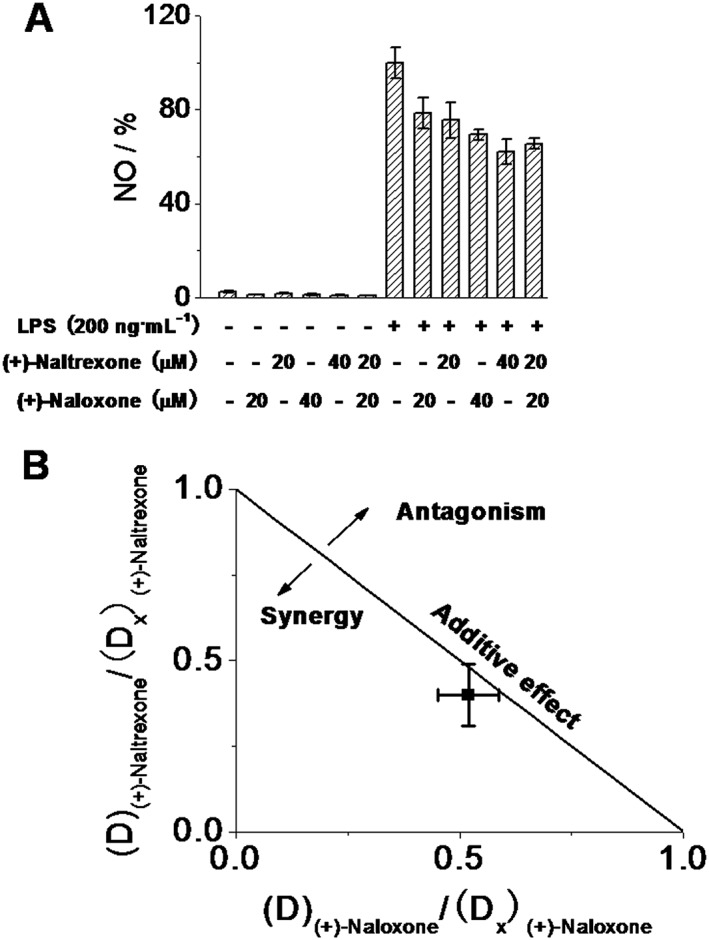
Interaction between naltrexone and naloxone in inhibiting LPS‐induced NO in microglial BV‐2 cells. (A) BV‐2 cells were treated with the indicated concentrations of (+)‐naltrexone/(+)‐naloxone and LPS (200 ng·mL−1) for 24 h. NO in the media was measured. The NO in the LPS (200 ng·mL−1) group was set as 100%. (B) Normalized isobologram for combination of 20 μM (+)‐naltrexone and 20 μM (+)‐naloxone. Interaction of TLR4 antagonist (+)‐naltrexone and (+)‐naloxone was analysed according to the method described by Chou (2006). D is the concentration of a drug; (D x)(+)‐naltrexone is the concentration of (+)‐naltrexone alone that inhibits LPS‐induced NO by x%; (D x)(+)‐naloxone is the concentration of (+)‐naloxone alone that inhibits LPS‐induced NO by x%; x% here refers to percentage of NO inhibition caused by 20 μM (+)‐naltrexone and 20 μM (+)‐naloxone shown in (A); (D x)(+)‐naltrexone and (D x)(+)‐naloxone can be calculated from equation D = D m (x/(100 − x))1/m, where D m is the median‐effect dose (IC50) that inhibits the LPS‐induced (200 ng·mL−1) NO by 50% and m is the coefficient signifying the shape of the concentration–effect relationship. The combination index (CI) for (+)‐naltrexone and (+)‐naloxone was 0.95 ± 0.04, according to the equation CI =(D)(+)‐naltrexone/(D x)(+)‐naltrexone + (D)(+)‐naloxone/(D x)(+)‐naloxone. Data are presented as means ± SD (n = 6 in each group).
Recently, we described a new TLR4 inhibitor T5342126 (Figure 4A), identified by in silico high‐throughput screening, which targets the heterodimerization interface between TLR4 and MD2 (Bevan et al., 2010; Joce et al., 2010). Interestingly, (+)‐naltrexone (Figure 4B) and (+)‐naloxone (Figure 4C) were found to synergize with T5342126 in inhibiting LPS‐induced NO production.
Figure 4.
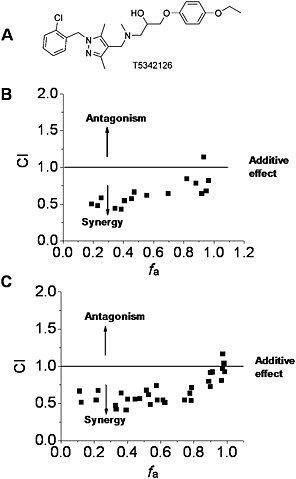
Interactions of (+)‐naltrexone and (+)‐naloxone with the TLR4 antagonist T5342126 in inhibiting LPS‐induced NO in microglial BV‐2 cells. (A) Chemical structure of T5342126; (B, C) BV‐2 cells were treated with LPS (200 ng·mL−1) and different combinations of (+)‐naltrexone/(+)‐naloxone and T5342126 for 24 h. NO in the supernatant was measured by 2,3‐diaminonaphthalene assay and the drug interactions were analysed according to the method described by Chou (2006). CI, combination index, where CI < 1, =1 and >1, indicates synergism, additive effect and antagonism in drug–drug interaction. f a, fraction affected, that is, fraction of LPS‐induced NO being inhibited by (+)‐naltrexone/(+)‐naloxone and T5342126. Six independent experiments were performed, and the transformed raw data points were shown.
The effects of (+)‐naltrexone and (+)‐naloxone on primary microglia were also investigated. (+)‐Naltrexone and (+)‐naloxone were concentration‐dependent, equi‐potent inhibitors of LPS‐induced NO production in primary cultures of rat neonatal microglia ( one‐way ANOVA) (Figure 5A), and (+)‐naltrexone and (+)‐naloxone did not show any cellular toxicity (Figure 5B).
Figure 5.
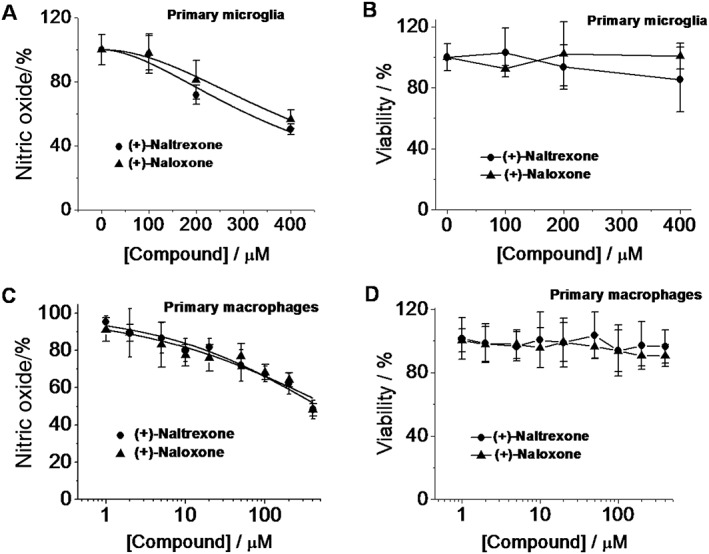
(+)‐Naltrexone and (+)‐naloxone inhibit LPS‐induced NO in primary microglia and macrophages. (A, B) Rat primary neonatal microglia were treated with LPS (200 ng·mL−1) and different concentrations of (+)‐naltrexone/(+)‐naloxone. After 24 h treatment, NO in the supernatant was measured (A), and cell viability was monitored by Crystal violet staining. (B). (C, D) Rat primary peritoneal macrophages were treated with LPS (20 ng·mL−1) and different concentrations of (+)‐naltrexone/(+)‐naloxone. After 24 h treatment, NO in the supernatant (C) and cell viability (D) were measured. The NO in the LPS‐stimulated group was set as 100%. For cellular viability assay, the vehicle‐treated cells were normalized as 100%. Data are presented as means ± SD (n = 6 in each group).
Under pathological circumstances, the blood–brain barrier becomes compromised. Peripheral immune cells can infiltrate into the CNS, contributing to neuroinflammation. Also, the peripheral immune system communicates with the CNS (Dilger and Johnson, 2008) and peripheral cytokines can enter into the CNS by active transport, at circumventricular structures and under conditions of blood–brain barrier disruption, thereby allowing such peripheral signals to directly modulate neuroinflammation in the CNS. Therefore, the effect of (+)‐naltrexone and (+)‐naloxone on peripheral macrophages was investigated. (+)‐Naltrexone and (+)‐naloxone were concentration‐dependent, equi‐potent inhibitors of LPS‐induced NO production in primary macrophages (one‐way ANOVA) (Figure 5C), and exerted no cellular toxicity (Figure 5D).
(+)‐Naltrexone and (+)‐naloxone inhibit LPS‐induced TNF‐α
The pro‐inflammatory cytokine TNF‐α is an important downstream product of innate immune responses, mediated by TLR4 (Takeuchi and Akira, 2010) and is one of the many factors implicated in neuropathic pain (Leung and Cahill, 2010) and drug dependence (Coller and Hutchinson, 2012). (+)‐Naltrexone and (+)‐naloxone inhibited LPS‐induced TNF‐α increased production in a concentration‐dependent manner in BV‐2 cells (Figure 6A), rat primary microglia (Figure 6B) and macrophages (Figure 6C). (+)‐Naltrexone was as potent as (+)‐naloxone (one‐way ANOVA). Among the cells tested, primary macrophages were the most responsive to (+)‐naltrexone and (+)‐naloxone with regard to inhibition of TNF‐α induction.
Figure 6.
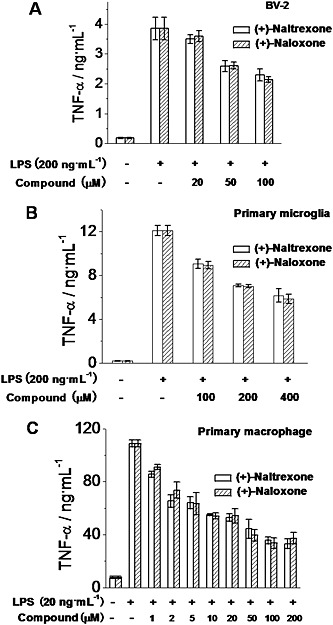
(+)‐Naltrexone and (+)‐naloxone inhibit LPS‐induced TNF‐α production. BV‐2 cells (A), rat primary neonatal microglia (B) and rat primary peritoneal macrophages (C) were treated with indicated concentrations of LPS and different concentrations of (+)‐naltrexone/(+)‐naloxone. After 24 h treatment, TNF‐α in the supernatant was measured by ELISA. Data are presented as means ± SD (n = 6 in each group).
(+)‐Naltrexone and (+)‐naloxone inhibit microglial activation‐induced ROS and phagocytosis
Microglial activation produces ROS (Block et al., 2007), which plays a crucial role in the development of neuropathic pain (Yowtak et al., 2011; Gwak et al., 2013) and drug addiction (Kovacic and Cooksy, 2005). Thirty minutes of LPS stimulation led to a robust burst of ROS production in BV‐2 cells as measured by dihydroethidium staining (Figure S1). (+)‐Naltrexone and (+)‐naloxone abolished the LPS‐induced ROS burst (Figure S1). BV‐2 cells were also treated for 24 h, and LPS‐induced ROS was quantitatively detected by the formation of a dark blue formazan deposit resulting from superoxide‐mediated reduction of NBT. (+)‐Naltrexone and (+)‐naloxone inhibited LPS‐induced ROS production in a concentration‐dependent manner (Figure 7A), with the same potencies (one‐way ANOVA) (Figure 7B).
Figure 7.
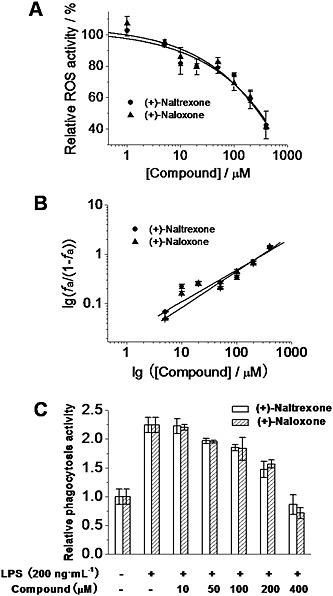
(+)‐Naltrexone and (+)‐naloxone inhibit LPS‐induced ROS production and increased phagocytosis activity in microglial BV‐2 cells. (A) BV‐2 cells were treated with LPS (200 ng·mL−1) and different concentrations of (+)‐naltrexone/(+)‐naloxone. After 24 h treatment, intracellular ROS were detected by NBT staining. (B) Median‐effect plots of (+)‐naltrexone and (+)‐naloxone inhibiting LPS‐induced ROS production. f a, fraction affected, that is, fraction of LPS‐induced ROS being inhibited by (+)‐naltrexone or (+)‐naloxone. (C) BV‐2 cells were treated as in (A). The phagocytosis activity of BV‐2 cells was measured by Vybrant phagocytosis assay kit. The phagocytosis activity of the vehicle‐treated control BV‐2 was set as 1. Data are presented as means ± SD (n = 6 in each group).
Another marker of microglial cell activation is an increase in phagocytosis (Reed‐Geaghan et al., 2009). As shown in Figure 7C, LPS stimulation increased the phagocytic activity of BV‐2 cells. (+)‐Naltrexone and (+)‐naloxone were concentration‐dependent, equi‐potent inhibitors of the LPS‐induced increase of phagocytic activity ( one‐way ANOVA) (Figure 7C).
(+)‐Naltrexone and (+)‐naloxone do not inhibit LPS‐induced IL‐1β in vitro
IL‐1β is an important TLR4 signalling cytokine (Takeuchi and Akira, 2010) and is also critically involved in the progression of neuropathic pain (Pillarisetti, 2011) and drug dependence (Coller and Hutchinson, 2012). We tested whether (+)‐naltrexone and (+)‐naloxone would directly inhibit LPS‐induced IL‐1β production. BV‐2 cells were treated for 24 h with LPS (200 ng·mL−1) and varying concentrations of (+)‐naltrexone or (+)‐naloxone. After this time, cell contents were collected for analysis after lysis. Cell contents, rather than release into culture supernatant, were tested based on our prior experience with this cell line that the intracellular levels rather than release, of this cytokine were elevated by LPS. Interestingly, neither (+)‐naltrexone nor (+)‐naloxone suppressed LPS induction of IL‐1β protein (Figure S2).
(+)‐Naltrexone and (+)‐naloxone do not inhibit LPS‐induced NF‐κB and MAPK activation in vitro
NF‐κB is a major transcription factor in the TLR4 signalling cascade, being involved in both MyD88‐dependent and MyD88‐independent TLR4 pathways (Takeuchi and Akira, 2010). In order to investigate the effect of (+)‐naltrexone and (+)‐naloxone on NF‐κB activity, a BV‐2 NF‐κB dual luciferase reporter cell line was constructed (Wang et al., 2012b; Wang et al., 2013a). The firefly luciferase gene was placed under the control of the NF‐κB transcriptional response element, and the constitutively expressing Renilla luciferase was placed under the control of the cytomegalovirus promoter. (+)‐Naltrexone and (+)‐naloxone did not inhibit LPS‐induced NF‐κB activation (Figure S3). In addition, (+)‐naltrexone and (+)‐naloxone did not interact with the TLR4 antagonist T5342126 in inhibiting LPS‐induced NF‐κB activation (Figure S4). Further, (+)‐naltrexone and (+)‐naloxone did not inhibit TNF‐α‐induced NF‐κB activation (Figure S5). Together, these results indicate that (+)‐naltrexone and (+)‐naloxone did not affect NF‐κB signalling in BV‐2 cells.
As converging lines of evidence, the phosphorylation of p65 subunit of NF‐κB was also used to detect NF‐κB activation. (+)‐Naltrexone and (+)‐naloxone did not inhibit LPS‐induced NF‐κB p65 subunit phosphorylation in BV‐2 cells (Figure 8 and Figure S6A), in primary rat microglia (Figure S7) or rat macrophages (Figure S8).
Figure 8.
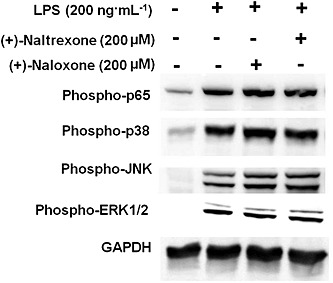
(+)‐Naltrexone and (+)‐naloxone do not inhibit LPS‐induced NF‐κB and MAPK activation. BV‐2 cells were stimulated with LPS (200 ng·mL−1) and 200 μM (+)‐naltrexone/(+)‐naloxone for 90 min. It should be noted that the stimulation time of 90 min was chosen based on our previous study (Wang et al., 2012b) and other published studies (Lei et al., 2014). The phosphorylation of p65 subunit of NF‐κB, p38, ERK1/2 and JNK was detected by Western blotting. Five independent experiments were performed (n = 5).
The MAPK cascade is also important in TLR4 downstream signalling (Takeuchi and Akira, 2010), whose activation leads to the activation of AP‐1 and the induction of the expression of cytokine genes. (+)‐Naltrexone and (+)‐naloxone failed to inhibit LPS‐induced activation of p38, ERK1/2 or JNK in BV‐2 microglia (Figure 8 and Figure S6B and C).
(+)‐Naltrexone and (+)‐naloxone inhibit LPS‐induced IRF3 activation and IFN‐β increased production
In addition to NF‐κB and AP‐1, IRF3 is another transcription factor in the TLR4 signalling cascade. TRIF activates IRF3 and induces IFN‐β transcription (Takeuchi and Akira, 2010). As shown in Figure 9A, (+)‐naltrexone and (+)‐naloxone did inhibit LPS‐induced IRF3 phosphorylation and IFN‐β production in a concentration‐dependent manner (Figure 9B). Similar potencies were observed for (+)‐naltrexone and (+)‐naloxone (one‐way ANOVA). These results show (+)‐naltrexone and (+)‐naloxone inhibited the TLR4‐TRIF‐IRF3 signalling pathway.
Figure 9.
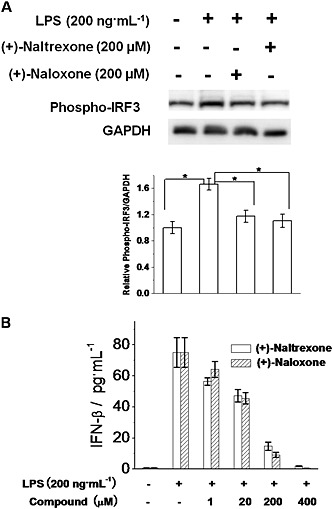
(+)‐Naltrexone and (+)‐naloxone inhibit LPS‐induced IRF3 activation and IFN‐β production. (A) BV‐2 cells were stimulated with LPS (200 ng·mL−1) and 200 μM of (+)‐naltrexone/(+)‐naloxone for 6 h. Phosphorylation of IRF3 was detected by Western blotting. Five independent experiments were performed (n = 5). *P < 0.05. (B) BV‐2 cells were stimulated with LPS (200 ng·mL−1) and different concentrations of (+)‐naltrexone or (+)‐naloxone. After 24 h treatment, IFN‐β in the supernatant was measured by ELISA. Data are presented as means ± SD (n = 6 in each group).
Discussion and conclusions
Previous in vivo animal model studies showed that (+)‐naltrexone and (+)‐naloxone reduced the expression of the reactive microglial marker CD11b, resolved neuropathic pain and reduced drug reward and reinforcement (Wu et al., 2006; Hutchinson et al., 2008; Hutchinson et al., 2010; Hutchinson et al., 2012; Lewis et al., 2012; Theberge et al., 2013; Northcutt et al., 2015). In vitro biophysical studies showed that (+)‐naltrexone and (+)‐naloxone bound to the LPS binding pocket of MD2, with similar affinities (Hutchinson et al., 2012; Northcutt et al., 2015). In order to investigate the general molecular and cellular mechanism(s) by which (+)‐naloxone and (+)‐naltrexone inhibited TLR4 signalling in vitro, several cell systems including BV‐2, primary microglia and primary macrophages were used. Here, we showed that (+)‐naltrexone and (+)‐naloxone directly inhibited LPS‐induced NO, TNF‐α and superoxide production. (+)‐Naltrexone and (+)‐naloxone synergized with the TLR4 inhibitor T5342126 in inhibiting LPS‐induced NO. These results suggest that the opioid antagonist binding domain in MD2 is distinct from the TLR4/MD2 interface to which T5342126 binds. Interestingly, (+)‐naltrexone and (+)‐naloxone do not appear to directly inhibit LPS‐induced production of IL‐1β, in these in vitro systems. They inhibit the TLR4‐TRIF‐IRF3 signalling pathway, but not LPS‐induced NF‐κB and MAPK activation in the cells tested.
TNF‐α is transcriptionally regulated by NF‐κB and IRF3 (Zhao et al., 2008; Falvo et al., 2010); IL‐1β is regulated by NF‐κB, as well as AP‐1, which is activated by the MAPK cascade (Cogswell et al., 1994; Roman et al., 2000). (+)‐Naltrexone and (+)‐naloxone inhibit the activity of the LPS‐induced transcription factor IRF3, but not the LPS‐induced NF‐κB and MAPK activities. Therefore, TNF‐α inhibition, but not IL‐1β inhibition, was observed in response to (+)‐naltrexone and (+)‐naloxone (Figure 10). The TRIF‐IRF3 axis of TLR4 signalling triggers the secretion of IFN‐β, which binds to the type I IFN receptor and activates a JAK‐STAT pathway (Takeuchi and Akira, 2010). The activation of NF‐κB and JAK‐STAT induces the expression of inducible NOS and NO production (Figure 10). (+)‐Naltrexone and (+)‐naloxone inhibited the TLR4‐TRIF‐IRF3 signalling pathway and LPS‐induced IFN‐β production. Therefore, (+)‐naltrexone and (+)‐naloxone were found to inhibit LPS‐induced NO (Figure 10). Further, it should be noted that (+)‐naltrexone and (+)‐naloxone did not inhibit type I IFN receptor‐induced NO and they have no direct interaction with JAK‐STAT signalling (Figure S9).
Figure 10.
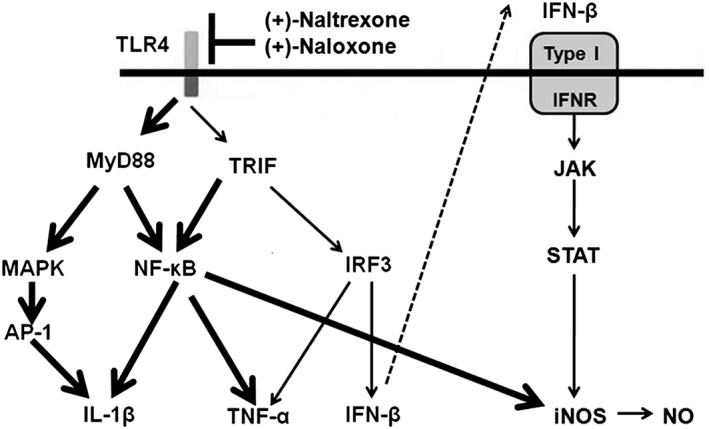
Scheme of the role of (+)‐naltrexone and (+)‐naloxone in TLR4 signalling. TLR4 signals via two main pathways involving the adaptor proteins, MyD88 or TRIF. MyD88‐dependent signalling induces activation of the transcription factors NF‐κB and AP‐1. TRIF‐dependent signalling causes the activation of NF‐κB and IRF3. NF‐κB and AP‐1 activation results in the induction of pro‐inflammatory cytokines. IRF3 activation induces type I IFN production. IFN‐β activates the type I IFN receptor and its corresponding JAK‐STAT pathway in an autocrine and paracrine fashion, leading to the production of inducible NOS. It should be pointed out that these TLR4 signalling pathways have been well characterized (Takeuchi and Akira, 2010). (+)‐Naltrexone and (+)‐naloxone bind to the MD2 and biasedly inhibit the TLR4‐TRIF‐IRF3 signalling pathway (thin line). The unaffected signalling pathway is represented by a thick line.
TLR4 under basal homeostatic conditions is mainly distributed on microglia and endothelial cells in the CNS, whereas TLR4 expression on CNS neurons is minimal (Zhang et al., 2014). Several studies show TLR4 is also expressed and functional in peripheral sensory neurons (Diogenes et al., 2011), which are also involved in neuropathic pain. However, little is known about TLR4 downstream signalling pathways in both CNS and peripheral neurons (Okun et al., 2011). Recently, Tse et al. (2014 found that TLR4 did not signal via TRIF in peripheral sensory neurons. Interestingly, (+)‐naltrexone and (+)‐naloxone are found to be TRIF‐IRF3 axis‐biased TLR4 signalling inhibitors, which indicate that (+)‐naltrexone and (+)‐naloxone may only work on non‐neuronal cells under these conditions.
Our previous studies tested the selectivity of (+)‐naltrexone and (+)‐naloxone for TLR4 versus potential off‐target effects (Hutchinson et al., 2012; Northcutt et al., 2015). NovaScreen assays of ~70 neurotransmitter and peptide receptors, growth factor/hormone receptors, ion channels, second messengers and enzymes revealed no effects nor were there binding or functional effects on transporters for 5‐HT, noradrenaline or dopamine. To further test the specificity of (+)‐naltrexone and (+)‐naloxone for TLR4, we also tested their effect on TNF‐α receptor signalling, which shares many signalling molecules in common with TLR4 signalling. (+)‐Naltrexone and (+)‐naloxone did not inhibit the NO production induced by TNF‐α (Figure S10). While there is evidence for (+)‐naloxone and/or (+)‐naltrexone as inhibitors of gp91phox (Wang et al., 2012a) and filamin A (Wang and Burns, 2009), the fact that diverse TLR4 antagonists and TLR4 knockout/mutant strains replicate the effects of (+)‐naltrexone and (+)‐naloxone suggests that TLR4 is likely the predominant target rather than gp91phox, filamin A or other off‐target effects. Additionally, the data presented here reinforce the warning that using the spontaneous TLR4 mutant CH3/HeJ mouse strain as the only test of TLR4 involvement in biological systems is not adequate, given that this strain only lacks NF‐kB signalling (Goodridge et al., 2007).
The present series of studies were undertaken using microglia and macrophages, rather than a non‐immunocompetent cell line transfected to overexpress TLR4. This choice was propitious given the discovery of biased signalling, which would not have been revealed had commercially available TLR4 overexpressing cell lines been employed. For example, HEK‐Blue™‐hTLR4 cells, which are commercially available from Invivogen, have been used as model system to study pharmacological mechanisms (Hutchinson et al., 2008; Stevens et al., 2013). HEK‐Blue™‐hTLR4 cells overexpress TLR4 and the TLR4 signalling accessory protein CD14 as well as MD2. These cells stably express an optimized alkaline phosphatase reporter gene under the control of a promoter inducible by several transcription factors such as NF‐κB and AP‐1. Secreted alkaline phosphatase protein is produced as a consequence of TLR4 activation. HEK‐Blue™‐hTLR4 cells are suitable for high‐throughput screening of TLR4 modulators, but not for mechanistic immunological studies. This is because HEK cells lack many characteristics of natural immunocompetent macrophages and microglia. HEK‐Blue™‐hTLR4 cells are not engineered to produce various helper proteins that aid the interaction of TLR4 ligands with CD14/MD2. Nor are they engineered to include the various downstream signalling pathways from TLR4 other than NF‐κB/AP‐1 that direct the expression of the engineered reporter protein. As just one example of ways that these cells fail to act like innate immune cells, we observed that HEK‐Blue™‐hTLR4 cells did not consistently increase production of NO (Figure S11), an important pro‐inflammatory factor in TLR4 signalling, in the presence of LPS. Hence, pharmacological studies need to be mindful of the pitfalls inherent in the use of engineered receptor overexpression cell lines as in their engineering, they may be fundamentally biased in their signalling. This is especially the case when the signalling consequences of the ligands are unknown and thus may require proteins not present in incomplete signalling systems. Additionally, overexpression of the receptor may result in non‐physiological cell surface representation of the receptor and thus facilitate biophysical interactions that are not naturally observed. Again, this is a pertinent issue to address when examining possible biased agents. Thus, it would be prudent to investigate the mechanistic underpinnings of (+)‐naltrexone and (+)‐naloxone in TLR4 signalling in immunocompetent cells with biologically relevant receptor expression. That is why the microglial BV‐2 cell line and primary microglia and macrophages were used as the model systems for immunological and pharmacological characterization.
A last point is that the systematic characterization presented here reveals direct effects of (+)‐naloxone and (+)‐naltrexone on the in vitro systems under study in response to LPS challenge. In the more complex in vivo situations, it remains possible for (+)‐naloxone and (+)‐naltrexone to also lead indirectly to broader effects on inflammatory states. As one example, we have reported that cocaine, like LPS, activates TLR4 in silico, in vitro and in vivo (Northcutt et al., 2015). Notably, cocaine in vivo induces the up‐regulation of IL‐1β gene expression in brain drug reward sites, an effect abolished by (+)‐naloxone (Northcutt et al., 2015). Given the extensive results in the present study that clearly demonstrate a lack of direct effect of (+)‐naloxone or (+)‐naltrexone on IL‐1β expression, it may well be that their blockade of other TLR4 downstream mediators such as NO could, in turn, indirectly suppress IL‐1β induction by non‐TLR4‐mediated pathways in multicellular systems. Notably, NO is known to induce IL‐1β as well as other pro‐inflammatory cytokines in vivo, implying that (+)‐naloxone and (+)‐naltrexone may exert modulatory effects on IL‐1β production in vivo by such an indirect mechanism (Holguin et al., 2004). Similarly, in vivo administration of (+)‐naloxone and (+)‐naltrexone inhibited NF‐κB and MAPK activities in spinal cord (unpublished observations). It is not clear why (+)‐naloxone or (+)‐naltrexone behaves differently in the in vitro single cell and the in vivo multicellular systems. Currently, we are pursuing this interesting question.
In conclusion, (+)‐naltrexone and (+)‐naloxone inhibited TLR4‐TRIF‐IRF3 signalling and blocked LPS‐induced TNF‐α, NO and ROS increased production in in vitro cell culture systems. They did not inhibit NF‐κB and MAPK cascade activation mediated by TLR4 signalling. Similar to previously identified TRIF‐biased TLR4 agonists (Mata‐Haro et al., 2007; Bowen et al., 2012; Bozza et al., 2014), (+)‐naltrexone and (+)‐naloxone bind to MD2 and biasedly modulate the TRIF‐IRF3 signalling pathway of TLR4 (Figure 10). MD2 biophysical binding studies show that (+)‐naltrexone and (+)‐naloxone have comparable affinity to drugs of abuse and endogenous danger signals. Further, (+)‐naltrexone and (+)‐naloxone are brain–blood barrier permeable. Therefore, systemic administration of (+)‐naltrexone and (+)‐naloxone can modify the activity of immunocompetent cells in both the central immune system and the peripheral immune system, which respond to endogenous damage‐associated molecular patterns and foreign bodies with a pro‐inflammatory signalling cascade. Such a pharmacological profile would bode well for translation of (+)‐naltrexone and (+)‐naloxone for treatment of neuropathic pain and drug abuse. Moreover, the interaction of (+)‐naloxone and (+)‐naltrexone with the TLR4 antagonist T5342126 in inhibiting LPS‐induced NO is synergistic. It should be noted that opiate inhibitors and T5342126 are weak TLR4 inhibitors (Bevan et al., 2010; Joce et al., 2010). Combining them provides the potential for greater efficacy in vitro as well as in vivo than attainable with either alone. Further, the window of T5342126 inhibiting TLR4 activity without apparent cellular toxicity is narrow (Figure S12). Therefore, combining (+)‐naloxone or (+)‐naltrexone with T5342126 may potentially be able to boost their TLR4 inhibitory activities and reduce the dose‐related side effects of the individual drugs, owing to the synergistic interaction of (+)‐naloxone/(+)‐naltrexone with T5342126, which may have great translational potential in vivo.
Author contributions
X. W., M. R. H., H. Y. and L. R. W. designed the study and wrote the paper; K. C. R. provided the (+)‐naltrexone and (+)‐naloxone and contributed to the editing of the paper; X. W., Y. Z. and Y. P. performed the research; X. W. analysed the data.
Conflict of interest
L. R. W. is a co‐founder and co‐chair of the Scientific Advisory Board of Xalud Therapeutics.
Supporting information
Figure S1 (+)‐Naltrexone and (+)‐naloxone inhibit the increased production of reactive oxygen species (ROS) in microglial BV‐2 cells. BV‐2 cells were pretreated with 200μM (+)‐naltrexone/(+)‐naloxone for 30 min and then stimulated with LPS (200 ng.mL‐1) for 30 min. The intracellular ROS burst was measured by dihydroethidium staining and the cells were imaged by an EVOS FL Cell Imaging System. Dihydroethidium interacts with superoxide to form oxyethidium, which in turn interacts with nucleic acids to emit a bright red color detectable qualitatively by fluorescence microscopy. Six independent experiments were performed and representative data are shown.
Figure S2 (+)‐Naltrexone and (+)‐naloxone do not inhibit LPS induced IL‐1β over‐production. BV‐2 cells were treated with LPS (200 ng.mL‐1) and (+)‐naltrexone/(+)‐naloxone. After 24 h treatment, cell lysis supernatant was collected for IL‐1β ELISA. The IL‐1β level was normalized by total protein concentration determined by BCA assay. Data are presented as means ± SD (n = 6 in each group).
Figure S3 (+)‐Naltrexone and (+)‐naloxone do not inhibit LPS induced NF‐κB activation in BV‐2 cells. (A, B), BV‐2 NF‐κB luciferase reporter cells were treated with LPS (200 ng.mL‐1) and (+)‐naltrexone/(+)‐naloxone. After 6 h (A) or 12 h (B) of incubation, the NF‐κB activity was determined by the Steady‐Glo luciferase assay. (C, D), BV‐2 NF‐κB luciferase reporter cells were treated with LPS (200 ng.mL‐1) and (+)‐naltrexone (C)/(+)‐naloxone (D). After 24 h of incubation, the NF‐κB activity was determined by the Steady‐Glo luciferase assay. (E, F), BV‐2 NF‐κB luciferase reporter cells were treated with 10 (E) or 100 μM (F) (+)‐naltrexone/(+)‐naloxone and various concentrations of LPS. After 24 h of treatment, the NF‐κB activity was determined by the Steady‐Glo luciferase assay. LPS versus LPS +10 μM (+)‐naltrexone, P=0.69 by one‐way ANOVA; LPS versus LPS +10 μM (+)‐naloxone, P=0.92 by one‐way ANOVA; LPS versus LPS +100 μM (+)‐naltrexone, P=0.82 by one‐way ANOVA; LPS versus LPS +100 μM (+)‐naloxone, P=0.87 by one‐way ANOVA. It should be noted that the NF‐κB activity of the vehicle treated control BV‐2 was set as 1. Data are presented as means ± SD (n = 6 in each group).
Figure S4 (+)‐Naltrexone and (+)‐naloxone do not interact with T5342126 in inhibiting LPS‐induced NF‐κB activation in BV‐2 cells. NF‐κB luciferase reporter cells were treated with LPS (200 ng.mL‐1), 50 μM (+)‐naltrexone/(+)‐naloxone, and various concentrations of T5342126. After 24 h of treatment, the NF‐κB activity was determined by the Steady‐Glo luciferase assay. The NF‐κB activity of the vehicle treated control BV‐2 was set as 1. T5342126 versus T5342126+50 μM (+)‐naltrexone, P=0.71 by one‐way ANOVA; T5342126+50 μM (+)‐naloxone, P=0.92 by one‐way ANOVA. Data are presented as means ± SD (n = 6 in each group).
Figure S5 (+)‐Naltrexone and (+)‐naloxone do not inhibit TNF‐α induced NF‐κB activation in BV‐2 cells. NF‐κB luciferase reporter cells were treated with TNF‐α (400 ng.mL‐1) and different concentrations of (+)‐naltrexone/(+)‐naloxone. After 24 h treatment, NF‐κB activity was determined by the Steady‐Glo luciferase assay. The NF‐κB activity of the vehicle treated control BV‐2 was set as 1. Data are presented as means ± SD (n = 6 in each group).
Figure S6 Quantification of the Western blotting of the phosphorylation of p65 subunit of NF‐κB (A), p38 (B) and JNK (C) shown in Figure 8 in the main text.
Figure S7 (+)‐Naltrexone and (+)‐naloxone do not inhibit LPS induced NF‐κB activation in primary microglia. Rat neonatal microglia were stimulated with LPS (200 ng.mL‐1) and 200μM of (+)‐naltrexone/(+)‐naloxone for 1.5 h. The phosphorylation of p65 subunit of NF‐κB was detected by Western blotting. Five independent experiments were performed (n = 5).
Figure S8 (+)‐Naltrexone and (+)‐naloxone do not inhibit LPS induced NF‐κB activation in primary macrophage. Rat peritoneal macrophages were stimulated with LPS (20 ng.mL‐1) and 200 μM of (+)‐naltrexone/(+)‐naloxone for 1.5 h. The phosphorylation of p65 subunit of NF‐κB was detected by Western blotting. Five independent experiments were performed (n = 5).
Figure S9 (+)‐Naltrexone and (+)‐naloxone do not inhibit type I interferon receptor (Type I IFNR)‐JAK‐STAT signalling. BV‐2 cells were treated with IFN‐γ (50 ng.mL‐1) and different concentrations of (+)‐naltrexone/(+)‐naloxone. After 24 h treatment, NO in the supernatant was measured. The NO level in the IFN‐γ treated group was set as 100%. Data are presented as means ± SD (n = 6 in each group).
Figure S10 (+)‐Naltrexone and (+)‐naloxone do not inhibit TNF‐α induced NO increased production in BV‐2 cells. BV‐2 cells were treated with TNF‐α (400 ng.mL‐1) and different concentrations of (+)‐naltrexone/(+)‐naloxone for 3 days. NO in the supernatant was subsequently measured. The NO level in the TNF‐α treated group was set as 100%. Data are presented as means ± SD (n = 6 in each group).
Figure S11 The concentration‐dependent curves of the LPS induced NF‐κB activation (A) and NO production (B) in HEK Blue TLR4 293 cells. LPS induces NF‐κB activation but not increased production of NO in HEK Blue TLR4 293 cells. Data are presented as means ± SD (n = 6 in each group).
Figure S12 The concentration‐dependent curve of T5342126 inhibiting LPS‐induced NO production and the concentration‐dependent curve of T5342126 on BV‐2 cellular toxicity. Data are presented as means ± SD (n = 6 in each group).
Supporting info item
Acknowledgements
We thank the National Institutes of Health (R01DE021966 to L. R. W.; R01GM101279 and R01GM103843 to H. Y.) for financial support. M. R. H. is the recipient of an Australian Research Council Research Fellowship (DP110100297). X. W. was supported by the starting‐up funding for the candidate of 100 Talents Program of Chinese Academy of Sciences, National Natural Science Foundation of China (no. 21543013) and the Open Funding of State Key Laboratory of Natural Medicines, China Pharmaceutical University (SKLNMKF201502). Some part of this work was supported by the intramural research programs of the National Institute on Drug Abuse and the National Institute on Alcohol Abuse and Alcoholism.
Wang, X. , Zhang, Y. , Peng, Y. , Hutchinson, M. R. , Rice, K. C. , Yin, H. , and Watkins, L. R. (2016) Pharmacological characterization of the opioid inactive isomers (+)‐naltrexone and (+)‐naloxone as antagonists of toll‐like receptor 4. British Journal of Pharmacology, 173: 856–869. doi: 10.1111/bph.13394.
References
- Alexander SPH, Fabbro D, Kelly E, Marrion N, Peters JA, Benson HE, et al. (2015). The Concise Guide to PHARMACOLOGY 2015/16: Catalytic receptors. Br J Pharmacol 172: 5979–6023. [DOI] [PMC free article] [PubMed] [Google Scholar]
- Bevan DE, Martinko AJ, Loram LC, Stahl JA, Taylor FR, Joshee S, et al (2010). Selection, preparation, and evaluation of small‐molecule inhibitors of toll‐like receptor 4. ACS Med Chem Lett 1: 194–198. [DOI] [PMC free article] [PubMed] [Google Scholar]
- Block ML, Zecca L, Hong JS (2007). Microglia‐mediated neurotoxicity: uncovering the molecular mechanisms. Nat Rev Neurosci 8: 57–69. [DOI] [PubMed] [Google Scholar]
- Bowen WS, Minns LA, Johnson DA, Mitchell TC, Hutton MM, Evans JT (2012). Selective TRIF‐dependent signaling by a synthetic toll‐like receptor 4 agonist. Sci Signal 5: ra13. [DOI] [PMC free article] [PubMed] [Google Scholar]
- Bozza S, Campo S, Arseni B, Inforzato A, Ragnar L, Bottazzi B, et al (2014). PTX3 binds MD‐2 and promotes TRIF‐dependent immune protection in aspergillosis. J Immunol 193: 2340–2348. [DOI] [PubMed] [Google Scholar]
- Chou TC (2006). Theoretical basis, experimental design, and computerized simulation of synergism and antagonism in drug combination studies. Pharmacol Rev 58: 621–681. [DOI] [PubMed] [Google Scholar]
- Cogswell JP, Godlevski MM, Wisely GB, Clay WC, Leesnitzer LM, Ways JP, et al (1994). NF‐kappa B regulates IL‐1 beta transcription through a consensus NF‐kappa B binding site and a nonconsensus CRE‐like site. J Immunol 153: 712–723. [PubMed] [Google Scholar]
- Coller JK, Hutchinson MR (2012). Implications of central immune signaling caused by drugs of abuse: mechanisms, mediators and new therapeutic approaches for prediction and treatment of drug dependence. Pharmacol Ther 134: 219–245. [DOI] [PubMed] [Google Scholar]
- De Castro C, Parrilli M, Holst O, Molinaro A (2010). Microbe‐associated molecular patterns in innate immunity: Extraction and chemical analysis of gram‐negative bacterial lipopolysaccharides. Methods Enzymol 480: 89–115. [DOI] [PubMed] [Google Scholar]
- Dilger RN, Johnson RW (2008). Aging, microglial cell priming, and the discordant central inflammatory response to signals from the peripheral immune system. J Leukoc Biol 84: 932–939. [DOI] [PMC free article] [PubMed] [Google Scholar]
- Diogenes A, Ferraz CC, Akopian AN, Henry MA, Hargreaves KM (2011). LPS sensitizes TRPV1 via activation of TLR4 in trigeminal sensory neurons. J Dent Res 90: 759–764. [DOI] [PubMed] [Google Scholar]
- Falvo JV, Tsytsykova AV, Goldfeld AE (2010). Transcriptional control of the TNF gene. Curr Dir Autoimmun 11: 27–60. [DOI] [PMC free article] [PubMed] [Google Scholar]
- Goodridge HS, McGuiness S, Houston KM, Egan CA, Al‐Riyami L, Alcocer MJ, et al (2007). Phosphorylcholine mimics the effects of ES‐62 on macrophages and dendritic cells. Parasite Immunol 29: 127–137. [DOI] [PubMed] [Google Scholar]
- Grace PM, Hutchinson MR, Maier SF, Watkins LR (2014). Pathological pain and the neuroimmune interface. Nat Rev Immunol 14: 217–231. [DOI] [PMC free article] [PubMed] [Google Scholar]
- Gwak YS, Hassler SE, Hulsebosch CE (2013). Reactive oxygen species contribute to neuropathic pain and locomotor dysfunction via activation of CamKII in remote segments following spinal cord contusion injury in rats. Pain 154: 1699–1708. [DOI] [PubMed] [Google Scholar]
- Henn A, Lund S, Hedtjarn M, Schrattenholz A, Porzgen P, Leist M (2009). The suitability of BV2 cells as alternative model system for primary microglia cultures or for animal experiments examining brain inflammation. ALTEX 26: 83–94. [DOI] [PubMed] [Google Scholar]
- Holguin A, O'Connor KA, Biedenkapp J, Campisi J, Wieseler‐Frank J, Milligan ED, et al (2004). HIV‐1 gp120 stimulates proinflammatory cytokine‐mediated pain facilitation via activation of nitric oxide synthase‐I (nNOS). Pain 110: 517–530. [DOI] [PubMed] [Google Scholar]
- Hutchinson MR, Northcutt AL, Hiranita T, Wang X, Lewis SS, Thomas J, et al (2012). Opioid activation of toll‐like receptor 4 contributes to drug reinforcement. J Neurosci 32: 11187–11200. [DOI] [PMC free article] [PubMed] [Google Scholar]
- Hutchinson MR, Shavit Y, Grace PM, Rice KC, Maier SF, Watkins LR (2011). Exploring the neuroimmunopharmacology of opioids: an integrative review of mechanisms of central immune signaling and their implications for opioid analgesia. Pharmacol Rev 63: 772–810. [DOI] [PMC free article] [PubMed] [Google Scholar]
- Hutchinson MR, Watkins LR (2014). Why is neuroimmunopharmacology crucial for the future of addiction research? Neuropharmacology 76 (Pt B): 218–227. [DOI] [PMC free article] [PubMed] [Google Scholar]
- Hutchinson MR, Zhang Y, Brown K, Coats BD, Shridhar M, Sholar PW, et al (2008). Non‐stereoselective reversal of neuropathic pain by naloxone and naltrexone: involvement of toll‐like receptor 4 (TLR4). Eur J Neurosci 28: 20–29. [DOI] [PMC free article] [PubMed] [Google Scholar]
- Hutchinson MR, Zhang Y, Shridhar M, Evans JH, Buchanan MM, Zhao TX, et al (2010). Evidence that opioids may have toll‐like receptor 4 and MD‐2 effects. Brain Behav Immun 24: 83–95. [DOI] [PMC free article] [PubMed] [Google Scholar]
- Ji RR, Xu ZZ, Gao YJ (2014). Emerging targets in neuroinflammation‐driven chronic pain. Nat Rev Drug Discov 13: 533–548. [DOI] [PMC free article] [PubMed] [Google Scholar]
- Joce C, Stahl JA, Shridhar M, Hutchinson MR, Watkins LR, Fedichev PO, et al (2010). Application of a novel in silico high‐throughput screen to identify selective inhibitors for protein–protein interactions. Bioorg Med Chem Lett 20: 5411–5413. [DOI] [PMC free article] [PubMed] [Google Scholar]
- Kovacic P, Cooksy AL (2005). Unifying mechanism for toxicity and addiction by abused drugs: electron transfer and reactive oxygen species. Med Hypotheses 64: 357–366. [DOI] [PubMed] [Google Scholar]
- Leung L, Cahill CM (2010). TNF‐alpha and neuropathic pain–a review. J Neuroinflammation 7: 27. [DOI] [PMC free article] [PubMed] [Google Scholar]
- Lewis SS, Loram LC, Hutchinson MR, Li CM, Zhang Y, Maier SF, et al (2012). (+)‐Naloxone, an opioid‐inactive toll‐like receptor 4 signaling inhibitor, reverses multiple models of chronic neuropathic pain in rats. Pain 13: 498–506. [DOI] [PMC free article] [PubMed] [Google Scholar]
- Loram LC, Sholar PW, Taylor FR, Wiesler JL, Babb JA, Strand KA, et al (2012). Sex and estradiol influence glial pro‐inflammatory responses to lipopolysaccharide in rats. Psychoneuroendocrinology 37: 1688–1699. [DOI] [PMC free article] [PubMed] [Google Scholar]
- Mata‐Haro V, Cekic C, Martin M, Chilton PM, Casella CR, Mitchell TC (2007). The vaccine adjuvant monophosphoryl lipid A as a TRIF‐biased agonist of TLR4. Science 316: 1628–1632. [DOI] [PubMed] [Google Scholar]
- McGrath JC, Lilley E (2015). Implementing guidelines on reporting research using animals (ARRIVE etc.): new requirements for publication in BJP. Br J Pharmacol 172: 3189–3193. [DOI] [PMC free article] [PubMed] [Google Scholar]
- Neumann H, Wekerle H (2013). Brain microglia: watchdogs with pedigree. Nat Neurosci 16: 253–255. [DOI] [PubMed] [Google Scholar]
- Northcutt A, Hutchinson M, Wang X, Baratta MV, Hiranita T, Cochran TA, et al (2015). DAT isn't all that: cocaine reward and reinforcement requires toll like receptor 4 signaling. Mol Psychiatry . doi:10.1038/mp.2014.177. [DOI] [PMC free article] [PubMed] [Google Scholar]
- Okun E, Griffioen KJ, Mattson MP (2011). Toll‐like receptor signaling in neural plasticity and disease. Trends Neurosci 34: 269–281. [DOI] [PMC free article] [PubMed] [Google Scholar]
- Pawson AJ, Sharman JL, Benson HE, Faccenda E, Alexander SPH, Buneman OP, et al, NC‐IUPHAR(2014). The IUPHAR/BPS Guide to PHARMACOLOGY: an expert‐driven knowledge base of drug targets and their ligands. Nucl. Acids Res. 42 (Database Issue): D1098–D1106. [DOI] [PMC free article] [PubMed] [Google Scholar]
- Pillarisetti S (2011). Targeting interleukin‐1beta for pain. CNS Neurol Disord Drug Targets 10: 571–575. [DOI] [PubMed] [Google Scholar]
- Poltorak A, He X, Smirnova I, Liu MY, Van Huffel C, Du X, et al (1998). Defective LPS signaling in C3H/HeJ and C57BL/10ScCr mice: mutations in Tlr4 gene. Science 282: 2085–2088. [DOI] [PubMed] [Google Scholar]
- Reed‐Geaghan EG, Savage JC, Hise AG, Landreth GE (2009). CD14 and toll‐like receptors 2 and 4 are required for fibrillar A{beta}‐stimulated microglial activation. J Neurosci 29: 11982–11992. [DOI] [PMC free article] [PubMed] [Google Scholar]
- Roman J, Ritzenthaler JD, Fenton MJ, Roser S, Schuyler W (2000). Transcriptional regulation of the human interleukin 1beta gene by fibronectin: role of protein kinase C and activator protein 1 (AP‐1). Cytokine 12: 1581–1596. [DOI] [PubMed] [Google Scholar]
- Schmidtko A, Tegeder I, Geisslinger G (2009). No NO, no pain? The role of nitric oxide and cGMP in spinal pain processing. Trends Neurosci 32: 339–346. [DOI] [PubMed] [Google Scholar]
- Stevens CW, Aravind S, Das S, Davis RL (2013). Pharmacological characterization of LPS and opioid interactions at the toll‐like receptor 4. Br J Pharmacol 168: 1421–1429. [DOI] [PMC free article] [PubMed] [Google Scholar]
- Sziebert L, Thomson PD, Jinkins J, Rice K, Adams T Jr, Henriksen N, et al (1983). Effect of naloxone treatment on the cardiopulmonary response to endotoxin in sheep. Adv Shock Res 10: 121–128. [PubMed] [Google Scholar]
- Takeuchi O, Akira S (2010). Pattern recognition receptors and inflammation. Cell 140: 805–820. [DOI] [PubMed] [Google Scholar]
- Tayfun Uzbay I, Oglesby MW (2001). Nitric oxide and substance dependence. Neurosci Biobehav Rev 25: 43–52. [DOI] [PubMed] [Google Scholar]
- Theberge FR, Li X, Kambhampati S, Pickens CL, St Laurent R, Bossert JM, et al (2013). Effect of chronic delivery of the Toll‐like receptor 4 antagonist (+)‐naltrexone on incubation of heroin craving. Biol Psychiatry 73: 729–737. [DOI] [PMC free article] [PubMed] [Google Scholar]
- Toda N, Kishioka S, Hatano Y, Toda H (2009). Modulation of opioid actions by nitric oxide signaling. Anesthesiology 110: 166–181. [DOI] [PubMed] [Google Scholar]
- Tse KH, Chow KB, Leung WK, Wong YH, Wise H (2014). Lipopolysaccharide differentially modulates expression of cytokines and cyclooxygenases in dorsal root ganglion cells via toll‐like receptor‐4 dependent pathways. Neuroscience 267: 241–251. [DOI] [PubMed] [Google Scholar]
- Wang HY, Burns LH (2009). Naloxone's pentapeptide binding site on filamin A blocks Mu opioid receptor‐Gs coupling and CREB activation of acute morphine. PLoS One 4: e4282. [DOI] [PMC free article] [PubMed] [Google Scholar] [Retracted]
- Wang Q, Zhou H, Gao H, Chen SH, Chu CH, Wilson B, et al (2012a). Naloxone inhibits immune cell function by suppressing superoxide production through a direct interaction with gp91phox subunit of NADPH oxidase. J Neuroinflammation 9: 32. [DOI] [PMC free article] [PubMed] [Google Scholar]
- Wang X, Grace PM, Pham MN, Cheng K, Strand KA, Smith C, et al (2013a). Rifampin inhibits toll‐like receptor 4 signaling by targeting myeloid differentiation protein 2 and attenuates neuropathic pain. FASEB J 27: 2713–2722. [DOI] [PMC free article] [PubMed] [Google Scholar]
- Wang X, Loram LC, Ramos K, de Jesus AJ, Thomas J, Cheng K, et al (2012b). Morphine activates neuroinflammation in a manner parallel to endotoxin. Proc Natl Acad Sci U S A 109: 6325–6330. [DOI] [PMC free article] [PubMed] [Google Scholar]
- Wang X, Smith C, Yin H (2013b). Targeting toll‐like receptors with small molecule agents. Chem Soc Rev 42: 4859–4866. [DOI] [PMC free article] [PubMed] [Google Scholar]
- Watkins LR, Wang X, Mustafa S, Hutchinson MR (2014). In vivo veritas: (+)‐naltrexone's actions define translational importance: A letter in response to Skolnick et al. 'translational potential of naloxone and naltrexone as TLR4 antagonists'. Trends Pharmacol Sci 35: 432–433. [DOI] [PubMed] [Google Scholar]
- Wu HE, Sun HS, Cheng CW, Terashvili M, Tseng LF (2006). dextro‐Naloxone or levo‐naloxone reverses the attenuation of morphine antinociception induced by lipopolysaccharide in the mouse spinal cord via a non‐opioid mechanism. Eur J Neurosci 24: 2575–2580. [DOI] [PubMed] [Google Scholar]
- Yang H, Hreggvidsdottir HS, Palmblad K, Wang H, Ochani M, Li J, et al (2010). A critical cysteine is required for HMGB1 binding to toll‐like receptor 4 and activation of macrophage cytokine release. Proc Natl Acad Sci U S A 107: 11942–11947. [DOI] [PMC free article] [PubMed] [Google Scholar]
- Yowtak J, Lee KY, Kim HY, Wang J, Kim HK, Chung K, et al (2011). Reactive oxygen species contribute to neuropathic pain by reducing spinal GABA release. Pain 152: 844–852. [DOI] [PMC free article] [PubMed] [Google Scholar]
- Zhang Y, Chen K, Sloan SA, Bennett ML, Scholze AR, O'Keeffe S, et al (2014). an rna‐sequencing transcriptome and splicing database of glia, neurons, and vascular cells of the cerebral cortex. J Neurosci 34: 11929–11947. [DOI] [PMC free article] [PubMed] [Google Scholar]
- Zhao H, Kalivendi S, Zhang H, Joseph J, Nithipatikom K, Vasquez‐Vivar J, et al (2003). Superoxide reacts with hydroethidine but forms a fluorescent product that is distinctly different from ethidium: potential implications in intracellular fluorescence detection of superoxide. Free Radic Biol Med 34: 1359–1368. [DOI] [PubMed] [Google Scholar]
- Zhao XJ, Dong Q, Bindas J, Piganelli JD, Magill A, Reiser J, et al (2008). TRIF and IRF‐3 binding to the TNF promoter results in macrophage TNF dysregulation and steatosis induced by chronic ethanol. J Immunol 181: 3049–3056. [DOI] [PMC free article] [PubMed] [Google Scholar]
Associated Data
This section collects any data citations, data availability statements, or supplementary materials included in this article.
Supplementary Materials
Figure S1 (+)‐Naltrexone and (+)‐naloxone inhibit the increased production of reactive oxygen species (ROS) in microglial BV‐2 cells. BV‐2 cells were pretreated with 200μM (+)‐naltrexone/(+)‐naloxone for 30 min and then stimulated with LPS (200 ng.mL‐1) for 30 min. The intracellular ROS burst was measured by dihydroethidium staining and the cells were imaged by an EVOS FL Cell Imaging System. Dihydroethidium interacts with superoxide to form oxyethidium, which in turn interacts with nucleic acids to emit a bright red color detectable qualitatively by fluorescence microscopy. Six independent experiments were performed and representative data are shown.
Figure S2 (+)‐Naltrexone and (+)‐naloxone do not inhibit LPS induced IL‐1β over‐production. BV‐2 cells were treated with LPS (200 ng.mL‐1) and (+)‐naltrexone/(+)‐naloxone. After 24 h treatment, cell lysis supernatant was collected for IL‐1β ELISA. The IL‐1β level was normalized by total protein concentration determined by BCA assay. Data are presented as means ± SD (n = 6 in each group).
Figure S3 (+)‐Naltrexone and (+)‐naloxone do not inhibit LPS induced NF‐κB activation in BV‐2 cells. (A, B), BV‐2 NF‐κB luciferase reporter cells were treated with LPS (200 ng.mL‐1) and (+)‐naltrexone/(+)‐naloxone. After 6 h (A) or 12 h (B) of incubation, the NF‐κB activity was determined by the Steady‐Glo luciferase assay. (C, D), BV‐2 NF‐κB luciferase reporter cells were treated with LPS (200 ng.mL‐1) and (+)‐naltrexone (C)/(+)‐naloxone (D). After 24 h of incubation, the NF‐κB activity was determined by the Steady‐Glo luciferase assay. (E, F), BV‐2 NF‐κB luciferase reporter cells were treated with 10 (E) or 100 μM (F) (+)‐naltrexone/(+)‐naloxone and various concentrations of LPS. After 24 h of treatment, the NF‐κB activity was determined by the Steady‐Glo luciferase assay. LPS versus LPS +10 μM (+)‐naltrexone, P=0.69 by one‐way ANOVA; LPS versus LPS +10 μM (+)‐naloxone, P=0.92 by one‐way ANOVA; LPS versus LPS +100 μM (+)‐naltrexone, P=0.82 by one‐way ANOVA; LPS versus LPS +100 μM (+)‐naloxone, P=0.87 by one‐way ANOVA. It should be noted that the NF‐κB activity of the vehicle treated control BV‐2 was set as 1. Data are presented as means ± SD (n = 6 in each group).
Figure S4 (+)‐Naltrexone and (+)‐naloxone do not interact with T5342126 in inhibiting LPS‐induced NF‐κB activation in BV‐2 cells. NF‐κB luciferase reporter cells were treated with LPS (200 ng.mL‐1), 50 μM (+)‐naltrexone/(+)‐naloxone, and various concentrations of T5342126. After 24 h of treatment, the NF‐κB activity was determined by the Steady‐Glo luciferase assay. The NF‐κB activity of the vehicle treated control BV‐2 was set as 1. T5342126 versus T5342126+50 μM (+)‐naltrexone, P=0.71 by one‐way ANOVA; T5342126+50 μM (+)‐naloxone, P=0.92 by one‐way ANOVA. Data are presented as means ± SD (n = 6 in each group).
Figure S5 (+)‐Naltrexone and (+)‐naloxone do not inhibit TNF‐α induced NF‐κB activation in BV‐2 cells. NF‐κB luciferase reporter cells were treated with TNF‐α (400 ng.mL‐1) and different concentrations of (+)‐naltrexone/(+)‐naloxone. After 24 h treatment, NF‐κB activity was determined by the Steady‐Glo luciferase assay. The NF‐κB activity of the vehicle treated control BV‐2 was set as 1. Data are presented as means ± SD (n = 6 in each group).
Figure S6 Quantification of the Western blotting of the phosphorylation of p65 subunit of NF‐κB (A), p38 (B) and JNK (C) shown in Figure 8 in the main text.
Figure S7 (+)‐Naltrexone and (+)‐naloxone do not inhibit LPS induced NF‐κB activation in primary microglia. Rat neonatal microglia were stimulated with LPS (200 ng.mL‐1) and 200μM of (+)‐naltrexone/(+)‐naloxone for 1.5 h. The phosphorylation of p65 subunit of NF‐κB was detected by Western blotting. Five independent experiments were performed (n = 5).
Figure S8 (+)‐Naltrexone and (+)‐naloxone do not inhibit LPS induced NF‐κB activation in primary macrophage. Rat peritoneal macrophages were stimulated with LPS (20 ng.mL‐1) and 200 μM of (+)‐naltrexone/(+)‐naloxone for 1.5 h. The phosphorylation of p65 subunit of NF‐κB was detected by Western blotting. Five independent experiments were performed (n = 5).
Figure S9 (+)‐Naltrexone and (+)‐naloxone do not inhibit type I interferon receptor (Type I IFNR)‐JAK‐STAT signalling. BV‐2 cells were treated with IFN‐γ (50 ng.mL‐1) and different concentrations of (+)‐naltrexone/(+)‐naloxone. After 24 h treatment, NO in the supernatant was measured. The NO level in the IFN‐γ treated group was set as 100%. Data are presented as means ± SD (n = 6 in each group).
Figure S10 (+)‐Naltrexone and (+)‐naloxone do not inhibit TNF‐α induced NO increased production in BV‐2 cells. BV‐2 cells were treated with TNF‐α (400 ng.mL‐1) and different concentrations of (+)‐naltrexone/(+)‐naloxone for 3 days. NO in the supernatant was subsequently measured. The NO level in the TNF‐α treated group was set as 100%. Data are presented as means ± SD (n = 6 in each group).
Figure S11 The concentration‐dependent curves of the LPS induced NF‐κB activation (A) and NO production (B) in HEK Blue TLR4 293 cells. LPS induces NF‐κB activation but not increased production of NO in HEK Blue TLR4 293 cells. Data are presented as means ± SD (n = 6 in each group).
Figure S12 The concentration‐dependent curve of T5342126 inhibiting LPS‐induced NO production and the concentration‐dependent curve of T5342126 on BV‐2 cellular toxicity. Data are presented as means ± SD (n = 6 in each group).
Supporting info item