

Abstract
The National Database for Autism Research (NDAR) is a US National Institutes of Health (NIH)-funded research data repository created by integrating heterogeneous datasets through data sharing agreements between autism researchers and the NIH. To date, NDAR is considered the largest neuroscience and genomic data repository for autism research. In addition to biomedical data, NDAR contains a large collection of clinical and behavioral assessments and health outcomes from novel interventions. Importantly, NDAR has a global unique patient identifier that can be linked to aggregated individual-level data for hypothesis generation and testing, and for replicating research findings. As such, NDAR promotes collaboration and maximizes public investment in the original data collection. As screening and diagnostic technologies as well as interventions for children with autism are expensive, health services research (HSR) and health technology assessment (HTA) are needed to generate more evidence to facilitate implementation when warranted. This article describes NDAR and explains its value to health services researchers and decision scientists interested in autism and other mental health conditions. We provide a description of the scope and structure of NDAR and illustrate how data are likely to grow over time and become available for HSR and HTA.
1 Introduction
Thanks to advances in electronic data capture and sharing, the availability of Big Data offers researchers unprecedented opportunities to explore new relationships in many areas of inquiry including sales and marketing, surveillance, political campaigns, and scientific discovery. While basic science discoveries are important and drive clinical research, large-scale data-driven science is needed to improve efficiency in the conduct of research and better inform avenues of enquiry in basic, clinical, and applied science [1, 2]. In 2004, the National Institutes of Health (NIH) launched the Roadmap for Medical Research that focused on the need to increase the speed in which basic research is translated into human studies with the goal of improving clinical practice [1]. One of the NIH Roadmap initiatives, Reengineering the Clinical Research Enterprise, aimed to develop better integrated networks on biomedical and clinical research, including databases to facilitate data sharing among research groups. An example of one such network developed from the NIH Roadmap agenda is the National Electronics Clinical Trials and Research (NECTAR) network, which provides informatics infrastructure as the backbone for an interconnected and inter-operable research network. However, the role for networks envisioned by the NIH Roadmap initiative was limited to being largely a patient recruitment tool for clinical research [3].
In contrast, the National Database for Autism Research (NDAR) [4], a controlled-access data repository, was developed with the vision of creating a secure data repository that could be used specifically for research purposes [5]. NDAR grew out of the US federal funding law for autism research enacted in 2006, the Combating Autism Act, which called for almost $US1 billion over 5 years for research covering interventions, diagnosis, genetics, neurobiology, and services. The Combating Autism Act was reauthorized in 2011 and was renewed again in 2014 as the Autism Collaboration, Accountability, Research, Education and Support Act (Autism CARES Act). The NIH expects researchers who receive funding for autism research to contribute data to NDAR, with the NIH-funded Autism Centers of Excellence (ACE) being the first to contribute data to NDAR in 2008. With the federal funding for autism research, data generated from autism research can be expected to continue to grow. In addition, NDAR federates with other public and privately funded data bio-repositories that store aggregated autism-related data such as the Autism Genetics Research Exchange (AGRE) and the Simons Foundation Autism Research Initiative (SFARI) [5]. The vision for NDAR to promote data sharing to enhance research in autism combined with an aggressive plan to increase the amount of data shared within it creates tremendous opportunities for Big Data research and collaboration in autism.
Data generated from autism research included in NDAR are highly heterogeneous, including a wide range of clinical assessments of symptoms and functioning, genetic and genomic findings, imaging modalities, utilization of health and education resources, and quantitative behavioral assessments such as eye movement tracking [5]. The ability to assess and collate heterogeneous data across these different categories is critical for data repositories such as NDAR to enable research from a broad community of researchers beyond the grant recipients [2]. NDAR was designed to handle the challenges of complex data generated by different laboratories and research enterprises under different protocols. NDAR provides tools to define and standardize the data and also to ensure a collaborative approach with controlled access to the whole autism research community. The NDAR model has proven successful and the framework has recently been expanded to include a more general NIH-based collection of primary data via the National Database for Clinical Trials (NDCT) related to mental illness (e.g., Clinical Antipsychotic Trials of Intervention Effectiveness [CATIE], Sequenced Treatment Alternatives to Relieve Depression [STAR*D]) and other brain disorders, and the National Institute of Mental Health (NIMH) Research Domain Criteria (RDoC) initiative. The RDoC project aims to develop new ways of classifying mental disorders based on behavioral dimensions and neurobiological measures that will eventually aggregate clinical research data from all mental disorders.
NDAR offers great opportunities to explore and to advance scientific discoveries [6, 7]. The purpose of this article is to discuss the opportunities for using NDAR in health services research (HSR) and health technology assessment (HTA). We first illustrate how data-sharing requirements by federal authorities can create a Big Data source for secondary analysis by researchers interested in HSR and HTA in autism that could be adopted for other conditions. We then describe potential opportunities for using NDAR's rich genomic information to identify new avenues for technology assessment. Finally, we demonstrate how NDAR can be used to identify specific studies of interventions that could be targeted for implementation.
2. Structure and Use of the National Database for Autism Research (NDAR)
NDAR has two key components that serve as the basis for a bioinformatics portal: a global unique identifier (GUID) for research subjects and a researcher-defined harmonized data definition data dictionary for experiment descriptions [5]. The GUID serves as the essential link to aggregate clinical and biomedical research data across laboratories, research projects, and data repositories without breaching personally identifiable information [8]. NDAR provides software to create a GUID for each subject in a study using information from a birth certificate, as most subjects are young and the information is invariant over time. The GUID cannot be used in reverse to obtain personally identifiable information, which is in line with Health Insurance Portability and Accountability Act (HIPAA) guidelines to protect anonymity and confidentiality of the subject [8].
Another key component of NDAR is the library of extensive data definitions, which encompass 800 autism measures from clinical, imaging, and genomic research in autism. This component helps standardize data across different labs and repositories. NDAR provides a data validation tool for autism researchers to confirm if their data are compatible with the existing definitions before submission. In addition to clinical and behavioral measures, the data dictionary includes some history forms created by data owners to identify interventions and utilizations in projects that shared data in NDAR, such as the EARLI_Intervention History, Early Intervention Services Interview, Intervention History, and Service Utilization Questionnaire, which could be used to conduct secondary analysis for HSR.
These two NDAR components not only facilitate data sharing, aggregation, and harmonization, they also can be used as query tools. Researchers can explore shared data in NDAR using different query tools such as query by data dictionary, by concept, and by GUID. Query tabs on data from labs and data from papers allow researchers to see a list of projects and papers that include data shared with NDAR with hyperlinks to federal databases that provide relevant grant awardee information. However, if researchers want to download any data, they are required to request NDAR access. If researchers need data not held directly by NDAR, they need to obtain permission for data access from the partner organizations (Table 1). However, researchers can browse the data available in each repository to see if requesting data access is worthwhile. Figure 1 presents a flow chart for downloading shared data in NDAR.
Table 1. Projects sharing or expecting to share data with the National Database for Autism Research.
| Project | Additional access required |
|---|---|
| NIH-Autism Centers of Excellence (ACE) | No |
| Autism Genetics Research Exchange (AGRE) | Yes |
| Autism Science Foundation | No |
| Autism Tissue Program (ATP) | No |
| Collaborative Programs of Excellence in Autism (CPEA) | No |
| Interactive Autism Network (IAN) | Yes |
| Pediatric MRI Data Repository | No |
| NIMH Genetics Repository | No |
| NIMH Transcriptional Atlas of Human Brain Development | No |
| Simons Foundation Autism Research Initiative (SFARI) | No |
| State of New Jersey | No |
| Studies to Advance Autism Research and Treatment (STAART) | No |
| U.S. Department of Defense | No |
| U.S. Department of Education | No |
MRI magnetic resonance imaging, NIH National Institutes of Health, NIMH National Institute of Mental Health
Fig. 1.
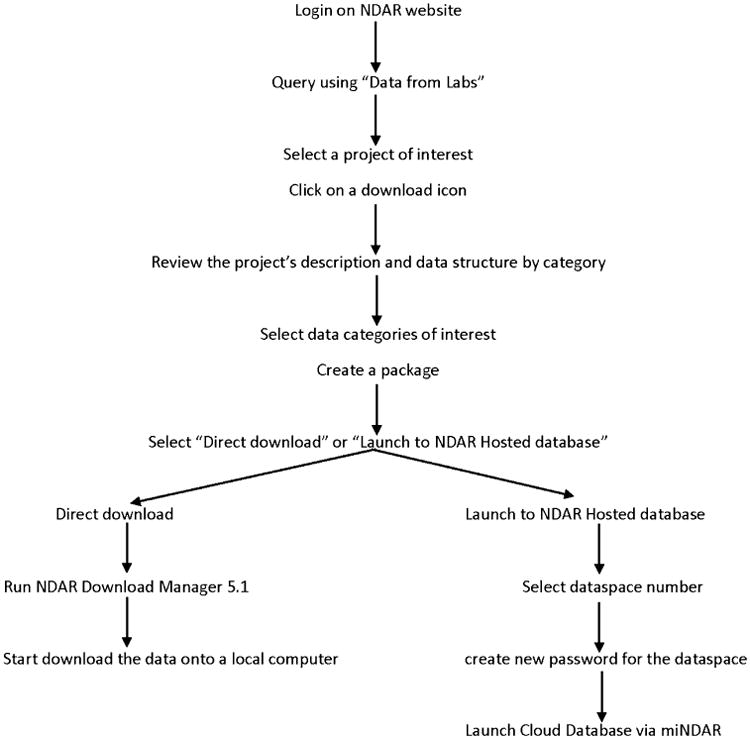
Flow diagram for data access. NDAR National Database for Autism Research. miNDAR mini NAR or an NDAR-hosted database
NDAR also integrates cloud computing resources within shared data available in the data from papers that allow researchers to move high-dimensional imaging data directly into software designed for highly efficient processing and analysis. Examples of the current computing resources are the Neuroinformatics Tool and Resources Cloud (NITRC) Computational Environment (NITRC-CE) and the LONI (Laboratory of Neuro Imaging) Pipeline. The NITRC-CE is an on-demand, cloud-based virtual computing platform pre-configured with neuroimaging data analysis released in 2014 from the NITRC [9]. Researchers using NITRC-CE can pay Amazon Web Services (AWS) directly for their computing time [10]. NDAR researchers considering NIRTC-CE may build the AWS usage fees into their grant requests. The LONI Pipeline is a free workflow application that creates a graphical framework for constructing workflows and executing complex high-throughput analysis [6]. This newly developed interactivity between NDAR and the LONI Pipeline enables researchers to conduct a large-scale analysis from multiple sites and regions of the autism spectrum in a timely manner. The LONI Pipeline is also available for use via the NITRC-CE.
As of 10 April 2015, NDAR shared data on 117,573 subjects by age (57,510 affected subjects and 59,763 control subjects) or 80,578 individuals whose ages range from toddlers to adults, and includes ~800 clinical measures, 4000 electroencephalograms (EEGs), over 10,000 whole exome sequences, and 2000 magnetic resonance images (MRIs). NDAR continues to grow as the NIMH RDoC and the NDCT data related to mental illness initiatives begin sharing data in the NIMH Data Archive. Clearly, NDAR provides a Big Data source for autism research, which is of particular importance to researchers interested in child health.
3 NDAR and Opportunities for Health Services Research and Health Technology Assessment
Big Data sources such as NDAR have potential for accelerating HSR and HTA related to autism. NDAR is considered the largest human subject repository in neuroscience that can be linked to a wealth of individual-level clinical assessment information and outcomes following interventions. Not only can it enable the larger research community to generate and test hypotheses, replicate findings, promote collaboration, and maximize the efficiency of their collection, it can catalyze relationships not envisioned by the original data collectors. Basic scientists have started to recognize the opportunities created by NDAR [11, 12]. Supekar et al. [12] confirmed that brain hyperconnectivity links to social dysfunction in children with autism using NDAR. Applied research scientists such as Wei et al. [13] have used NDAR to examine psychometric properties of a screening instrument for children with autism, the Social Communication Questionnaire. NDAR offers rich data that health services researchers can use to assess the value of new interventions and their impact on health and well-being.
We reviewed all shared NDAR data using the “data from labs” query from 10 April 2014 to 9 March 2015 to create a user-developed catalog of interventions shared in NDAR that would assist health services researchers and implementation scientists interested in autism studies. The term “intervention” refers to any treatment or service provided to children with autism to improve core impairments and other associated symptoms. Each NDAR project was reviewed using its research description in the NIH Research Portfolio Online Reporting Tools to identify whether any interventions were involved. A catalog of interventions was then created in a Microsoft Excel® spreadsheet and shared data were downloaded for further investigation.
A total of 268 research projects were created in NDAR and half of those have shared data. Fifty-nine projects are a part of RDoC (n = 28) and NDCT (n = 31). The first data from RDoC and NDCT can be expected in the Northern fall of 2015. Of 209 projects, 84 (40 %) studies involving interventions related to autism were identified. These projects were categorized further, based solely on the authors' opinion, as observational (n = 23), effectiveness (n = 15), HSR (n = 18), and efficacy (n = 28) studies. Table 2 provides examples of projects sharing data in NDAR. However, 80 projects appearing in NDAR have not yet released their data and at least 50 projects are still ongoing, resulting in 11,972 subjects by age with information currently available. Interventions include pharmacotherapy, early intensive behavioral therapy, cognitive behavioral techniques, community health services, and others (e.g., peer engagement, sensory integration-based therapy, school integration services, language integration). The majority of the projects categorized as effectiveness and HSR studies are still ongoing, and they have not yet shared their data. However, it will be possible to aggregate shared data and to conduct pooled analyses using GUID identifiers in the future. It is important to note that most outcome measures used in autism research are clinical and behavioral measures, which cannot be used directly in economic evaluation [14]. There is a need to translate or convert those outcomes into a standard metric (i.e., quality-adjusted life-years [QALYs]) for cost-effectiveness analysis.
Table 2. Examples of projects and data sharing in the National Database for Autism Research.
| Type of studya | NDAR ID | Query type | Title | Project ID | No. of shared subjects by age |
|---|---|---|---|---|---|
| Efficacy | 14 | Data from labs | Early pharmacotherapy guided by biomarkers in autism | R01NS061264 | 166 |
| 16 | Data from labs | Intensive intervention for toddlers with autism (EARLY STEPS) | R01MH81757 | 95 | |
| 20 | Data from labs | CBT for anxiety in adolescents with autism | R34HD065274 | 94 | |
| 1550 | Data from labs | Sensory integration treatment in ASD | R34DC010927 | 50 | |
| 1652b | Data from labs | UW ACE Project II: early connections | P50HD055782 | 533 | |
| Effectiveness | 1863 | Data from labs | Child-initiated interactions and autism intervention | R34DC10924 | 3 |
| 1300 | Data from labs | Behavioral treatment for autism in community settings using a telehealth network | R01MH89607 | 40 | |
| 1950c | Data from labs | Effectiveness and implementation of a mental health intervention for ASD | R01MH94317 | 143 | |
| Health services research | 15 | Data from labs | Measuring QALYs in children with ASDs | R01MH89466 | 216 |
| 1965 | Data from labs | Longitudinal studies of autism spectrum disorders: from 2 to 23 | R01MH081873 | 63 | |
| 2059 | Data from labs | Family outcomes in autism spectrum disorders | R01MH099190 | 125 | |
| 306 | Data from papers | The study of health outcomes in children with autism and their family | Contract no. HHSN-271-2010-00033-C | NAd | |
| 360 | Data from papers | Predicting health utilities for children with autism spectrum disorders | R01MH89466 | 216 |
ACE Autism Centers of Excellence, ASD autism spectrum disorder, CBT cognitive behavioral therapy, NA not available, NDAR National Database for Autism Research, QALYs quality-adjusted life-years, UW University of Washington
Study types were categorized based solely on the authors' opinions from description of the projects
The data are now available under NDAR ID 1654 (Data from Labs)
Project is still ongoing
Only aggregated data are available
Comparative effectiveness of interventions for children with autism that incorporates cost is lacking due to the scarcity of information on health utility scores typically used for calculating QALYs. We developed algorithms for mapping clinical and behavioral measures for children with autism to health utility scores [15]. Individual level information of the Health Utilities Index 3 were also shared in NDAR (NDAR ID 15 and 360, Table 2). In this example, we illustrate how to use shared data in NDAR to estimate health utility scores for cost-effectiveness analysis. We selected a project from one of the ACE studies that involved an early intervention. Child age of interview, phenotypes, Mullen Scales of Early Learning composite standard score (Mullen ELC), and Vineland-II Adaptive Behavioral Scale composite scores were extracted from the shared data and then linked using GUID identifiers. Seventy-four subjects were included in the final analytical file with three follow-up times at age 12, 18, and 24 months old. The majority of the subjects were boys (61 %), with an average age of 6.5 months old at baseline. Children in this study had normal cognitive functioning with Mullen intelligence quotient (IQ) scores (±standard deviation [SD]) averaging 101.2 ± 15.2. The estimated health utility scores (±SD) increased over the 18-month follow-up period from an average of 0.796 ± 0.082 at baseline to 0.902 ± 0.064. Using query by GUID data from the ACE study, the project shares information on 787 subjects by age. Some of these subjects also participated in other studies such as the Intensive Intervention for Toddlers With Autism (EARLY STEPS) study, the Longitudinal MRI Study of Infants at Risk for Autism, and The MET Signaling System, Autism and Gastrointestinal Dysfunction study. Table 3 illustrates heterogeneous information shared from this project. Resource use information can be inferred and calculated appropriately from information on the type and frequency of assessments. The availability of patient-level data (GUID) from multiple studies can be aggregated to permit the development of stochastic models for analyzing both costs and health outcomes for formal HTAs of new interventions.
Table 3. An example of heterogeneous data shared from a project in the National Database for Autism Research.
| Type of data | Examples |
|---|---|
| Clinical and behavioral assessments | Social Competence Questionnaire |
| Brief Symptom Inventory | |
| Early Development Interview | |
| Maternal Behavior Rating Scale | |
| NCAST Teaching Scale | |
| Early Childhood behavior Questionnaire | |
| Infant Behavior Questionnaire Revised | |
| CSBS DP Behavior Sample | |
| First Year Inventory | |
| Intervention History | |
| Working Alliance Scale | |
| Parent Sense of Competence | |
| Modified Checklist for Autism in Toddlers (M-CHAT) | |
| CSBS DP Infant-Toddler Checklist | |
| Child Behavior Rating Scale | |
| Social Support Questionnaire | |
| Childhood Autism Risks from Genetics and the Environment (CHARGE) Family Characteristics Questionnaire | |
| Battelle Developmental Inventory | |
| Early Screening for Autistic Traits | |
| Symptom Checklist 90–Revised | |
| Joint Attention/Social and Nonsocial Orienting Task | |
| Life Events Survey | |
| Vineland-II Survey Form (2005) | |
| Vineland-II—Parent and Caregiver Rating Form (2005) | |
| Sensory Experiences Questionnaire | |
| Mullen Scales of Early Learning | |
| Repetitive Behavior Scale | |
| Demographics | Child Information Sheet |
| Physical examination | |
| Dyadic Adjustment Scale | |
| Diagnostics | Autism Observation Scale for Infants |
| Autism Diagnostic Interview, Revised | |
| DSM-IV Checklist (Early Steps) | |
| Images | Diffusion tensor imaging |
| MRI | |
| Functional MRI | |
| Free Surfer Volumetrix | |
| Advanced Normalization Tools Cortical Thickness | |
| Medical history | CHARGE Medical History |
CSBS DP Communication and Symbolic Behavior Scales Developmental Profile, CHARGE Childhood Autism Risks from Genetics and the Environment, DSM-IV Diagnostic and Statistical Manual of Mental Disorders, 4th edition, MRI magnetic resonance imaging, NCAST Nursing Child Assessment Satellite Training
Table 4 presents another example extracted from a project involved in an early intervention. There were 95 individual subjects with average age (±SD) of 2.1 ± 0.3 years old. The majority of the subjects were male and were categorized as severely affected by autism. Of these subjects, 63.2 % had a cognitive ability score less than 71, measured by the Mullen ELC. These data contained four control subjects. Estimated health utility scores calculated using the same mapping algorithm as above were the lowest among severely affected children (average health utility score [±SD[ of 0.643 ± 0.123). Only 12.5 % of the subjects received applied behavioral analysis (ABA). In addition, only 28.6 % of children with severely affected autism spectrum disorder (ASD) received ABA. By phenotypes, the data showed that the group of children who received ABA had poorer health than the group who received other interventions. In the group of children who had cognitive disability (IQ <71), children who received ABA had poorer health than children who received other interventions. Cost-effectiveness modeling for early intervention for ABA could be built (Fig. 2) using the information from Tables 3, 4 and 5. Table 4 provides information regarding the number of different interventions reported by subjects' caregivers in NDAR ID 16 and some costs related to interventions. Costs of interventions including ABA could also be extracted from literature [16–18]. Table 6 presents all-cause healthcare utilization among children with ASD, extracted from NDAR ID 306. While many of the individual research projects use small samples, NDAR permits the aggregation of these samples for secondary analysis. Also, the number of projects contributing data to NDAR continues to grow over time and should provide new opportunities for research that are currently unavailable.
Table 4. Estimated baseline health utility scores for the National Database for Autism Research (NDAR) ID 16, using NDAR ID 306.
| N | NDAR ID 16 (%a) | Received ABA/discrete trial/Lovaas/intensive early intervention % | Estimated health utility scores | ||||||
|---|---|---|---|---|---|---|---|---|---|
|
| |||||||||
| All sample | Received ABA/discrete trial/Lovaas/intensive early intervention | Received other interventions | |||||||
|
|
|
|
|||||||
| N | Mean ± SD | N | Mean ± SD | N | Mean ± SD | ||||
| Age (years) [mean ± SD] | 95 | 2.1 ± 0.3 | 74 | 0.662 ± 0.129 | |||||
| Sex | |||||||||
| Male | 73 | 76.8 | 34.3 | 56 | 0.657 ± 0.124 | 20 | 0.650 ± 0.159 | 36 | 0.661 ± 0.101 |
| Female | 22 | 23.2 | 22.7 | 18 | 0.678 ± 0.146 | 4 | 0.759 ± 0.072 | 14 | 0.655 ± 0.156 |
| Phenotype | |||||||||
| Autism spectrum mildly affected | 3 | 3.2 | 45.5 | 3 | 0.668 ± 0.123 | 1 | 0.802 ± 0.000 | 2 | 0.600 ± 0.056 |
| Autism spectrum affected | 11 | 11.6 | 33.3 | 9 | 0.746 ± 0.120 | 4 | 0.719 ± 0.104 | 5 | 0.767 ± 0.140 |
| Autism spectrum severely affected | 77 | 81.1 | 28.6 | 59 | 0.643 ± 0.123 | 17 | 0.636 ± 0.152 | 42 | 0.646 ± 0.111 |
| Control | 4 | 4.2 | 50.0 | 3 | 0.785 ± 0.171 | 2 | 0.777 ± 0.241 | 1 | 0.799 ± 0.000 |
| Cognitive ability score [mean ± SD] | 68.3 ± 16.1 | ||||||||
| <71 | 60 | 63.2 | 31.7 | 45 | 0.600 ± 0.102 | 14 | 0.594 ± 0.138 | 31 | 0.603 ± 0.083 |
| ≥71 | 35 | 36.8 | 31.4 | 29 | 0.759 ± 0.104 | 10 | 0.772 ± 0.106 | 19 | 0.753 ± 0.106 |
| Type of intervention received | |||||||||
| ABA/discrete trial/Lovaas/intensive early intervention | 12.5 | ||||||||
| Speech therapy | 27.2 | ||||||||
| Special education | 15.7 | ||||||||
| Occupational therapy | 17.8 | ||||||||
| Home program (non-ABA) | 4.2 | ||||||||
| Biomedical/nutritional | 4.2 | ||||||||
| Counseling/psychological services | 2.4 | ||||||||
| Developmental play therapy | 2.1 | ||||||||
| Others | 13.9 | ||||||||
ABA applied behavioral analysis, SD standard deviation
Unless otherwise stated
Fig. 2.
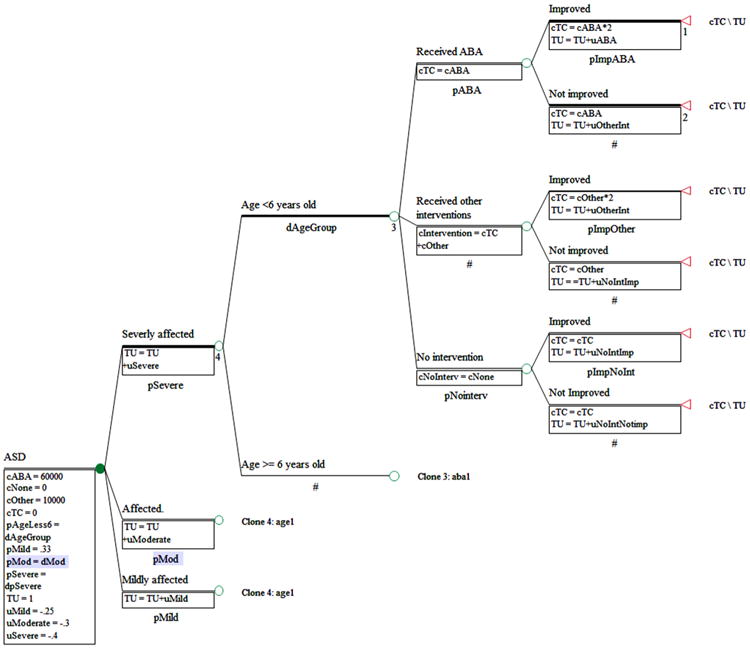
Example of a decision tree diagram for cost-effectiveness analysis of early interventions. ABA applied behavioral analysis, ASD autism spectrum disorder, cABA cost of ABA, cNoInterv cost of no intervention, cNone cost of no intervention, cOther costs of other interventions, cTC Total cost, pABA probability of receiving ABA, pAgeLess6 probability of being in the group of age <6 years old, pMild probability of having mild ASD, pMod probability of having mmoderate ASD, pNointerv probability of receiving no intervention, pSevere probability of having severe ASD, TU total health utility, uMild health utility of mild ASD, uABA health utility related to receiving ABA, uModerate health utility of moderate ASD, uNoIntImp health utility related to receiving no intervention and no improvement, uOtherInt health utility related to receiving other interventions, uSevere health utility of severe ASD
Table 5. Self-reported utilization of interventions for children with autism spectrum disorder, extracted from the National Database for Autism Research ID 16.
| Type of intervention | Cost ($US) | N | Number of h/week | ||||
|---|---|---|---|---|---|---|---|
|
|
|||||||
| Average | SD | 1st quartile | Median | 3rd quartile | |||
| Speech therapy | 68/h [31] | 78 | 0.9 | 0.5 | 1 | 1 | 1 |
| Occupational therapy | 68/h [31] | 51 | 0.8 | 0.5 | 1 | 1 | 1 |
| Special education | 14,057/year [17] | 45 | 2.4 | 5.8 | 1 | 1 | 2 |
| ABA/discrete trial/Lovaas/intensive early intervention | 56,000/year [17] | 36 | 10.6 | 9.7 | 2 | 7.5 | 17 |
| Home program (not ABA) | 12 | 1.0 | 0.0 | 1 | 1 | 1 | |
| Biomedical/nutritional | 88/h [32] | 8 | 1.3 | 2.4 | 0 | 0.5 | 1 |
| Developmental play therapy | 43/h [32] | 6 | 4.7 | 7.6 | 1 | 1.5 | 3 |
| Parent–child recreation | 6 | 1.0 | 0.6 | 1 | 1 | 1 | |
| Parent–child socialization/skill-building support | 43/h [32] | 6 | 1.3 | 0.5 | 1 | 1 | 2 |
| Social skills training | 6 | 2.5 | 0.8 | 2 | 2 | 3 | |
| Music therapy | 5 | 0.6 | 0.5 | 0 | 1 | 1 | |
| Physical therapy | 68/h [31] | 5 | 1.4 | 0.5 | 1 | 1 | 2 |
| Play therapy | 2 | 1.0 | 0.0 | 1 | 1 | 1 | |
| Typical class | 2 | 26.0 | 12.7 | 17 | 26 | 35 | |
| Counseling/psychological services for child | 68/h [32] | 1 | 4.0 | 4 | 4 | 4 | |
| Recreational sport for child | 1 | 3.0 | 3 | 3 | 3 | ||
ABA applied behavioral analysis, SD standard deviation
Table 6. All-cause healthcare utilization among children with autism spectrum disorder, extracted from the National Database for Autism Research ID 306a.
| Children with ASD | Age <2 years | Age 2–10 years | |||||
|---|---|---|---|---|---|---|---|
|
|
|
|
|||||
| All (N = 33,565) | Male (N = 27,479) | Female (N = 6086) | Male (N = 4613) | Female (N = 996) | Male (N = 16,477) | Female (N = 3510) | |
| Age (years) [mean ± SD[ | 6.73 ± 4.93 | 6.67 ± 4.89 | 7.00 ± 5.1 | ||||
| Race/ethnicity (%) | |||||||
| White | 53.0 | ||||||
| Black | 2.1 | ||||||
| Asian | 1.4 | ||||||
| Hispanic | 4.1 | ||||||
| Other | 1.0 | ||||||
| Unknown | 38.5 | ||||||
| Annual utilization | |||||||
| Total healthcare visits (mean ± SD) | |||||||
| Office visits | 16.90 ± 24.31 | 16.74 ± 24.22 | 17.61 ± 24.72 | 20.20 ± 23.60 | 20.81 ± 22.70 | 17.49 ± 26.96 | 18.12 ± 27.78 |
| Outpatient visits | 3.73 ± 7.75 | 3.63 ± 7.63 | 4.2 ± 8.26 | 4.70 ± 7.56 | 5.10 ± 7.82 | 3.74 ± 8.36 | 4.20 ± 8.74 |
| Ambulatory (office and outpatient) visits | 20.51 ± 26.52 | 20.24 ± 26.37 | 21.69 ± 27.15 | 24.78 ± 26.2 | 25.75 ± 25.15 | 21.08 ± 29.05 | 22.20 ± 30.09 |
| Emergency department visits | 0.94 ± 3.65 | 0.94 ± 3.80 | 0.95 ± 2.88 | 1.05 ± 4.08 | 1.02 ± 2.84 | 0.9 ± 4.02 | 0.87 ± 2.83 |
| Inpatient stays | 0.10 ± 0.37 | 0.10 ± 0.35 | 0.13 ± 0.45 | 0.15 ± 3.37 | 0.17 ± 0.31 | 0.07 ± 0.29 | 0.09 ± 0.39 |
| Behavioral health visits (mean ± SD) | |||||||
| Office visits | 9.32 ± 19.21 | 9.28 ± 19.04 | 9.5 ± 19.93 | 8.80 ± 18.25 | 8.56 ± 16.32 | 10.01 ± 21.22 | 10.35 ± 22.93 |
| Outpatient visits | 1.76 ± 5.93 | 1.74 ± 5.96 | 1.82 ± 5.77 | 1.94 ± 5.2 | 1.91 ± 4.78 | 1.92 ± 6.77 | 1.96 ± 6.55 |
| Ambulatory (office and outpatient) visits | 10.98 ± 20.61 | 10.93 ± 20.46 | 11.23 ± 21.29 | 10.66 ± 19.81 | 10.38 ± 17.25 | 11.81 ± 22.70 | 12.22 ± 24.40 |
| Emergency department visits | 0.55 ± 3.31 | 0.56 ± 3.49 | 0.52 ± 2.29 | 0.54 ± 3.78 | 0.42 ± 2.07 | 0.55 ± 3.75 | 0.49 ± 2.19 |
| Inpatient stays | 0.05 ± 0.25 | 0.04 ± 0.24 | 0.05 ± 0.28 | 0.01 ± 0.07 | 0.01 ± 0.05 | 0.03 ± 0.20 | 0.04 ± 0.20 |
| Preventive care visits | 1.45 ± 1.73 | 1.39 ± 1.54 | 1.72 ± 2.38 | 2.53 ± 1.85 | 2.93 ± 3.00 | 1.18 ± 1.26 | 1.44 ± 2.02 |
| Per-member per-month | |||||||
| Medical costs (2013 $US) | 479.91 ± 1328.26 | ||||||
| Office costs | 163.30 ± 444.82 | ||||||
| Outpatient costs | 135.99 ± 310.62 | ||||||
| Ambulatory (office and outpatient) costs | 299.29 ± 563.16 | ||||||
| Emergency costs | 11.80 ± 40.74 | ||||||
| Inpatient costs | 119.37 ± 925.87 | ||||||
| Other costs | 49.46 ± 436.63 | ||||||
| Behavioral healthcare costs | 218.59 ± 772.11 | ||||||
| Pharmacy costs | 138.73 ± 311.41 | ||||||
| Total costs | 618.64 ± 1407.74 | ||||||
Information was extracted from the healthcare utilization and costs report and study data file
ASD autism spectrum disorder, SD standard deviation
Of specific interest are assessments of the incremental cost-effectiveness of new treatments and new diagnostic strategies, such as next-generation sequencing (whole-genome sequencing or whole-exome sequencing) [19] to identify genetic variants known to be associated with autism. If genomic technologies can be used as a diagnostic tool and are precise and effective to identify autism at a very young age, these toddlers could avoid a lengthy and costly diagnostic odyssey and benefit from receiving intensive behavioral intervention services earlier [20, 21]. Genomic information holds the promise of facilitating individually tailored therapies [22]. However, to date there is limited evidence on both the clinical and economic impacts of next-generation sequencing in the literature. Numerous challenges to performing economic evaluations of genomic technologies exist, including those related to the choice of comparator, perspective and time horizon, technology cost estimation, and especially linking exposure to technologies to specific outcomes [23]. NDAR could be a Big Data resource for combining individual genomic information and neurophysiological and behavioral outcomes data that eventually could be linked to cost data. These studies would provide much-needed evidence to decision makers grappling with how to translate the use of genomic diagnostic technologies into clinical practice for the treatment of autism.
4. A Roadmap for Future Research Using NDAR
Autism research has increased dramatically in the past decade from 800 peer-reviewed journal articles per year in 2003 to >3400 per year in 2012, which parallels the increased prevalence of autism [24]. The nature of autism requires a multidisciplinary team approach for assessment, diagnosis, treatment, and research because of the wide range of core deficits in social communication and repetitive and stereotyped behaviors as well as co-morbidities such as epilepsy, gastrointestinal disorders, sleep problems, and psychiatric disorders [25, 26]. Basic science research in autism has progressed remarkably, especially in neuroscience and genetics to advance an understanding of how brain structure and genes contribute to the heterogeneity of autism. There are many effective interventions that can improve core deficits and associated symptoms throughout the lifespan, such as early intensive behavioral interventions [20, 27], social skills training [28], and vocational interventions [29]. However, there is a great need to translate research from basic sciences to clinical practice [24], and HSR and HTA can play an important role in this regard.
NDAR holds high promise for data aggregation and secondary analyses of novel interventions for health services researchers as well as for evaluating new technologies and interventions to support resource allocation decisions. Additionally, the RDoC initiative [30], which focuses on bridging neuroscience and genetic approaches with behavioral neuroscience and human behavioral phenotypes, has the potential to accelerate translational research by providing dimensional traits as targets to develop new treatments and interventions that could improve longitudinal developmental trajectories for individuals with autism.
Despite many possibilities to formulate and answer research questions using NDAR, missing data is a prominent problem in previously shared studies. In addition, NDAR cannot mandate researchers to share all relevant data. Thus, the majority of projects do not share information on intervention details, cost-related to interventions, or service utilization. Researchers who desire to use NDAR require basic science and clinical background knowledge and vocabularies for a wide range of neuroscience and clinical assessment measures used in autism to enable data aggregation. Analytic skills in cloud computational systems to handle heterogeneous data are also critical. Despite some inconvenience associated with finding needed data, downloading time, and data mining and cleaning, NDAR provides rich data for the autism research community without charge. Future improvements to NDAR are expected that will greatly improve functionality for HSR to extract information on treatments or interventions provided to individuals with autism.
5. Conclusion
Big Data opportunities continue to grow. NDAR serves as a secure and rich research data repository specifically designed to promote research data sharing and collaboration for autism research. It has recently expanded to include mental illnesses and other brain disorders. All NIMH-funded researchers are currently expected to share their data through the NIMH Data Archive as a condition of their research grant support. As imagined, NDAR is growing rapidly to become a premier Big Data resource that will serve a broad community of future researchers. NDAR may be on the right path to complete what the NIH Roadmap had envisioned.
Key points for Decision Makers.
The National Database for Autism Research (NDAR) is a controlled-access, Big Data shared resource. With data on 80,000 research subjects, it is the largest biomedical data repository containing individual-level clinical assessments and outcomes from novel interventions or treatments for children with autism.
By requiring funded researchers to have a plan to share data in NDAR, it creates new Big Data opportunities for secondary analysis.
Of specific interest are health technology assessments of new treatments and new diagnostic strategies in autism. NDAR offers opportunities for generating high-quality data that can be used to assess treatments and diagnostic technology for autism.
Acknowledgments
Nalin Payakachat, J. Mick Tilford, and Wendy J. Ungar conceptualized the manuscript and prepared the final draft. We wish to thank the National Database for Autism Research (NDAR) staff, Dan Hall and Dr. Svetlana Novikova, who assisted in providing information that contributed to this manuscript.
Funding This study was supported by the National Institute of Mental Health (NIMH; Grant No. R03MH102495) with Nalin Payakachat serving as the principal investigator. The content of this article is solely the responsibility of the authors and does not necessarily represent the official views of the NIMH or the National Institutes of Health.
Footnotes
Compliance with Ethical Standards: Conflict of interest Nalin Payakachat and J. Mick Tilford serve on a grant that seeks to identify novel uses in the NDAR. Wendy J. Ungar declares no conflict of interest.
References
- 1.Zerhouni E. Medicine. The NIH Roadmap. Science. 2003;302(5642):63–72. doi: 10.1126/science.1091867. [DOI] [PubMed] [Google Scholar]
- 2.Insel TR, Volkow ND, Landis SC, Li TK, Battey JF, Sieving P. Limits to growth: why neuroscience needs large-scale science. Nat Neurosci. 2004;7(5):426–7. doi: 10.1038/nn0504-426. [DOI] [PubMed] [Google Scholar]
- 3.Westfall JM, Mold J, Fagnan L. Practice-based research–”Blue Highways” on the NIH roadmap. JAMA. 2007;297(4):403–6. doi: 10.1001/jama.297.4.403. [DOI] [PubMed] [Google Scholar]
- 4.National Institutes of Health. National Database for Autism Research (NDAR) [Accessed 23 Apr 2015]; https://ndar.nih.gov/
- 5.Hall D, Huerta M, McAuliffe M, Farber G. Sharing heterogeneous data: the National Database for Autism Research. Neuroinform. 2012;10(4):331–9. doi: 10.1007/s12021-012-9151-4. [DOI] [PMC free article] [PubMed] [Google Scholar]
- 6.Torgerson C, Quinn C, Dinov I, Liu Z, Petrosyan P, Pelphrey K, et al. Interacting with the National Database for Autism Research (NDAR) via the LONI Pipeline workflow environment. Brain Imaging Behav. 2015;9(1):89–103. doi: 10.1007/s11682-015-9354-z. [DOI] [PMC free article] [PubMed] [Google Scholar]
- 7.Di Martino A, Yan CG, Li Q, Denio E, Castellanos FX, Alaerts K, et al. The autism brain imaging data exchange: towards a large-scale evaluation of the intrinsic brain architecture in autism. Mol Psychiatry. 2014;19(6):659–67. doi: 10.1038/mp.2013.78. [DOI] [PMC free article] [PubMed] [Google Scholar]
- 8.Johnson SB, Whitney G, McAuliffe M, Wang H, McCreedy E, Rozenblit L, et al. Using global unique identifiers to link autism collections. J Am Med Inform Assoc. 2010;17(6):689–95. doi: 10.1136/jamia.2009.002063. [DOI] [PMC free article] [PubMed] [Google Scholar]
- 9.Luo XZ, Kennedy D, Cohen Z. Neuroimaging informatics tools and resources clearinghouse (NITRC) resource announcement. Neuroinform. 2009;7(1):55–6. doi: 10.1007/s12021-008-9036-8. [DOI] [PubMed] [Google Scholar]
- 10.National Institutes of Health Blueprint for Neuroscience Research. NITRC Computational Environment. [Accessed 28 Apr 2015];2015 https://aws.amazon.com/marketplace/pp/B00AW0MBLO#product-details.
- 11.Iossifov I, O'Roak BJ, Sanders SJ, Ronemus M, Krumm N, Levy D, et al. The contribution of de novo coding mutations to autism spectrum disorder. Nature. 2014;515(7526):216–21. doi: 10.1038/nature13908. [DOI] [PMC free article] [PubMed] [Google Scholar]
- 12.Supekar K, Uddin L, Khouzam A, Phillips J, Gaillard W, Ken-worthy L, et al. Brain hyperconnectivity in children with autism and its links to social deficits. Cell Rep. 2013;5(3):738–47. doi: 10.1016/j.celrep.2013.10.001. [DOI] [PMC free article] [PubMed] [Google Scholar]
- 13.Wei T, Chesnut S, Barnard-Brak L, Richman D. Psychometric analysis of the Social Communication Questionnaire using an item-response theory framework: implications for the use of the lifetime and current forms. J Psychopathol Behav Assess. 2015;37(3):469–80. [Google Scholar]
- 14.Payakachat N, Tilford JM, Kovacs E, Kuhlthau K. Autism spectrum disorders: a review of measures for clinical, health services and cost-effectiveness applications. Expert Rev Pharmacoecon Outcomes Res. 2012;12(4):485–503. doi: 10.1586/erp.12.29. [DOI] [PMC free article] [PubMed] [Google Scholar]
- 15.Payakachat N, Tilford JM, Kuhlthau KA, van Exel NJ, Kovacs E, Bellando J, et al. Predicting health utilities for children with autism spectrum disorders. Autism Res. 2014;7(6):649–63. doi: 10.1002/aur.1409. [DOI] [PMC free article] [PubMed] [Google Scholar]
- 16.Lavelle TA, Weinstein MC, Newhouse JP, Munir K, Kuhlthau KA, Prosser LA. Economic burden of childhood autism spectrum disorders. Pediatrics. 2014;133(3):e520–9. doi: 10.1542/peds.2013-0763. [DOI] [PMC free article] [PubMed] [Google Scholar]
- 17.Penner M, Rayar M, Bashir N, Roberts SW, Hancock-Howard R, Coyte P. Cost-effectiveness analysis comparing pre-diagnosis autism spectrum disorder (ASD)-targeted intervention with Ontario's Autism Intervention Program. J Autism Dev Disord. 2015;45(9):2833–47. doi: 10.1007/s10803-015-2447-0. [DOI] [PubMed] [Google Scholar]
- 18.Wang L, Mandell DS, Lawer L, Cidav Z, Leslie DL. Healthcare service use and costs for autism spectrum disorder: a comparison between medicaid and private insurance. J Autism Dev Disord. 2013;43(5):1057–64. doi: 10.1007/s10803-012-1649-y. [DOI] [PMC free article] [PubMed] [Google Scholar]
- 19.Ungar WJ. Next generation sequencing and health technology assessment in autism spectrum disorder. J Can Acad Child Adolesc Psychiatry. 2015;24(2):123–7. [PMC free article] [PubMed] [Google Scholar]
- 20.Dawson G, Rogers S, Munson J, Smith M, Winter J, Greenson J, et al. Randomized, controlled trial of an intervention for toddlers with autism: the Early Start Denver Model. Pediatrics. 2010;125(1):e17–23. doi: 10.1542/peds.2009-0958. [DOI] [PMC free article] [PubMed] [Google Scholar]
- 21.Webb SJ, Jones EJH, Kelly J, Dawson G. The motivation for very early intervention for infants at high risk for autism spectrum disorders. Int J Speech Lang Pathol. 2014;16(1):36–42. doi: 10.3109/17549507.2013.861018. [DOI] [PMC free article] [PubMed] [Google Scholar]
- 22.Ontario Personalized Medicine Network Subcommittee Report. Evaluating our current health technology assessment capabilities in light of personalized medicine technologies. [Accessed 15 Apr 2015];2013 http://www.ontariogenomics.ca/personalized-medicine/personalized-medicine-resources.
- 23.Buchanan J, Wordsworth S, Schuh A. Issues surrounding the health economic evaluation of genomic technologies. Pharmacogenomics. 2013;14(15):1833–47. doi: 10.2217/pgs.13.183. [DOI] [PMC free article] [PubMed] [Google Scholar]
- 24.Damiano CR, Mazefsky CA, White SW, Dichter GS. Future directions for research in autism spectrum disorders. J Clin Child Adolesc Psychol. 2014;43(5):828–43. doi: 10.1080/15374416.2014.945214. [DOI] [PMC free article] [PubMed] [Google Scholar]
- 25.Coury DL, Swedo SE, Thurm AE, Miller DT, Veenstra-Vanderweele JM, Carbone PS, et al. Treating the whole person with autism: the proceedings of the autism speaks national autism conference. Curr Probl Pediatr Adolesc Health Care. 2014;44:26–47. doi: 10.1016/j.cppeds.2013.12.002. [DOI] [PubMed] [Google Scholar]
- 26.Mazefsky CA, Oswald DP, Day TN, Eack SM, Minshew NJ, Lainhart JE. ASD, a psychiatric disorder, or both? Psychiatric diagnoses in adolescents with high-functioning ASD. J Clin Child Adolesc Psychol. 2012;41:516–23. doi: 10.1080/15374416.2012.686102. [DOI] [PMC free article] [PubMed] [Google Scholar]
- 27.Warren Z, McPheeters ML, Sathe N, Foss-Feig JH, Glasser A, Veenstra-Vanderweele J. A systematic review of early intensive intervention for autism spectrum disorders. Pediatrics. 2011;127(5):e1303–11. doi: 10.1542/peds.2011-0426. [DOI] [PubMed] [Google Scholar]
- 28.Reichow B, Steiner AM, Volkmar F. Cochrane review: social skills groups for people aged 6 to 21 with autism spectrum disorders (ASD) Evid Based Child Health. 2013;8:266–315. doi: 10.1002/ebch.1903. [DOI] [PubMed] [Google Scholar]
- 29.Taylor JL, McPheeters ML, Sathe NA, Dove D, Veenstra-Vanderweele J, Warren Z. A systematic review of vocational interventions for young adults with autism spectrum disorders. Pediatrics. 2012;130:531–8. doi: 10.1542/peds.2012-0682. [DOI] [PMC free article] [PubMed] [Google Scholar]
- 30.Casey BJ, Craddock N, Cuthbert BN, Hyman SE, Lee FS, Ressler KJ. DSM-5 and RDoC: progress in psychiatry research? Nat Rev Neurosci. 2013;14(11):810–4. doi: 10.1038/nrn3621. [DOI] [PMC free article] [PubMed] [Google Scholar]
- 31.Easter Seals Florida. Treasure Coast Early Steps System of Care. Palm Beach, Martin, St. Lucie, Indian River and Okee-chobee Counties: [Accessed 28 Aug 2015]. http://www.easterseals.com/florida/shared-components/document-library/tces-enrollment-packet-fy14/2014-17-tces-provider-1.pdf. [Google Scholar]
- 32.Early intervention service descriptions, billing codes and rates. Early intervention provided handbook. Illinois Department of Human Services, Community Health and Prevention, Bureau of Early Intervention. [Accessed 28 Aug 2015];2009 Sep 1; https://www.dhs.state.il.us/OneNetLibrary/27897/documents/Manuals/CHP/EI/EIServiceDescriptionManual.pdf.