

Abstract
One of the most common smoking-related diseases, chronic obstructive pulmonary disease (COPD), results from a dysregulated, multi-tissue inflammatory response to cigarette smoke. We hypothesized that systemic inflammatory signals in genome-wide blood gene expression can identify clinically important COPD-related disease subtypes, and we leveraged pre-existing gene interaction networks to guide unsupervised clustering of blood microarray expression data. Using network-informed non-negative matrix factorization, we analyzed genome-wide blood gene expression from 229 former smokers in the ECLIPSE Study, and we identified novel, clinically relevant molecular subtypes of COPD. These network-informed clusters were more stable and more strongly associated with measures of lung structure and function than clusters derived from a network-naïve approach, and they were associated with subtype-specific enrichment for inflammatory and protein catabolic pathways. These clusters were successfully reproduced in an independent sample of 135 smokers from the COPDGene Study.
Keywords: Gene expression, Smoking, Chronic obstructive pulmonary disease, Disease subtypes, Network analysis
1. Introduction
Genome-wide gene expression data have been used to develop expression signatures that reflect underlying biological processes associated with a particular disease state. Signatures for several diseases are in clinical use, but many gene expression signatures are poorly reproducible and suffer from sampling dependent instability [1,2]. While inappropriate analysis methods account for some of the poor reproducibility of published signatures [3,4], another potential cause is the presence of unrecognized biologic variability, such as occult molecular disease subtypes. Interestingly, one perspective on gene expression data is that it contains too much information, i.e. true biologic information that is nonetheless irrelevant to the disease-related processes that motivate the experimental question [5]. Recent approaches to merge or constrain genomic data with molecular interaction networks can address some of these challenges of analyzing genome-wide gene expression data.
Recently, Hofree et al. developed an approach called network-based stratification (NBS) [6], based on the graph-regularized approach of Cai et al. [7]. Hofree et al. demonstrated that integrating gene interaction network data with cancer somatic mutation data improves the identification of distinct molecular disease subtypes. The subtypes identified by this method were more predictive of clinically relevant disease outcomes than subtypes identified without network information. By simultaneously discovering molecular signatures and disease subtypes, this approach addresses the potential risk of occult disease variability as a cause of poor reproducibility of molecular disease signatures.
Chronic obstructive pulmonary disease (COPD) is a chronic lung disease that is the third leading cause of death in the United States [14]. It is characterized by irreversible lung damage caused by inhaled toxins, primarily cigarette smoke [8]. While COPD is defined by a ratio of <0.7 between the forced expiratory volume in 1 s/forced vital capacity (FEV1/FVC ratio), the smoke-induced lung damage characteristic of COPD occurs across the full spectrum of smokers, including those who do not meet the spirometric criteria for COPD [9,10]. Gene expression studies in COPD have been recently reviewed, and while there is notable heterogeneity between studies, most studies in lung tissue and peripheral blood have identified enrichment of differentially expressed genes in inflammatory pathways related to immune regulation, specifically B-cell and T-cell development and differentiation [11–13].
Like many common complex diseases, COPD is characterized by a high degree of heterogeneity. We hypothesized that applying NBS to gene expression data from peripheral blood of smokers with and without COPD would identify robust COPD-related molecular subtypes and subtype-specific expression signatures. We further hypothesized that the NBS-derived subtypes would be more robust than subtypes derived from an equivalent clustering method, non-negative matrix factorization (NMF), which does not use gene network information. Using peripheral blood gene expression from smokers with and without COPD in the ECLIPSE Study, we compared the performance of NBS and NMF in identifying clinically relevant and biologically meaningful groups of smokers and validated these results in an independent cohort of smokers from the COPDGene Study.
2. Results
The characteristics of the analyzed subjects from the ECLIPSE and COPDGene studies are shown in Supplemental Table 1. The ECLIPSE subjects included 229 former smokers, of whom 141 met the spirometric criteria for COPD and 88 were smoker controls. The COPDGene subjects consisted of 135 former and current smokers, and 76 subjects met the criteria for COPD.
2.1. Subtype identification with NMF and NBS
Probesets associated with the two major diagnostic criteria for COPD – FEV1 and FEV1/FVC in the ECLIPSE Study were considered in the clustering analysis. Of these 2719 probesets mapping to 2158 unique genes in ECLIPSE, only 328 probesets were associated with FEV1 and/or FEV1/FVC in the COPDGene expression data. The 2719 probesets were mapped to the STRING network, resulting in 1812 successfully matched probesets that were used as the input for both the NBS and NMF analyses. For both clustering approaches, the optimal number of latent factors was obtained by quantifying the stability index for each approach over a range of factors from 2–10. The stability index declined rapidly for NMF, with maximal stability for two latent factors. In contrast, the NBS approach demonstrated good stability over a wider range of factors, with maximal stability at four latent factors (Fig. 1). The subject similarity matrices for the NBS and NMF solutions with four latent factors show better clustering for the NBS solution (Fig. 2). Thus, the NBS solution for four latent factors in ECLIPSE was further analyzed.
Fig. 1.
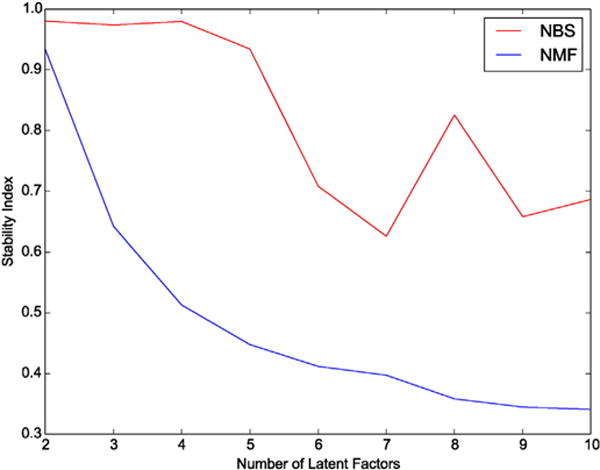
Stability of clustering results for NMF and NBS methods. The stability of clustering solutions in ECLIPSE was evaluated by the stability index over a range of latent factors from 2 to 10.
Fig. 2.
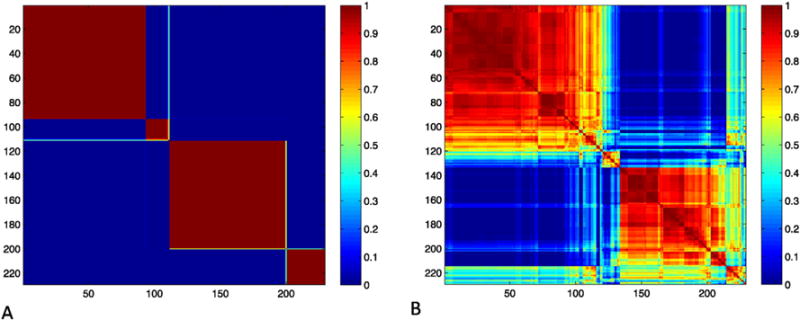
Similarity matrix of ECLIPSE NBS and NMF subtypes. The similarity matrix for ECLIPSE subjects from the NBS solution with number of latent factors equal to four demonstrates consistent cluster assignments across many random subsamples of the data (Panel A) and is more stable than the NMF solution (Panel B). Rows and columns are labeled by subject index, and the color bar indicates normalized mutual information (NMI) values per cell.
2.2. Clinical characteristics of NBS clusters
The four NBS clusters are well-differentiated by FEV1/FVC and FEV1, two measures of lung function that are used to diagnose and gauge the severity of COPD, respectively. In addition, these clusters show significant differences in the amount of emphysema and breathlessness symptoms (Table 1). Cluster 1, the “severely affected” group, is characterized by the most severe lung function impairment, respiratory symptoms, and emphysema. Cluster 2, the “moderately affected” group has intermediate levels of lung function impairment, emphysema, and respiratory symptoms. Clusters 3 and 4 are characterized by relatively preserved lung function. Cluster 3, the “less preserved lung function” group, has more emphysema, more respiratory symptoms, and a higher percentage of women than Cluster 4, the “more preserved lung function” group. Notably, there is no significant difference in smoking exposure between the groups, suggesting that biologic variability is more likely to determine these phenotypic differences than the amount of cumulative smoke exposure.
Table 1.
Clinical characteristics of NBS clusters in ECLIPSE subjects.
| N | Cluster 1
|
Cluster 2
|
Cluster 3
|
Cluster 4
|
p-Value |
|---|---|---|---|---|---|
| 29 | 89 | 93 | 18 | ||
| FEV1 (% predicted) | 49.4 (23.9) | 67.3 (32.8) | 82.2 (31.5) | 87.1 (32.3) | 2.4E–06 |
| FEV1/FVC | 0.43 (0.16) | 0.53 (0.18) | 0.63 (0.20) | 0.69 (0.21) | 9.2E–07 |
| BMI | 27.3 (5.7) | 27.6 (5.2) | 27.0 (4.5) | 28.5 (6.1) | >0.1 |
| Emphysema | 19.6 (12.9) | 12.8 (14.9) | 6.3 (14.6) | 5.5 (10.3) | 3.6E–05 |
| Age | 66.3 (6.1) | 64.9 (5.8) | 61.5 (7.4) | 61.7 (7.6) | 1.2E–03 |
| Gender, % female | 17 | 31 | 41 | 33 | >0.1 |
| Pack–years | 42 (22) | 35 (30) | 32 (30) | 32 (24) | >0.1 |
| MMRC | 1.6 (1.1) | 1.4 (1.3) | 0.8 (1.0) | 0.5 (0.7) | 5.0E–05 |
Values are mean (SD) or median (IQR) for skewed variables. p-Values are from the Kruskal–Wallis test comparing all four groups.
Emphysema defined as % of low attenuation area on chest CT (i.e. voxels < −950 Hounsfield units).
MMRC – modified Medical Research Council dyspnea score (0–4, 4 = most severe symptoms).
We sought to reproduce the NBS clusters in an independent dataset, using the cluster model learned from ECLIPSE to regenerate these clusters from COPDGene peripheral blood expression samples, and the clinical characteristics of the NBS clusters were preserved (Tables 1 and 2), whereas the NMF clusters showed limited reproducibility (Supplemental Table 2). In addition, we examined additional chest CT measures of airway wall thickness available in COPDGene, and airway wall thickness was significantly different between groups, indicating additional structural lung differences in these blood expression-derived subtypes (Table 2).
Table 2.
Clinical characteristics of NBS clusters in COPDGene.
| N | Cluster 1
|
Cluster 2
|
Cluster 3
|
Cluster 4
|
p-Value |
|---|---|---|---|---|---|
| 19 | 50 | 61 | 5 | ||
| FEV1 (% predicted) | 48.8 (27.7) | 66.7 (24.7) | 71.7 (28.7) | 87.1 (25.1) | 0.008 |
| FEV1/FVC | 0.48 (0.17) | 0.59 (0.17) | 0.63 (0.17) | 0.70 (0.17) | 0.005 |
| BMI | 29.9 (7.93) | 27.4 (5.2) | 27.6 (5.5) | 29.6 (4.9) | >0.1 |
| Emphysema | 10.1 (16.4) | 4.9 (11.2) | 1.6 (15.3) | 1.2 (3.1) | 0.10 |
| Bronchial wall thickness | 62.1 (2.6) | 61.9 (2.7) | 61.2 (2.5) | 58.8 (1.1) | 0.05 |
| Age | 66.8 (6.5) | 61.3 (8.8) | 63.9 (9.0) | 58.2 (4.5) | 0.05 |
| Gender, % female | 26 | 50 | 49 | 40 | >0.1 |
| Pack–years | 55.5 (39.5) | 38.2 (28.5) | 44.4 (34.5) | 45.0 (12.5) | >0.1 |
| MMRC | 2.6 (1.6) | 1.7 (1.4) | 1.4 (1.5) | 1.2 (1.8) | 0.02 |
| Oral steroids, % | 10.5 | 0 | 0 | 0 | 0.02 |
Values are mean (SD) or median (IQR) for skewed variables. p-Values are from the Kruskal–Wallis test comparing all four groups.
Emphysema defined as % of low attenuation area on chest CT (i.e. voxels < 950 Hounsfield units).
Bronchial wall thickness – “wall area percent”, i.e. airway wall thickness/total luminal area as measured on CT scan.
MMRC – modified Medical Research Council dyspnea score (0–4, 4 = most severe symptoms).
Oral steroids – percentage of subjects reporting use of methylprednisolone or prednisone for breathing problems at the first study visit.
2.3. Subtype-specific biologic pathway enrichment and protein biomarker associations
The subtype-specific gene expression signatures of the four NBS clusters were examined for Gene Ontology (GO) enrichment of known biological processes; strong enrichment of functional pathways was observed (Supplemental Table 3). The severely affected group demonstrated enrichment for wound healing and inflammatory processes. The moderately affected group showed strong enrichment for cytoskeletal and actin filament organization. The two preserved lung function groups showed differing patterns of enrichment for protein catabolism and ubiquitination (less preserved lung function group) and lymphocyte activation and protein synthesis (more preserved lung function group). While each cluster differed in the most strongly enriched biological processes, there was overlap in biological process enrichment across clusters (Supplemental Tables 4–7).
To determine the relative up and down-regulation of these processes within each subtype, we performed differential expression analysis for the 137 constituent genes from enriched GO categories for each of six possible contrasts between the four subtypes in both ECLIPSE and COPDGene, and the number of differentially expressed genes that reached significance (multiple comparison adjusted p-value ≤ 0.05) in both cohorts ranged from 12 to 99. These analyses confirmed the GO enrichment results and demonstrated that 1) the severely affected cluster was characterized by up-regulation of wound-healing pathways and down-regulation of lymphocyte differentiation genes (Supplemental Tables 8–10); 2) the moderately affected cluster showed up-regulation of cytoskeletal organization genes (Supplemental Tables 8, 11, and 12); and 3) the two healthier groups (less and more preserved lung function) showed up-regulation of both protein degradation and lymphocyte activation pathways (Supplemental Tables 9, 10–13).
To determine whether the constituent genes of these GO biological processes are enriched for responses to smoking exposure in blood and lung tissues, we downloaded GEO data from four datasets representing smoke-exposure experiments in PBMCs, trachea, and bronchial epithelium, and Supplemental Tables 14 through 16 demonstrate clear enrichment of smoke-responsive genes in this gene set in blood (n = 17) and tracheal epithelium (n = 71), with fewer significant smoking associations in small airway (n = 2) and bronchial epithelium (n = 0).
Gene set enrichment analysis (GSEA) was performed to provide a complementary functional assessment to the GO functional enrichment analysis. The gene expression profiles for ECLIPSE NBS subtypes were compared for each set of subtype pairs, and gene sets from the MSigDB Hallmark gene set collection were evaluated for enrichment. Supplemental Table 17 lists the nine gene sets enriched in these subtype-specific comparisons at the GSEA website suggested permutation q-value threshold of 0.25, including inflammatory (IL6–JAK–STAT signaling, q-value = 0.09) and protein catabolic pathways (unfolded protein response, q-value = 0.24). Enrichment of the IL6–JAK–STAT pathway is corroborated by significantly higher levels of serum IL-6 in subtypes with more severe disease compared to less severely affected subtypes (Fig. 3, Table 3).
Fig. 3.
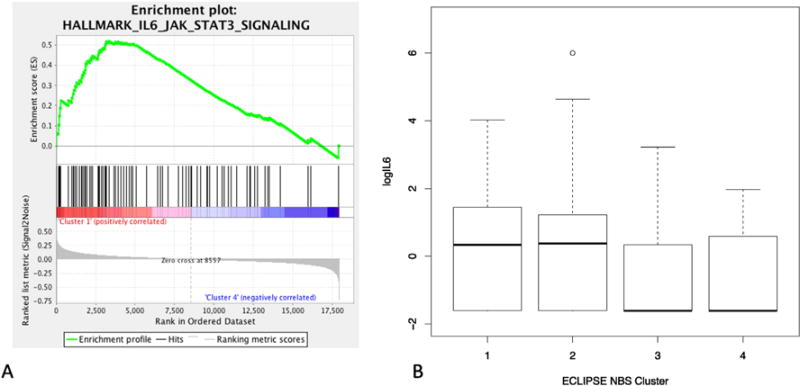
Serum IL6 levels by NBS subtype. Gene set enrichment analysis demonstrates enrichment of IL6–JAK–STAT3 signaling genes (Panel A). Boxplots of the log of IL6 levels are shown by subtype, with elevated IL6 levels present in the two most severely affected subgroups (Panel B). The Kruskal–Wallis non-parametric p-value for difference across subgroups is 1.3 × 10⁻³, and Mann–Whitney pairwise comparisons are significant for Cluster 1 versus Clusters 3 and 4 (p = 1 × 10⁻⁴ and 2 × 10⁻⁵, respectively) and for Cluster 2 versus Clusters 3 and 4 (p = 0.004 and 0.001, respectively).
Table 3.
Cell count composition and protein biomarkers for ECLIPSE NBS clusters.
| N | Cluster 1
|
Cluster 2
|
Cluster 3
|
Cluster 4
|
p-Value |
|---|---|---|---|---|---|
| 29 | 89 | 93 | 18 | ||
| Neutrophil, % | 72.7 (6.2) | 64.5 (7.5) | 59.4 (7.1) | 55.8 (6.1) | 3.4E−15 |
| Lymphocyte, % | 17.5 (4.7) | 25.7 (7.4) | 31 (6.1) | 34.0 (7.0) | 1.3E−18 |
| Monocyte, % | 7.2 (2.2) | 6.1 (2.0) | 6.4 (2.0) | 6.8 (2.7) | >0.1 |
| Eosinophil, % | 2.4 (1.8) | 3.4 (2.2) | 2.9 (1.4) | 3.0 (1.8) | 4.0E−02 |
| Basophil, % | 0.3 (0.2) | 0.3 (0.2) | 0.3 (0.2) | 0.3 (0.2) | >0.1 |
| CC16 | 6.0 (3.3) | 5.9 (3.3) | 6.1 (3.6) | 6.3 (2.2) | >0.1 |
| CRP | 4.8 (8.2) | 3.3 (4.7) | 1.7 (3.1) | 1.8 (2.3) | 5.3E−03 |
| Fibrinogen | 471.0 (119.0) | 447.0 (102.5) | 425.0 (100.0) | 366.0 (104.0) | 2.7E−04 |
| IL8 | 6.8 (5.3) | 8.4 (6.9) | 7.7 (6.7) | 7.0 (6.0) | >0.1 |
| IL6 | 1.4 (4.0) | 1.4 (3.2) | 0.2 (1.2) | 0.2 (1.6) | 1.3E−03 |
| CCL18 | 119.9 (43.3) | 105.5 (44.3) | 92.6 (51.6) | 113.8 (44.4) | 1.9E−02 |
| SPD | 105.2 (69.2) | 102.9 (68.9) | 95.6 (66.7) | 97.9 (53.4) | >0.1 |
p-Values from the Kruskal–Wallis test. Mean (standard deviation) or median (IQR) is shown for each variable in each cluster.
CC16 = Club cell protein.
CRP = C-reactive protein.
SPD = surfactant protein D.
To assess for network rewiring across subtypes, we selected one enriched biological process from each subtype and examined the correlation pattern of the genes comprising these four processes within each subtype. As shown in Fig. 4, the correlation pattern for these genes was markedly different across subtypes, and there is a high level of crosstalk between processes, particularly in the “severely affected” and “more preserved lung function” subgroups, suggesting that these subtypes result from the interplay of multiple biological processes. To determine how preserved the correlation patterns were in the replication dataset, we examined the consistency of direction in COPDGene for correlations observed with an absolute value greater than or equal to 0.75 in ECLIPSE. Three subtypes (severely affected, moderately affected, and the less preserved lung function group) showed consistent correlation direction in both datasets (binomial p-values 1.9 × 10⁻⁶, 0.01, and 0.01, respectively), whereas the more preserved subtype, which only had 5 assigned subjects in the COPDGene data, did not show a consistent direction of effects (p-value 0.52).
Fig. 4.
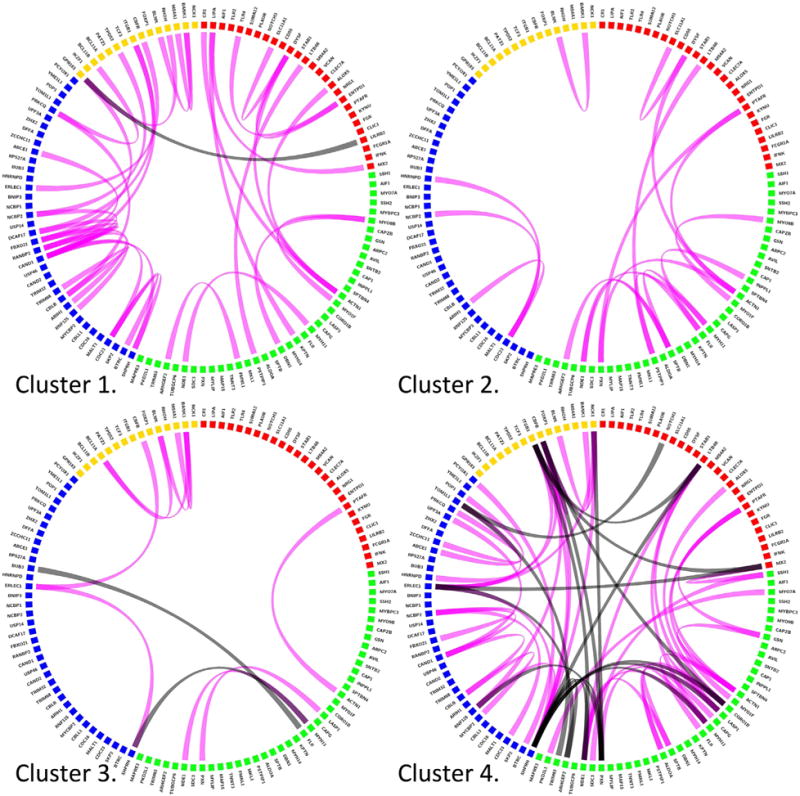
Network re-wiring by subtype. The NBS procedure identifies representative expression signatures for each molecular subtype, and signature genes for four biological processes enriched in this signatures are shown above (red = inflammation/wound healing, actin binding = green, protein catabolism = blue, lymphocyte activation = yellow) for NBS clusters. Genes with Pearson correlation ≥0.75 are connected by magenta lines, negative correlations ≤−0.75 are shown in black. The most severely impaired and the healthiest cluster show the strongest patterns of correlation within and across functional gene modules. Extensive between module correlation is present, suggesting crosstalk between functional modules. (For interpretation of the references to colors in this figure legend, the reader is referred to the web version of this article.)
We also examined the relationships between subtypes, peripheral blood differential cell count composition, and serum levels of a panel of inflammatory protein biomarkers. Table 3 demonstrates that the proportion of distinct blood cell populations differed by NBS subtype. To determine the extent to which subtype-specific expression signatures were driven by the cell population differences, we used subject-level cell population percentages to predict subtype membership, and the estimated classification error rate was 48.9%, indicating that cell type composition alone could not be used to accurately reproduce subtype membership. Table 3 also demonstrates significant differences by subtype in blood levels for C-reactive protein (CRP), fibrinogen, interleukin-6 (IL-6), and Club cell protein (CC16).
3. Discussion
We applied a recently developed network-based stratification approach to identify cluster-specific peripheral blood gene expression signatures from former smokers that are associated with measures of lung structure and function. Replication of these clusters in independent data demonstrates that the clinical characteristics of these blood-expression defined subtypes are robust. They are enriched for multiple biological processes, and the genes comprising these processes are enriched for smoking-related transcriptional responses in independent blood and lung gene expression datasets. By comparing NBS to NMF, we demonstrate that clustering informed by a gene interaction network (NBS) can produce more reproducible and clinically meaningful clusters than a comparable non-network informed method (NMF).
Gene interaction networks have been used previously to identify molecular disease subtypes. Hofree et al. used gene interaction network constraints to identify molecular subtypes in cancer, though their approach used somatic mutation data from paired tumor and “normal” tissues [6]. While we adopt the concept of using gene interaction network constraints, our focus on gene expression leads to important differences in methodology. First, we do not use the concept of network diffusion to propagate gene effects through the interaction network, as gene expression data is not sparse. Second, whereas paired tumor and normal samples naturally separate disease-causing mutations from background mutations, gene expression data requires a similar filtering step to select genes associated with disease processes, and we achieve this selection through standard differential expression analysis prior to clustering in the training data. Thus, our data extends the observations of Hofree et al. by demonstrating: 1) the utility of network-based constraints for gene expression data; and 2) the successful application of this approach to COPD, a non-cancerous, multi-tissue disease in which blood expression likely reflects systemic, rather than local tissue, effects.
This study demonstrates independent replication of subtypes and subtype-specific expression signatures. While NBS yielded clinically relevant COPD subtypes that could be robustly re-produced in an independent sample, NMF did not yield similarly robust solutions.
While the agreement in gene-level association with FEV1 and FEV1/FVC was modest across cohorts, the clinical characteristics of the expression-derived subtypes were very similar. We propose two reasons for this discrepancy. First, subject-level classifications may be more stable than ranked gene lists, because subtype assignments may be more robust to redundancy in gene functional pathways. Second, simultaneous discovery of subtypes and molecular signatures may capture underlying disease heterogeneity that would otherwise confound differential expression analysis. At the level of clinical translation, these data indicate that stable clinical classifications for smoking-related lung disease based on blood expression data are feasible. To our knowledge this is the first demonstration of independently replicated expression signatures in blood for smoking-related lung disease. Of note, a lung COPD expression signature has been previously reported to be replicated in an independent sample with 97% prediction accuracy [15]. However, in that study, class discovery was repeated in the replication sample as opposed to the approach used in this analysis where all key model parameters were learned in the training data and directly transferred to the replication set. The latter approach provides a more stringent assessment of generalizability [4,16].
The biological relevance of these subtype-specific expression signatures is supported by strong enrichment in known functional pathways observed in our data. Particularly enriched processes included lymphocyte differentiation, wound healing, actin and cytoskeletal organization, and protein catabolism and ubiquitination. While certain processes were most enriched in specific disease subtypes, there was also notable overlap in processes across subtypes. Compared to previous blood expression studies in smokers with and without COPD, the role of inflammatory responses is consistent with previous findings [11]. Prior histologic studies of lung tissue from smokers with COPD demonstrate increased presence of multiple inflammatory cell sub-populations in emphysematous lungs [17,18] and various aspects of the role of innate and adaptive immunity in response to cigarette smoke have been demonstrated by multiple groups [19]. The enrichment of protein catabolic pathways is consistent with smoke-exposure studies in alveolar cells that have demonstrated increased endoplasmic reticulum stress and protein degradation [20]. The role of actin and cytoskeletal processes in response to smoking is less well understood, but cytoskeletal-associated pathways containing genes such as ACTN1 and DBN1 have been associated with roles in immune cell activation [21] and columnar epithelial cell function [22]. These data point to further avenues for investigation of the specific nature of inflammatory, catabolic, and cytoskeletal responses in circulating immune cells in smokers.
The limitations of this study are that the sample size, while larger than many previous smoking-related gene expression studies, may still preclude the discovery of low prevalence smoking-related subtypes. The cellular composition of the blood samples from ECLIPSE and COPDGene are not identical, as ECLIPSE samples were from whole blood whereas the COPDGene samples consisted of peripheral blood mononuclear cells. Despite this difference, good replication of the clinical subtype associations was observed. We considered the possibility that the heterogeneous cellular composition of the samples used for this study drove the differential expression and subtyping results. However, prediction of subtype membership using cell count differentials was poor, suggesting that in our data, while the composition of sub-populations of circulating immune cells contributes to the overall expression profile, subtype assignments are largely determined by information independent of cell-type composition. However, it is possible that finer-grained differences in cell subpopulations play an important role in determining global blood expression patterns. In evaluating the NBS and NMF results, we selected the NBS result for further investigation because of its superior stability characteristics; however, in other contexts it is possible that NMF may have superior performance.
It is highly likely that disease-relevant gene expression data is contained in many non-blood related tissues, particular lung and airway tissue samples. Other groups have previously reported the identification of distinct groups of subjects based on airway and lung tissue gene expression [23]. While lung expression data is clearly of interest for COPD, our data indicate that meaningful information is also present in blood and that there is partial overlap in the biological signal present in these tissues.
In conclusion, we have demonstrated the utility of a modified application of NBS for simultaneous disease subtype and gene signature identification in blood gene expression data from two independent cohorts enriched for a chronic, non-cancerous lung disease, COPD. Identification of a robust, blood-based expression signature for COPD subtypes provides useful insight into the disease-associated biological pathways active in circulating blood cells, confirms the relevance and reliability of this source of biological information for COPD-related disease subtyping, and identifies subtype-specific candidate therapeutic targets. Future work is needed to address the question of whether blood expression combined with phenotypic data may be relevant for subtype-specific clinical treatment and precision medicine.
4. Methods
4.1. Study subjects
The ECLIPSE (Evaluation of COPD Longitudinally to Identify Predictive Surrogate Endpoints) Study is a longitudinal study with three-year follow-up data available for 2501 smoking subjects (2164 subjects with COPD and 337 smoking controls). The detailed study protocol and inclusion criteria have been previously published [24]. ECLIPSE included subjects with COPD (defined by FEV1 < 80% of predicted and FEV1/FVC ≤ 0.7, and also included smokers without COPD (FEV1 > 85% and FEV1/FVC > 0.7). For this analysis, we analyzed all available subjects (both COPD cases and smoking controls) from a subset of the ECLIPSE Study with genome-wide blood gene expression data generated on the Affymetrix Human U133 Plus2 chip passing quality control (n = 229) [25].
COPDGene is a multicenter, longitudinal study designed to investigate the genetic and epidemiologic characteristics of COPD and other smoking-related lung diseases. The design of the study has been reported previously [26]. Briefly, 10,192 smokers with a wide range of lung function were recruited into the COPDGene Study from 2007 to 2011. Non-Hispanic white (NHW) and African-American (AA) subjects between the ages of 45 and 80 with at least a 10 pack–year smoking history were enrolled. For this analysis, all subjects with genome-wide gene expression data obtained with the Affymetrix Human U133 Plus2 chip passing quality control (n = 135) were analyzed [13]. For both COPDGene and ECLIPSE, the institutional review boards of all participating centers approved these studies, and written informed consent was obtained from all subjects.
4.2. Gene expression and plasma biomarker measurements
Sample preparation and quality control procedures for genome-wide gene expression data have been previously described for the ECLIPSE [25] and COPDGene subjects [13]. Briefly, gene expression was derived from whole blood samples in ECLIPSE subjects and peripheral blood mononuclear cells (PBMCs) for the COPDGene subjects. Gene expression profiling was performed using the Affymetrix Human U133 Plus2 array. Gene expression data were log-transformed, and background correction and normalization were performed for the merged ECLIPSE and COPDGene samples using robust multi-array averaging and quantile normalization as implemented in the affy Bioconductor package [27]. Of the 136 COPDGene subjects reported in a previous publication [13], one self-reported African-American subject was removed from the analysis, which was conducted on the remaining 135 non-Hispanic white subjects. Gene expression data are available in GEO (GSE76705).
Sample preparation and quality control measurement for a panel of biomarkers in the ECLIPSE Study have been previously reported [28]. Seven biomarkers were analyzed without transformation and tested for between subtype differences using the Kruskal–Wallis non-parametric test.
4.3. Subtype identification
To identify a set of genes associated with COPD, we performed differential expression analysis for 38,519 probesets in ECLIPSE that passed quality control measures. Normalized probeset intensities were related to measures indicative of two primary dimensions of pulmonary impairment in COPD – airway obstruction as indicated by two measures of spirometric lung function (FEV1 (% of predicted) and FEV1/FVC) and lung parenchymal destruction, i.e., emphysema (as quantified by the percentage of low attenuation area less than −950 Hounsfield units on lung computed tomography, %LAA-950). The analysis was conducted using the limma Bioconductor package, and the false discovery rate was controlled at 5%. The following covariates were included in the differential expression analysis – age, pack-years of cigarette smoke exposure, and gender.
After standardizing gene expression data from 229 ECLIPSE subjects by the variance of each probeset, we applied NMF [29] and NBS [6] to identify meta-patients (i.e. subtypes or subject clusters) and meta-genes (i.e. representative subtype expression profiles). We consider a gene expression data matrix X∈ℝd×n, where d is the number of probes and n is the number of patients. Our goal is to find a small set of metagenes W∈ℝd q, where each column of W is expected to represent the expression profile of one disease subtype, such that each patient’s gene expression profile can be decomposed into a non-negative linear combination of meta-genes. To achieve that goal, non-negative matrix factorization (NMF) can be applied to factorize the gene expression data matrix X into the product of the meta-gene matrix W and the coefficient matrix H∈ℝq×n. Each patient is assigned to the meta-gene associated with the largest coefficient. It has been shown that NMF outperforms hierarchical clustering and self-organizing maps in discovering meaningful biological information from cancer-related microarray data [29]. Based on NMF, network-based stratification (NBS) adds the constraint that two genes should have similar values in meta-gene matrix W if they have strong interaction in the gene interaction network. Since matrix factorization can only achieve local optima, consensus clustering was applied to overcome the randomness of a single run. The stability index, which ranges from 0 (low stability) to 1 (high stability) was used to select an appropriate number of meta-genes [30]. The STRING gene interaction network was filtered to select only those interactions in the highest decile of predicted interaction confidence.
4.4. Phenotypic assessment
Methods for performing spirometric and CT measurements of emphysema and airway wall thickness have been previously described for ECLIPSE [31] and COPDGene [26]. In both studies, post-bronchodilator spirometric measures were used. The relationship of clinical characteristics to subtypes was assessed by the Kruskal–Wallis test. To determine the extent to which subtype-specific expression patterns were driven by differences in cell populations, we used cell count differentials (neutrophil, lymphocyte, monocyte, eosinophil, and basophil counts) to predict subtype membership with supervised random forests and assessed the prediction accuracy by cross-validation in the ECLIPSE dataset.
4.5. Gene ontology enrichment analysis
The DAVID gene ontology enrichment tool was used to quantify pathway enrichment of the gene lists comprising the subtype-specific signatures [32], using all probesets on the Affymetrix Human U133 Plus2 chip as background. Enrichment analysis was performed using medium stringency clustering of annotated pathways [33] using the following reference data sources: GO biological process and molecular function categories [34], Cluster of Orthologous Groups Ontology [35], Protein Information Resource keywords [36], Uniprot Sequence Features [37], BBID (Biological Biochemical Image Database) [38], Biocarta [39], and KEGG pathways [40]. Clustered pathway enrichment was quantified via the EASE score [41].
4.6. Assessing smoke response in GO enriched genes
Four datasets from three studies were downloaded from GEO (GSE13933 with trachea and small airway samples, GSE994, and GSE12587); phenotypic data were reviewed in detail, and contrasts were performed using limma, comparing non-smoking to smoking samples and adjusting for race and paired samples when appropriate. FDR q-values were calculated using the approach of Storey et al. [42].
4.7. Gene set enrichment analysis
Gene set enrichment analysis was performed for all pairwise contrasts between the four NBS subtypes in ECLIPSE [43,44]. The 50 Hallmark gene sets from the MSigDB database formed our query gene sets, and significance was determined by a q-value of 0.25 or less based on 1000 phenotype permutations, as recommended on the GSEA website (http://www.broadinstitute.org/gsea/index.jsp).
4.8. Visualization of subtype-specific gene correlation networks
For four gene sets from the DAVID analysis, the Pearson correlation matrix for the corresponding probeset expression values was calculated within each subtype, and the subtype-specific correlation patterns for each gene set were visualized using Circos software [45], with a Pearson correlation absolute value threshold of 0.75.
4.9. Reproducing clusters in COPDGene
To assess the generalizability of the meta-gene matrix W learned from ECLIPSE data, we transferred these meta-genes to the COPDGene cohort for clustering. The gene expression data of each COPDGene patient was factorized into a non-negative linear combination of the meta-genes learned in ECLIPSE. Each patient is assigned to the meta-gene associated with the largest coefficient in the same manner as the ECLIPSE clustering.
Supplementary Material
Acknowledgments
This work was supported by the U.S. National Institutes of Health (NIH) grants K08HL102265 and R01HL124233 (Castaldi), K08HL097029 (Cho), P01HL105339 (Silverman), R01HL111759 (Silverman), R01HL089897 (Crapo) and R01HL089856 (Silverman). The content is solely the responsibility of the authors and does not necessarily represent the official views of the National Institutes of Health. The COPDGene® project is also supported by the COPD Foundation through contributions made to an Industry Advisory Board comprised of AstraZeneca, Boehringer Ingelheim, Novartis, Pfizer, GSK, Siemens and Sunovion. The ECLIPSE Study was sponsored by GSK (NCT00292552).
Footnotes
Supplementary data to this article can be found online at http://dx.doi.org/10.1016/j.ygeno.2016.01.004.
Author contributions
Study design: YC, PJC, EKS, JD, MHC. Data acquisition: EKS, RB, JC, RTS. Data Analysis: YC, PJC, JD, MHC, KG, YYL. Critical revision of manuscript: all authors.
Conflict of interest
R.T.-S. is a current employee of GlaxoSmithKline. E.K.S. has received grant support from GlaxoSmithKline for studies of COPD genetics and honoraria and consulting fees from AstraZeneca.
References
- 1.Michiels S, Koscielny S, Hill C. Prediction of cancer outcome with microarrays: a multiple random validation strategy. Lancet. 2005;365:488–492. doi: 10.1016/S0140-6736(05)17866-0. http://dx.doi.org/10.1016/S0140-6736(05)17866-0. [DOI] [PubMed] [Google Scholar]
- 2.Allison DB, Cui X, Page GP, Sabripour M. Microarray data analysis: from disarray to consolidation and consensus. Nat Rev Genet. 2006;7:55–65. doi: 10.1038/nrg1749. http://dx.doi.org/10.1038/nrg1749. [DOI] [PubMed] [Google Scholar]
- 3.Dupuy A, Simon RM. Critical review of published microarray studies for cancer outcome and guidelines on statistical analysis and reporting. J Natl Cancer Inst. 2007;99:147–157. doi: 10.1093/jnci/djk018. http://dx.doi.org/10.1093/jnci/djk018. [DOI] [PubMed] [Google Scholar]
- 4.Castaldi PJ, Dahabreh IJ, Ioannidis JPA. An empirical assessment of validation practices for molecular classifiers. Brief Bioinform. 2011;12:189–202. doi: 10.1093/bib/bbq073. http://dx.doi.org/10.1093/bib/bbq073. [DOI] [PMC free article] [PubMed] [Google Scholar]
- 5.Venet D, Dumont JE, Detours V. Most random gene expression signatures are significantly associated with breast cancer outcome. PLoS Comput Biol. 2011;7:e1002240. doi: 10.1371/journal.pcbi.1002240. http://dx.doi.org/10.1371/journal.pcbi.1002240. [DOI] [PMC free article] [PubMed] [Google Scholar]
- 6.Hofree M, Ideker TG, Shen JP, Carter H, Gross A. Network-based stratification of tumor mutations. Nat Methods. 2013;10:1108–1115. doi: 10.1038/nmeth.2651. http://dx.doi.org/10.1038/nmeth.2651. [DOI] [PMC free article] [PubMed] [Google Scholar]
- 7.Cai D, He X, Wu X, Han J. Non-negative Matrix Factorization on Manifold, 2008, Eighth IEEE International Conference on Data Mining (ICDM) 2008:63–72. http://dx.doi.org/10.1109/ICDM.2008.57.
- 8.Vestbo J, Sin DD, Hurd SS, Agustí AGN, Jones PW, Vogelmeier C, et al. Global strategy for the diagnosis, management, and prevention of chronic obstructive pulmonary disease: GOLD executive summary. Am J Respir Crit Care Med. 2013;187:347–365. doi: 10.1164/rccm.201204-0596PP. http://dx.doi.org/10.1164/rccm.201204-0596PP. [DOI] [PubMed] [Google Scholar]
- 9.Wan ES, Hokanson JE, Murphy JR, Regan EA, Make BJ, Lynch DA, et al. Clinical and radiographic predictors of GOLD-unclassified smokers in the COPDGene study. Am J Respir Crit Care Med. 2011;184:57–63. doi: 10.1164/rccm.201101-0021OC. http://dx.doi.org/10.1164/rccm.201101-0021OC. [DOI] [PMC free article] [PubMed] [Google Scholar]
- 10.Regan EA, Lynch DA, Curran-Everett D, Curtis JL, Austin JHM, Grenier PA, et al. Clinical and radiologic disease in smokers with normal spirometry. JAMA Intern Med. 2015;175:1539–1549. doi: 10.1001/jamainternmed.2015.2735. http://dx.doi.org/10.1001/jamainternmed.2015.2735. [DOI] [PMC free article] [PubMed] [Google Scholar]
- 11.Hobbs BD, Hersh CP. Integrative genomics of chronic obstructive pulmonary disease. Biochem Biophys Res Commun. 2014;452:276–286. doi: 10.1016/j.bbrc.2014.07.086. http://dx.doi.org/10.1016/j.bbrc.2014.07.086. [DOI] [PMC free article] [PubMed] [Google Scholar]
- 12.Campbell JD, McDonough JE, Zeskind JE, Hackett TL, Pechkovsky DV, Brandsma CA, et al. A gene expression signature of emphysema-related lung destruction and its reversal by the tripeptide GHK. Genome Med. 2012;4:67. doi: 10.1186/gm367. http://dx.doi.org/10.1186/gm367. [DOI] [PMC free article] [PubMed] [Google Scholar]
- 13.Bahr TM, Hughes GJ, Armstrong M, Reisdorph R, Coldren CD, Edwards MG, et al. Peripheral blood mononuclear cell gene expression in chronic obstructive pulmonary disease. Am J Respir Cell Mol Biol. 2013;49:316–323. doi: 10.1165/rcmb.2012-0230OC. http://dx.doi.org/10.1165/rcmb.2012-0230OC. [DOI] [PMC free article] [PubMed] [Google Scholar]
- 14.Miniño AM, Murphy SL. Death in the United States, 2010. NCHS Data Brief. 2012 [PubMed] [Google Scholar]
- 15.Bhattacharya S, Silverman E, Srisuma S, Demeo DL, Shapiro SD, Bueno R, et al. Molecular biomarkers for quantitative and discrete COPD phenotypes. Am J Respir Cell Mol Biol. 2009;40:359–367. doi: 10.1165/rcmb.2008-0114OC. http://dx.doi.org/10.1165/rcmb.2008-0114OC. [DOI] [PMC free article] [PubMed] [Google Scholar]
- 16.Simon RM. Roadmap for developing and validating therapeutically relevant genomic classifiers. J Clin Oncol. 2005;23:7332–7341. doi: 10.1200/JCO.2005.02.8712. http://dx.doi.org/10.1200/JCO.2005.02.8712. [DOI] [PubMed] [Google Scholar]
- 17.Retamales I, Elliott WM, Meshi B, Coxson HO, Paré PD, Sciurba FC, et al. Amplification of inflammation in emphysema and its association with latent adenoviral infection. Am J Respir Crit Care Med. 2001;164:469–473. doi: 10.1164/ajrccm.164.3.2007149. http://dx.doi.org/10.1164/ajrccm.164.3.2007149. [DOI] [PubMed] [Google Scholar]
- 18.Hogg JC, Chu F, Utokaparch S, Woods R, Elliott WM, Buzatu L, et al. The nature of small-airway obstruction in chronic obstructive pulmonary disease. N Engl J Med. 2004;350:2645–2653. doi: 10.1056/NEJMoa032158. http://dx.doi.org/10.1056/NEJMoa032158. [DOI] [PubMed] [Google Scholar]
- 19.Shapiro SD. End-stage chronic obstructive pulmonary disease: the cigarette is burned out but inflammation rages on. Am J Respir Crit Care Med. 2001;164:339–340. doi: 10.1164/ajrccm.164.3.2105072c. http://dx.doi.org/10.1164/ajrccm.164.3.2105072c. [DOI] [PubMed] [Google Scholar]
- 20.Somborac-Bacura A, van der Toorn M, Franciosi L, Slebos DJ, Zanic-Grubisic T, Bischoff R, et al. Cigarette smoke induces endoplasmic reticulum stress response and proteasomal dysfunction in human alveolar epithelial cells. Exp Physiol. 2013;98:316–325. doi: 10.1113/expphysiol.2012.067249. http://dx.doi.org/10.1113/expphysiol.2012.067249. [DOI] [PubMed] [Google Scholar]
- 21.Gordón-Alonso M, Sala-Valdés M, Rocha-Perugini V, Pérez-Hernández D, López-Martín S, Ursa A, et al. EWI-2 association with α-actinin regulates T cell immune synapses and HIV viral infection. J Immunol. 2012;189:689–700. doi: 10.4049/jimmunol.1103708. http://dx.doi.org/10.4049/jimmunol.1103708. [DOI] [PubMed] [Google Scholar]
- 22.Bazellières E, Massey-Harroche D, Barthélémy-Requin M, Richard F, Arsanto JP, Le Bivic A. Apico-basal elongation requires a drebrin-E–EB3 complex in columnar human epithelial cells. J Cell Sci. 2012;125:919–931. doi: 10.1242/jcs.092676. http://dx.doi.org/10.1242/jcs.092676. [DOI] [PubMed] [Google Scholar]
- 23.Steiling K, Spira A, Paré PD, van den Berge M, Hijazi K, Florido R, et al. A dynamic bronchial airway gene expression signature of chronic obstructive pulmonary disease and lung function impairment. Am J Respir Crit Care Med. 2013;187:933–942. doi: 10.1164/rccm.201208-1449OC. http://dx.doi.org/10.1164/rccm.201208-1449OC. [DOI] [PMC free article] [PubMed] [Google Scholar]
- 24.Vestbo J, Anderson W, Coxson HO, Crim C, Dawber F, Edwards L, et al. Evaluation of COPD Longitudinally to Identify Predictive Surrogate End-points (ECLIPSE) Eur Respir J. 2008;31:869–873. doi: 10.1183/09031936.00111707. http://dx.doi.org/10.1183/09031936.00111707. [DOI] [PubMed] [Google Scholar]
- 25.Singh D, Fox SM, Tal-Singer R, Bates S, Riley JH, Celli B. Altered gene expression in blood and sputum in COPD frequent exacerbators in the ECLIPSE cohort. PLoS ONE. 2014;9:e107381. doi: 10.1371/journal.pone.0107381. http://dx.doi.org/10.1371/journal.pone.0107381. [DOI] [PMC free article] [PubMed] [Google Scholar]
- 26.Regan EA, Silverman E, Hokanson JE, Murphy JR, Make B, Lynch DA, et al. Genetic epidemiology of COPD (COPDGene) study design, COPD. 2010;7:32–43. doi: 10.3109/15412550903499522. http://dx.doi.org/10.3109/15412550903499522. [DOI] [PMC free article] [PubMed] [Google Scholar]
- 27.Gautier L, Cope L, Bolstad BM, Irizarry RA. affy–analysis of Affymetrix GeneChip data at the probe level. Bioinformatics. 2004;20:307–315. doi: 10.1093/bioinformatics/btg405. http://dx.doi.org/10.1093/bioinformatics/btg405. [DOI] [PubMed] [Google Scholar]
- 28.Celli BR, Locantore N, Yates J, Tal-Singer R, Miller BE, Bakke P, et al. Inflammatory biomarkers improve clinical prediction of mortality in chronic obstructive pulmonary disease. Am J Respir Crit Care Med. 2012;185:1065–1072. doi: 10.1164/rccm.201110-1792OC. http://dx.doi.org/10.1164/rccm.201110-1792OC. [DOI] [PubMed] [Google Scholar]
- 29.Brunet J-P, Tamayo P, Golub TR, Mesirov JP. Metagenes and molecular pattern discovery using matrix factorization. Proc Natl Acad Sci U S A. 2004;101:4164–4169. doi: 10.1073/pnas.0308531101. http://dx.doi.org/10.1073/pnas.0308531101. [DOI] [PMC free article] [PubMed] [Google Scholar]
- 30.Lange T, Roth V, Braun ML, Buhmann JM. Stability-based validation of clustering solutions. Neural Comput. 2004;16:1299–1323. doi: 10.1162/089976604773717621. http://dx.doi.org/10.1162/089976604773717621. [DOI] [PubMed] [Google Scholar]
- 31.Agustí AGN, Calverley PMA, Celli B, Coxson HO, Edwards LD, Lomas DA, et al. Characterisation of COPD heterogeneity in the ECLIPSE cohort. Respir Res. 2010;11:122. doi: 10.1186/1465-9921-11-122. http://dx.doi.org/10.1186/1465-9921-11-122. [DOI] [PMC free article] [PubMed] [Google Scholar]
- 32.Huang DW, Sherman BT, Lempicki RA. Systematic and integrative analysis of large gene lists using DAVID bioinformatics resources. Nat Protoc. 2009;4:44–57. doi: 10.1038/nprot.2008.211. http://dx.doi.org/10.1038/nprot.2008.211. [DOI] [PubMed] [Google Scholar]
- 33.Huang DW, Sherman BT, Tan Q, Collins JR, Alvord WG, Roayaei J, et al. The DAVID Gene Functional Classification Tool: a novel biological module-centric algorithm to functionally analyze large gene lists. Genome Biol. 2007;8:R183. doi: 10.1186/gb-2007-8-9-r183. http://dx.doi.org/10.1186/gb-2007-8-9-r183. [DOI] [PMC free article] [PubMed] [Google Scholar]
- 34.Harris MA, Clark J, Ireland A, Lomax J, Ashburner M, Foulger R, et al. The Gene Ontology (GO) database and informatics resource. Nucleic Acids Res. 2004;32:D258–D261. doi: 10.1093/nar/gkh036. http://dx.doi.org/10.1093/nar/gkh036. [DOI] [PMC free article] [PubMed] [Google Scholar]
- 35.Lin Y, Xiang Z, He Y. Towards a Semantic Web Application: Ontology-driven Ortholog Clustering Analysis. Icbo. 2011 [Google Scholar]
- 36.Wu CH, Yeh LSL, Huang H, Arminski L, Castro-Alvear J, Chen Y, et al. The protein information resource. Nucleic Acids Res. 2003;31:345–347. doi: 10.1093/nar/gkg040. [DOI] [PMC free article] [PubMed] [Google Scholar]
- 37.UniProt Consortium. The Universal Protein Resource (UniProt) in 2010. Nucleic Acids Res. 2010;38:D142–D148. doi: 10.1093/nar/gkp846. http://dx.doi.org/10.1093/nar/gkp846. [DOI] [PMC free article] [PubMed] [Google Scholar]
- 38.Becker KG, White SL, Muller J, Engel J. BBID: the biological biochemical image database. Bioinformatics. 2000;16:745–746. doi: 10.1093/bioinformatics/16.8.745. http://dx.doi.org/10.1093/bioinformatics/16.8.745. [DOI] [PubMed] [Google Scholar]
- 39.Nishimura D. BioCarta, Biotech Softw Internet Rep 2. 2001:117–120. http://dx.doi.org/10.1089/152791601750294344.
- 40.Kanehisa M, Goto S, Sato Y, Kawashima M, Furumichi M, Tanabe M. Data, information, knowledge and principle: back to metabolism in KEGG. Nucleic Acids Res. 2014;42:D199–D205. doi: 10.1093/nar/gkt1076. http://dx.doi.org/10.1093/nar/gkt1076. [DOI] [PMC free article] [PubMed] [Google Scholar]
- 41.Hosack DA, Dennis G, Sherman BT, Lane HC, Lempicki RA. Identifying biological themes within lists of genes with EASE. Genome Biol. 2003;4:R70. doi: 10.1186/gb-2003-4-10-r70. http://dx.doi.org/10.1186/gb-2003-4-10-r70. [DOI] [PMC free article] [PubMed] [Google Scholar]
- 42.Storey JD, Tibshirani R. Statistical significance for genomewide studies. Proc Natl Acad Sci U S A. 2003;100:9440–9445. doi: 10.1073/pnas.1530509100. http://dx.doi.org/10.1073/pnas.1530509100. [DOI] [PMC free article] [PubMed] [Google Scholar]
- 43.Mootha VK, Lindgren CM, Eriksson KF, Subramanian A, Sihag S, Lehar J, et al. PGC-1alpha-responsive genes involved in oxidative phosphorylation are coordinately downregulated in human diabetes. Nat Genet. 2003;34:267–273. doi: 10.1038/ng1180. http://dx.doi.org/10.1038/ng1180. [DOI] [PubMed] [Google Scholar]
- 44.Subramanian A, Tamayo P, Mootha VK, Mukherjee S, Ebert BL, Gillette MA, et al. Gene set enrichment analysis: a knowledge-based approach for interpreting genome-wide expression profiles. Proc Natl Acad Sci U S A. 2005;102:15545–15550. doi: 10.1073/pnas.0506580102. http://dx.doi.org/10.1073/pnas.0506580102. [DOI] [PMC free article] [PubMed] [Google Scholar]
- 45.Krzywinski M, Schein J, Birol I, Connors J, Gascoyne R, Horsman D, et al. Circos: an information aesthetic for comparative genomics. Genome Res. 2009;19:1639–1645. doi: 10.1101/gr.092759.109. http://dx.doi.org/10.1101/gr.092759.109. [DOI] [PMC free article] [PubMed] [Google Scholar]
Associated Data
This section collects any data citations, data availability statements, or supplementary materials included in this article.