Abstract
We report an inkjet-printed microscale magnetic structure that can be integrated on regular glass slides for the immunomagnetic screening of rare Circulating Tumor Cells (CTCs). CTCs detach from the primary tumor site, circulate with the bloodstream, and initiate the cancer metastasis process. Therefore, a liquid biopsy in the form of capturing and analyzing CTCs may provide key information for cancer prognosis and diagnosis. Inkjet printing technology provides a non-contact, layer-by-layer and mask-less approach to deposit defined magnetic patterns on an arbitrary substrate. Such thin film patterns, when placed in an external magnetic field, significantly enhance the attractive force in the near-field close to the CTCs to facilitate the separation. We demonstrated the efficacy of the inkjet-print micromagnet array integrated immunomagnetic assay in separating COLO205 (human colorectal cancer cell line) from whole blood samples. The micromagnets increased the capture efficiency by 26% compared with using plain glass slide as the substrate.
Keyterms: inkjet printing, micromagnets, circulating tumor cells, microfluidic, immunomagnetic cell separation
Introduction
Circulating tumor cells (CTCs) are the cells that have shed into the vasculature from a primary tumor site, and circulated in the bloodstream. Detecting and analyzing CTC have been an active research area because of their clinical values in assisting cancer diagnosis and prognosis [1]. To overcome the challenges associated with the rareness of the CTC, a variety of technologies have been developed to separate the CTC from interfering background hematocyte cells [2, 3]. One effective approach is the immunomagnetic assay, which works by labeling the cancer cells with magnetic tags through cancer-specific antibodies, and using permanent magnets to drive the labeled cancer cells for separation [4].
Traditional immunomagnetic assay uses permanent magnets (in the scale of centimeter or millimeter) as the magnetic flux source. They are limited in the low magnetic field gradient, which might cause cell losses. Limitation also comes from the low density of effective magnetic traps, which might lead to cell aggregation. The aggregation may impact the structural integrity and fluorescent signals of the CTC, and interfere with cell imaging and identifying. To advance the immunomagnetic assay, especially for rare cell detection applications, integration of microfluidic chip and microscale magnetic flux source has been pursued [5].
A NdFeB hard magnetic films is deposited on silicon substrate using thermal patterning technique, and is used to trap cells functionalized with super paramagnetic nanoparticles [6]. A shrink induced magnetic trap is formed on a shape memory polymer and integrated into a microfluidic device to extract DNA samples for qPCR studies [7]. Imprinting technology is used to pattern magnetic microparticles on polymer substrates using a magnetic grid as the template. The imprinted structures can be used to trap magnetically-labeled fibroblast cells [8]. Other than static micromagnet, micro-electromagnet can also be used to clean pathogens from human blood [9]. We have recently developed a patterned thin-film micromagnet array using photolithography and deposition technique, and demonstrated its impact in enhancing the capture and distribution of the CTCs [10]. Despite the differences in geometry and fabrication methodology, these micromagnets work with the same principle - the micromagnets generate localized strong magnetic field after being magnetized by the external magnetic field, and increase the magnetic force applied on the target cells to facilitate the magnetic separation process.
Inkjet printing technology, which is widely used for hard-copy documents production and high definition photographic printing, is emerging as an alternative patterning technology to traditional photolithography that enables fabrication of two-dimensional or three-dimensional structures with sub-micrometer resolution. It has been applied in various fields such as electrochemical sensor [11], biological nanodevices [12], nanophotonic devices [13, 14], and organic electronics [15]. It has also been used as a versatile patterning technique with cells, polymers [16], and magnetic materials [17]. The printing process includes the ejection of a fixed quantity of ink in a chamber, which is sensitive to external voltage, from a nozzle through a sudden, quasi-adiabatic reduction of the chamber volume via piezoelectric action. This sudden reduction sets up a shockwave in the ink, which causes a liquid to eject from the nozzle. The inks have to meet strict physicochemical properties (viscosity, surface tension, adhesion to a substrate etc.) to achieve optimal performance and reliability of the inkjet printing process [18]. This technology is appealing in it being a noncontact, additive patterning and mask-less approach. Versatile thin films can be directly written on the substrate, and the design can be easily modified from batch to batch [19, 20].
Here we report a micromagnet array fabricated using inkjet-printing technology and integrate it with immunomagnetic microchip to optimize the detection of the rare CTCs. We first present the fabrication principle and detailed characterization results of the inkjet micromagnet structure. Then, we introduce the experimental results of using the inkjet micromagnet integrated system to separate CTCs from whole blood samples. We choose COLO205 cells (a type of human colorectal cancer cell line) as the separation target [21].
Figure 1(a) shows the principle of the inkjet micromagnet array integrated immunomagnetic CTC screening system. The whole blood sample, which contains large number of normal blood cells as well as spiked cancer cells, is mixed with magnetic nanoparticle suspension for labeling. The nanoparticles are functionalized with antibodies, such as anti-epithelial cell adhesion molecule (anti-EpCAM), and bind with CTC specifically. When the blood sample flows through the microchannel, the cancer cells are magnetically separated due to the magnetic momentum provided by the attached magnetic nanoparticles. Meanwhile, normal blood cells, such as red blood cells (RBC) and white blood cells (WBC) flow out of the microchannel unaffected. Figure 1(b) is a three-dimensional illustration of the assembled device structure. Two magnetic flux sources exist in the system – external magnetic field generated by the permanent magnets outside the microchannel, and internal magnetic field generated by the inkjet-printed micromagnets. Spacers are introduced to the system to adjust the external magnetic field. The combination of the two magnetic flux sources enhances the attractive interactions between the cancer cells and the microchannel. To take advantage of the gravitational force, the microchannel is kept in the inverted orientation during the separation process [22].
Figure 1.
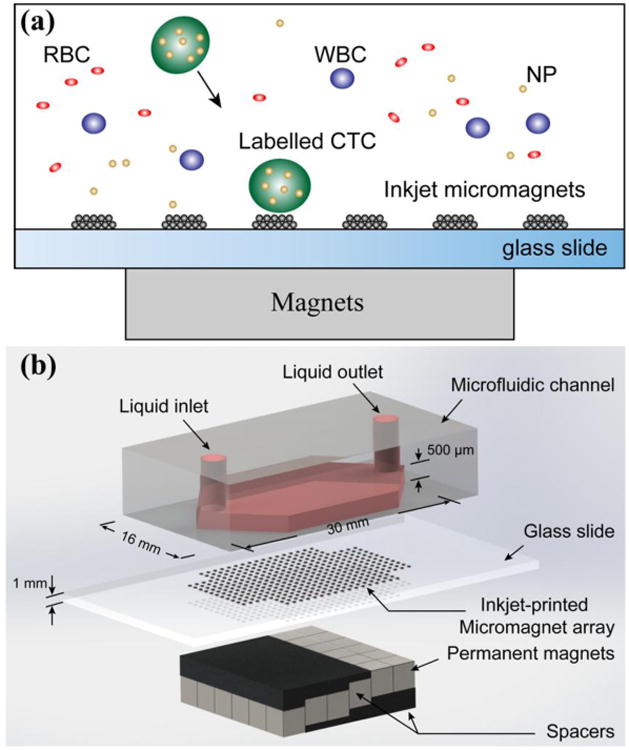
Inkjet-printed micromagnet integrated immunomagnetic microchip for the detection of rare circulating tumor cells. (a) Principle of the immunomagnetic CTC separation and the micromagnet integration. (b) 3-dimensional illustration of the assembled microchip device.
Compared with other microfluidic based CTC detection technologies [2, 23, 24], the micromagnet integrated immunomagnetic assay retains the high sensitivity of magnetic separation and high specificity of immuno-recognition. As a patterning technique, the inkjet printing technique is a versatile approach for rapid prototyping, and can be easily integrated with glass slides. It is a more cost-effective technology that allows the deposition with high accuracy, flexibility and great reproducibility [25, 26]. In addition, the micromagnet design can be easily modified toward different targets, such as different cancer types or different cancer stages. It provides a promising platform to push toward clinical and translational applications [27].
Materials and Methods
Device fabrication
Figure 2(a) illustrates the workflow of the micromagnet fabrication using inkjet printing technology. Magnetic nanoparticle suspension (3 μL, fluidMAG-ARA from chemicell™ with hydrodynamic diameter of 100 nm) is mixed with 100 μL ink medium to make the printing ink. Commercial inkjet material printer (Fuji DMP-2800 Dimatrix Materials Printer, FUJIFILM) is used to print the ink (jetting temperature is 40°C) following a defined pattern on a standard glass slide (pre-heated to 60°C). After printing, the glass slide is moved to a hot plate (pre-heated to 100°C) to evaporate the printing ink liquid. The magnetic nanoparticles remain on the glass slide and self-assemble the micromagnet structures. Then plasma-enhanced chemical vapor deposition (PECVD) is used to coat the entire structure with SiO2 (10 nm thick) to protect the patterns against the blood flows in the microchannel. The microchannel is made by a standard molding technique using PDMS (Sylgard184, Dow Corning, Midland, MI, 10 : 1 prepolymer to curing agent). UV-patterned SU-8 photoresist (MicroChem, Newton, MA) on a silicon wafer is used as the master. After removal from the master template, the PDMS chip is manually cut into a proper size and bonded with the glass slide that has micromagnets on the surface to form the microfluidic chamber for CTC screening.
Figure 2.
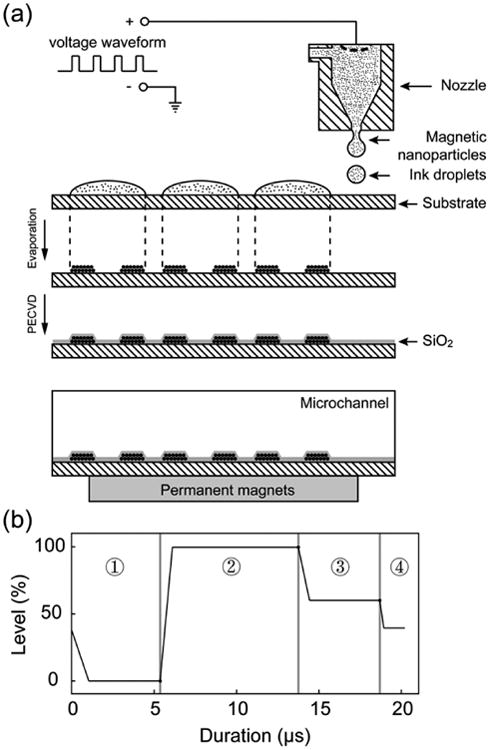
Fabrication of the micromagnet array. (a) Fabrication process of the micromagnet array using inkjet printing technology. (b) Printing waveform used to control the ink ejection from the inkjet printer.
We measure the viscosity of the printing ink medium in advance to meet the requirements of the inkjet printer. Ink medium is the mixture of glycerol and DI water. We prepare ink samples with different volume ratios between glycerol (Glycerol, ≥ 99% from Sigma-Aldrich) and DI water (1:0.8, 1:0.75, 1:0.7, 1:0.64, 1:0.6). When the concentration of glycerol is higher, the viscosity becomes larger. The viscosities of the samples are measured using vibrational viscometer (SV-10 vibration viscometer, A&D Company, Japan) at the jetting temperatures (40°C). At this temperature, the viscosity of the medium with 1: 0.75 mix ratio is 8 [cP], and it's in the working range of the printer. We select this medium as the printing ink.
The cartridge voltage is set to be 40 V. The piezo-jetting of the cartridge is controlled by a customized waveform, which contains four segments as shown in Figure 4(b). Each segment has three important properties: level, duration and slew rate. The level values, which is a percentage of the cartridge voltage. The level values in segment one and two have the most impact on the jetting process. Changing duration of segment one and slew rate and/or duration of segment two changes drop formation largely. The applied voltage relates directly to the volume of the pumping chamber. Faster changes in voltage change the volume faster, bigger changes in voltage cause bigger volume changes. The slew rate determines the rate of the volume change. The wave form we use is shown in Table 1.
Figure 4.
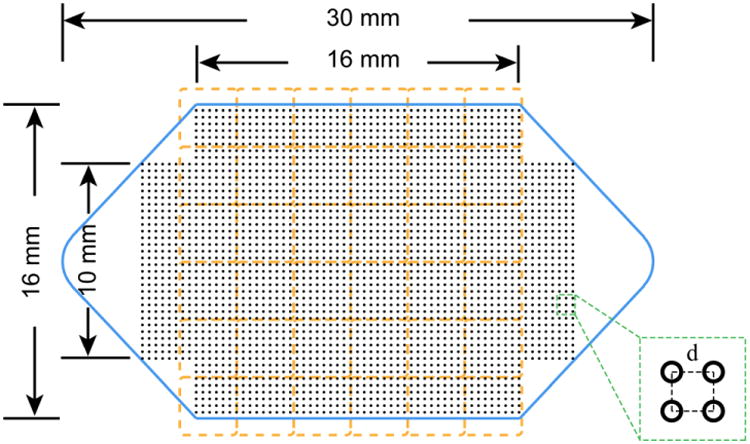
Design of the microchannel and the micromagnet array. Blue solid line – geometry and dimensions of the microchannel. Orange dash line – position and layout of the permanent magnet array. Black dot array – layout and distribution of the inkjet micromagnets. Inset: zoom-in view of the micromagnet array and the array periodicity.
Table 1.
Key parameter and waveform used to control the ink ejection during the micromagnet fabrication process.
| Segment | Level (%) | Slew Rate | Duration (μs) |
|---|---|---|---|
| 1 | 0 | 0.36 | 5.376 |
| 2 | 100 | 1.35 | 8.384 |
| 3 | 67 | 0.6 | 4.928 |
| 4 | 40 | 0.8 | 1.344 |
Cell screening experiment protocol
The cultured COLO205 cell suspension is first mixed and incubated with trypsin (0.05% Trypsin-EDTA (1X), Phenol Red, Life Technology) for 5 minutes to break the cell clusters and ensure the cells flow through the microchannel individually. Observe the cells under the microscope until over 90% of the cells are individually dispersed, otherwise increase the incubation time a few more minutes, and check for dissociation every 30 seconds. Then same amount of cell culture medium (RPMI 1640 with 5% fetal bovine serum) is added to the suspension to neutralize the trypsin. A cell suspension (10∼20 μL) containing approximately ∼150 cells is spiked into 2.5mL aliquot of blood samples acquired from healthy donors. Then, magnetic nanoparticles (Ferrofluid™, Janssen Diagnostic, LLC), which are pre-functionalized with cancer specific antibodies anti-EpCAM, are added to the blood samples to label the COLO205 cells. In our previous studies, we did TEM with the particles, and found the average diameter of this particle is around 100 nm. We did simulation to estimate the number of particles per cell was 2250∼4500. The magnetic momentum and labeling effectiveness of the particles have been experimentally demonstrated [4]. PBS is used to fill the microchannel before introducing the blood sample to eject air bubbles at the flow rate of 5ml/hr. The blood sample is then driven through the microchannel at a flow rate of 2.5 ml/hr using a syringe pump. After the screening, PBS is introduced to wash the remaining blood and to remove unwanted cells. After flushing, 1 mL of ice-cold acetone is introduced at the flow rate of 2.5 mL/hr to the channel to fix cancer cells onto the substrate. The sample slide is then disassembled and dried and stored in fridge (4°C) before staining.
Fluorescent staining and imaging
After the screening steps, the samples slides are fluorescently stained with anti-cytokeratin (CK, protein in epithelial tissue, mouse anti-cytokeratin, pan-FITC, Sigma-Aldrich, St Louis, MO), anti-CD45 (found on leukocytes, AlexaFluor 568, Invitrogen, Carlsbad, CA, bound to mouse anti-human clone 9.1 made in Dr. Jonathan Uhr's lab at the University of Texas Southwestern Medical Center), and DAPI (stain DNA in cell nucleus, Vectashield Mountain Medium with DPA, Vector Laboratories, Inc, Burlingame, CA). CTCs exhibit CK+/CD45-/DAPI+ signals, while background white blood cells show CK-/CD45+/DAPI+ signals. The slides are first rinsed with PBST (PBS + 0.1% Tween 20, Sigma-Aldrich, St. Louis, MO) for 5 minutes, and then excessive solution is removed using Kimwipe. 300 μL blocking buffer (Boca Science Inc., Boca Raton, FL) is added to each slide followed by a 60 minutes incubation at 37°C. The slides are then stained with anti-cytokeratin and anti-CD45 in staining solution (1X PBS, 0.1% Tween-20, and 1% BSA). After another 45 minutes incubation at 37°C, the slides are rinsed with PBST thoroughly. Next, the slides are stained with DAPI. The samples are stored in 4°C fridge for 30 minutes before being observed with the inverted microscope (IX81, Olympus, Center Valley, PA).
Capture rate definition
The capture rate is defined as follows: when preparing the cancer cell suspension for the spiked sample, the same amount of cancer cell suspension is dropped on two glass slides as control samples. The control samples do not go through the microchannel (please note that control slides do not contain blood cells). After the suspension gets dried on the control slide, they are stained and observed as smears. The capture rate is calculated by dividing the number of the cancer cells found from the spiked samples by the average number of cancer cells found on the control slides. Since the number of cancer cells in each aliquot cannot be precisely known, chances are that more cells are spiked into the blood samples than the control slides, which could result in a nominal over 100% capture rate. One can normalize the data to 100%, but we choose to present the original data for comparison.
Fluorescent magnetic beads screening and spectrofluorometer measurement
3 μL ferromagnetic fluorescent microbeads (2 μm in diameter, pre-conjugated with green fluorescent dyes 470 nm/ 490 nm, FCM-2052-2, Spherotech, IL) suspension is added to 1 mL PBS to make the screening sample. Fluorescent emission and excitation scans are performed on a FluoroMax-4 spectrofluorometer from Horiba Scientific. The screening microbead sample is placed in a 100 μL quartz cuvette (16.100F-Q-10/Z15, Starna Cells) for fluorometer measurement. The excitation wavelength is set to 470 nm and the emission wavelength is scanned from 400 nm to 600 nm using 5 nm slit size, 1nm increment step, 1000 detector gain, and 0.5 s integration time. The sample is then flowed through the micromagnet-integrated immunomagnetic microchip at the flow rate of 5 mL/hr, and gets collected at the outlet. The emission signal of the processed microbead suspension is examined with the spectrofluorometer again at 400 nm∼600nm. The fluorescent signals are then subtracted by the background signal from the PBS solution. The depletion rate is calculated by comparing the relative fluorescent intensity at the emission wavelength of the microbead sample before and after the screening.
Statistical analysis
Data are reported as mean ± standard deviation of the mean as noted. Assuming groups have a normal distribution and homogenous variances, the group means are compared by an independent two sample T-test. Differences are considered significant at the 95% confidence level (p < 0.05).
Blood specimen collection
Blood samples are drawn from multiple healthy donors after obtaining informed consent under an IRB-approved protocol. Written informed consents were obtained from all participants. This study was approved by the Institutional Biosafety Committee (IBC) and the Advisory Committee on Human Research at the University of Texas at Austin. All experiments were performed in accordance with the declaration of Helsinki. All specimens are collected and stored in CellSave tubes (Janssen Diagnostic, J&J).
Permanent magnet configurations
As an important part of the microfluidic based immunomagnetic assay, the permanent magnet array serves for two purposes. It provides the external magnetic field for the long-range magnetic attraction to separate the CTCs from blood. Meanwhile, it magnetizes the micromagnets inside the microchannel, which generate short-range magnetic field to retain the CTCs on the surface. Strong permanent magnets can enhance the separation efficiency in both ways. However, it might cause problematic aggregation of free nanoparticles and cells in sharp areas such as the corners and edges of the permanent magnets. This aggregation may later interfere with the cell identification by quenching the fluorescent signals or damaging the cell structural integrity. We designed a pixel permanent magnet array to introduce a smooth magnetic field increment from the inlet to the outlet of the microchannel. Figure 3(a) shows the schematic of the permanent magnet array, where thirty-six pieces of N48 Neodymium magnets (1/8 inch cube, NB001-N48, Applied Magnets, Plano, TX) assemble a 6*6 array with alternating polarizations. Spacers are inserted between the magnets and the microchannel to reduce the magnetic field at the front part of the array. They are very weakly magnetized 1mm thick elastic sheets (AFG-13346 Magnet Sheets, ProMAG Products, Marietta, OH). In our previous study, we measured the magnetic field induced by the spacer to be small enough to be neglected and they can be treated as simple distance offset [28]. It is noteworthy that the spacers only cover the front part of the channel so that the strong magnetic field in the later part of the channel can prevent potential CTCs loss.
Figure 3.
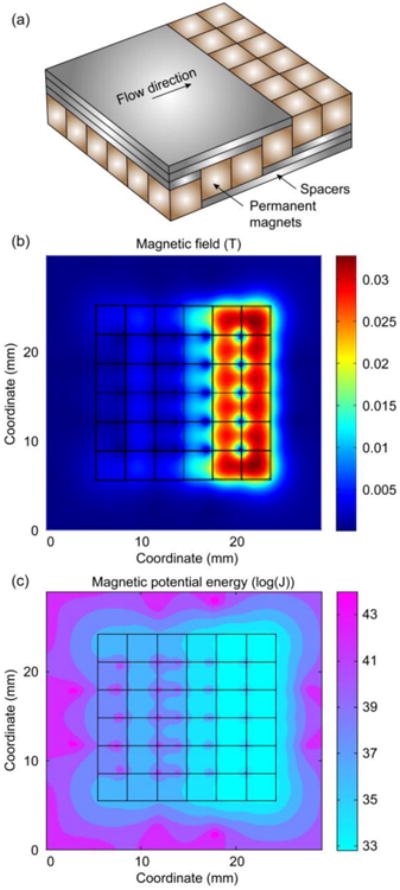
Theoretical analyses of the magnetic field generated by the pixel permanent magnets array. (a) Schematic of the permanent magnet array and the spacers. (b) Magnetic field at the bottom of the microchannel. (c) Magnetic potential energy distribution at the bottom of the microchannel.
We first examine the magnetic field generated by the pixel permanent magnet array using simulation tools, as is shown in Figure 3(b). The plot shows the magnetic field intensity at the bottom of the microchannel, i.e. 1 mm on top of the permanent magnet array. The maximum value is ∼0.03 T, and it's located at the later part of the array, where there is no spacer. The pixel design creates a smooth magnetic field increment from the front to the later part of the micorchannel.
In addition, we calculate the magnetic potential energy of the permanent magnet array. A potential well is the region surrounding a local minimum of potential energy. Due to entropy, an object tends to stay in the potential well. It can be used to explain the magnetic cell separation process. Consider an object of volume V within a fixed magnetic field M, it possesses a magneto-static self-energy that is given by:
| (1) |
where HM is the field in the object due to M. If a magnetized object is subject to an applied field Ha, it acquires a potential energy:
| (2) |
This potential energy can be viewed as the work required to move the object from an environment with zero field to a region permeated by Ha. Now we consider the model of a cell labeled with magnetic nanoparticles in an external magnetic field. Due to the small size of a cell, the variation of the magnetic field applied on the cell can be neglected. The potential energy can now be simplified to:
| (3) |
Here θ is the angle between M and Ha. The magnetization M is dependent on the applied magnetic field Ha and the volume magnetic susceptibility of the materials, give as:
| (4) |
Substitute equation (4) into (3), the potential energy now can be expressed as:
| (5) |
Given that μ0, V, χm are all constants for the same type of cell and nanoparticle, the potential energy is totally determined by the intensity of the magnetic Ha field generated by the permanent magnets. The effective magnetic susceptibility of the cell can be calculated using:
| (6) |
here Rc is the hydrodynamic radius of the cell, Rp is the hydrodynamic radius of the particle, and χp is the magnetic susceptibility of the labeling nanoparticle. Substitute equation (6) into (5), we get the final expression of the magnetic potential energy of the cell as:
| (7) |
Here the magnetic permeability is μ0 = 4π × 10−7 H ⋅ m−1, and the radius of the nanoparticle is Rp = 50 nm, and the volume susceptibility of the nanoparticle is χp.= 5(SI). The number of nanoparticles per cell is set to be N=2500, which is estimated based on our device model and verified with experimental results [4].
Due to the large variance in the magnetic potential well energy, we take a logarithmic calculate of the energy to show the distribution, and the result is shown in Figure 3(c). The pixel permanent magnet array displays scattered potential wells all over the microchannel due to the alternating polarizations. In the meantime, the array shows enhanced potential well toward the end of the array, which guarantees that any target cells that might escape from the front part can be captured before flow out of the channel.
Results
Microchannel and micromagnet array design
The geometry and key dimensions of the microfluidic channel are shown in Figure 4 (blue solid line). The height of the microchannel is 500 μm. The microchannel is designed to be a flat chamber to increase the effective contact area and decrease the distance between the channel and the permanent magnets. The position of the permanent magnet array is shown as orange dash lines in Figure 4. The permanent magnets are placed with alternating polarizations to maximize the magnetic field gradient. The layout of the inkjet micromagnet array is illustrated by the black dots in Figure 4. The resolution, i.e. the dimension of a single micromagnet element, is determined by the volume of a single inkjet droplet and the concentration of nanoparticles in the ink. The periodicity of the micromagnet array (shown in the inset of Figure 4) d is decided by the inkjet printer cartridge, and it ranges between 0∼250 μm. The dimensions of a micromagnet determine the strength and effective range of individual micromagnet. The spatial periodicity plays a significant role in adjusting the distributions of the captured CTCs to facilitate cell staining and imaging. According to our previous theoretical investigation of the micromagnet approach, we choose the dimension of the inkjet micromagnet to be ∼ 50 μm, and micromagnet array periodicity to be ∼ 150μm [10].
Inkjet- printed micromagnets fabrication
Figure 5(a) shows the SEM (scanning electron microscope) images of the inkjet-printed micromagnets, and the inset shows a zoom-in view of a single printed pattern. The magnetic nanoparticles assemble multiple “ring-shaped” structures as an array on the substrate. Most of the nanoparticles aggregate around the edges of the ring, and a small amount of nanoparticles are scattered in the middle of the ring. The ring structure is formed because of the thermodynamics in the evaporation stage. The evaporation rate is higher at the edge than the center, which creates outward convective flow and brings the nanoparticles to the edges. Such high concentration of magnetic nanoparticles on the edge creates a distributed local maximum of magnetic gradient, which enhances the capture of labeled cancer cells.
Figure 5.
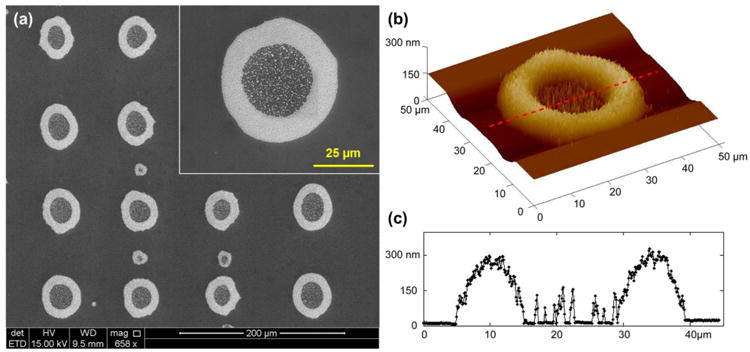
Inkjet-printed micromagnets. (a) SEM of the inkjet- printed micromagets, and zoom-in view of a single micromanget element. (b) AFM profile of a single micromagnet element. (c) Cross-section profile of a single micromagnet element showing the maximum height at the edge of the micromagnet is 300 nm.
To calibrate the fabricated structure, we take images of the printed pattern using bright-field microscope and perform measurement with ImageJ. The outer diameter is determined to be 48.5±3.5 μm, the inner diameter 25.9±3.1 μm, and the width of the edge is 11.2±1.3 μm. The dimension of the inkjet-printed micromagnet is on the same order as a cancer cell, which indicates that only a few cells can interact fully with each micromagnet. It helps distribute the cells over the micromagnet array on the substrate. The periodicity of the printed micromagnet array is measured to be 150 μm. We also characterize the printed pattern with AFM (atomic force microscope) to obtain the morphological information. The result is shown in Figure 5(b). We take a cross-section of Figure 5(b), as indicated by the red dash line, and the profile is shown in Figure 5(c). The peak thickness at the edge of the pattern is about 300 nm. AFM measurement also confirms the ring-shaped geometry we observe in the SEM images.
Screening experiments with magnetic fluorescent beads
To test the efficacy of the inkjet-printed patterns and the immunomagnetic system, we first run experiments with magnetic fluorescent beads. When the microbead solution flows through the microchannel, the microbead gets separated. Figure 6(a) shows the fluorescent image of part of the slides after the screening experiments. The printed patterns work as microscale magnetic flux sources and attract the magnetic microbeads. For the experiments with the fluorescence beads, the periodicity of 75um is used to better visualize the effect of the printed pattern. We use the periodicity of 150 μm for all the other experiments with cancer cells. We plot the relative fluorescent intensity of the image as shown in Figure 6(b). The fluorescent signal profile exhibits regular repetition, and the distance between two adjacent peaks is about 75 μm, which is the value we used for the sample slides. It validates the functionality of the printed micromagnet patterns in generating surface magnetic field. In addition, we examine and compare the fluorescent signal intensity of the sample microbead suspension before and after the screening experiments with spectrofluorometer. The depletion rate is 100%, indicating that the system effectively removes all the magnetic beads.
Figure 6.
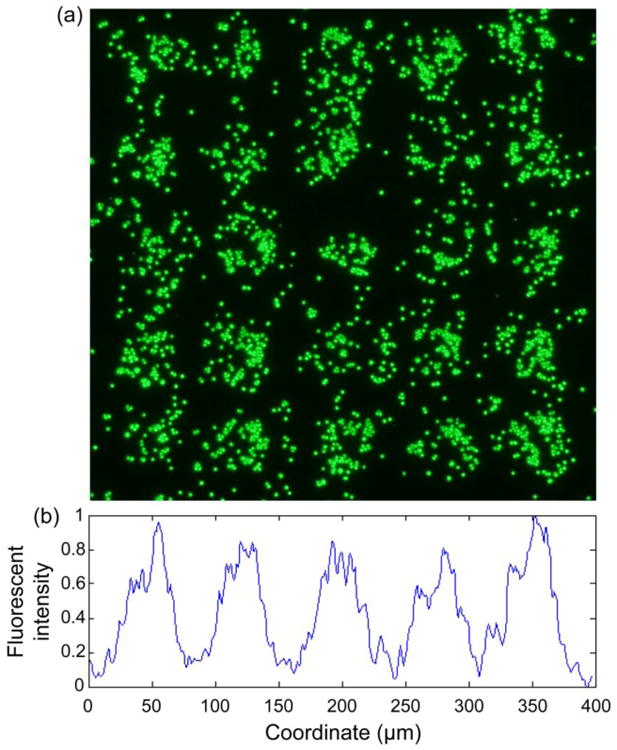
Magnetic screening of fluorescent magnetic microbeads. (a) Fluorescent image of substrate showing regular distribution of the fluorescent magnetic beads. (b) Relative fluorescent intensity profile of the substrate. The peak-to-peak distance is 75 μm, equals to the periodicity of the micromagnet array.
Cancer cell screening experiments
We perform blood screening experiments with COLO205 cells as the separation targets using the inkjet-printed micromagnet integrated immunomagnetic assay. Blood samples are acquired from healthy donors. Before the screening, blood plasma is replaced using a dilution buffer to keep the physiological properties of the screening samples consistent. Ferrofluid (Janssen Diagnostic, Johnson&Johnson) nanoparticles are used to label the cells and provide the magnet momentum. During the screening experiment, flow rate is 2.5 mL/hr. After the screening, we stain the slides with anti-CK/ DAPI/ CD45 for cell identifying, counting and locating. We then observe the slides using bright-field and a fluorescent microscope respectively.
After the separation step, a flushing step is performed to remove the excessive blood from the microfluidic channel. However, we find a small number of background cells (RBCs, WBCs) left on the slides, due to non-specific binding between the cells and the substrate. Therefore, immunofluorescent staining with three fluorescent dyes (anti-CK, anti-CD45, DAPI) is an essential step to identify the cells as discussed in several previous studies [4, 28-30]. Bright-field, fluorescent, and overlay images of sample cells found on the substrate are shown in Figure 7. The arrows in Figure 7 point to the micromagnts. Sample COLO205 cells are found directly attached to the printed micromagnets, or indirectly trapped by the ferrofluid nanoparticles aggregated around the printed patterns, as shown in the overlay images in Figure 7. The direct and indirect attachment between the COLO205 cells and the inkjet micromagnets confirm the interactions between the cells and the micromagnet patterns.
Figure 7.
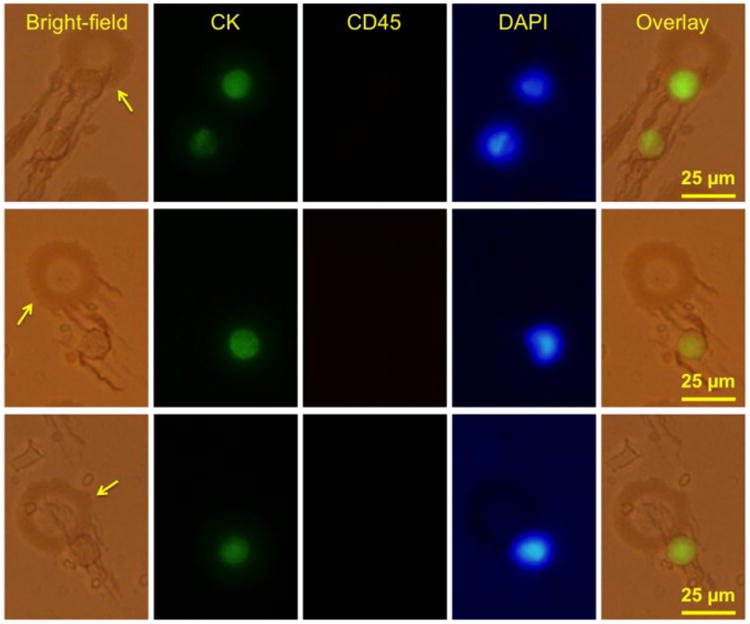
COLO 205 screening experiment results using the inkjet-printed micromagnet integrated immunomagnetic assay. The arrows point to the locations of the micromagnets. Bright-field and fluorescent panel show the interactions between the COLO205 cells and the micromagnet elements.
Discussion
Now we study the effect of the inkjet-printed micromagnets in capturing CTCs. Same microfluidic channel is used with two types of substrate, namely patterned slide and plain slide. The patterned slides are standard glass slides with the inkjet –printed patterns. Plain slides are standard glass slides exposed to the same external magnetic field but without the patterns. On plain slides, the average capture rate is 69.1±12.6% (n = 4), while on the inkjet-printed slides, the average capture rate is 95.6±6% (n =4). The micromagnet patterns increase the capture rate by ∼26% (p<0.05) compared with plain slides. The micromagnet-integrated system presented here is an optimization based on our previous generation of the immunomagnetic CTC detection microchip. In the previous design, plain glass slide without any micromagnet pattern and large permanent magnets were used as the substrate. It yielded an average capture rate of 79.5±24% in the screening experiments with COLO205 [4]. The integration of the micromagnets and pixel permanent magnet increases the capture rate by 16% compared with the previous system.
To study the effect of the patterns, we divide the captured cells into two groups based on whether they are captured by the printed patterns or not. The results are shown in Figure 8(a) (blue dots: cell attached to a micromagnet, orange dots: cells not attached to a micromagnet). We find 78.5% of the captured cells are found to be captured by the micromagnets, only 21.5% of the cells are not attached to any micromagnets. With this large portion of cells captured by the inkjet micromagnets, it confirms the contributions of the inkjet micromagnets in enhancing the surface magnetic field and increasing the CTC capture efficiency.
Figure 8.
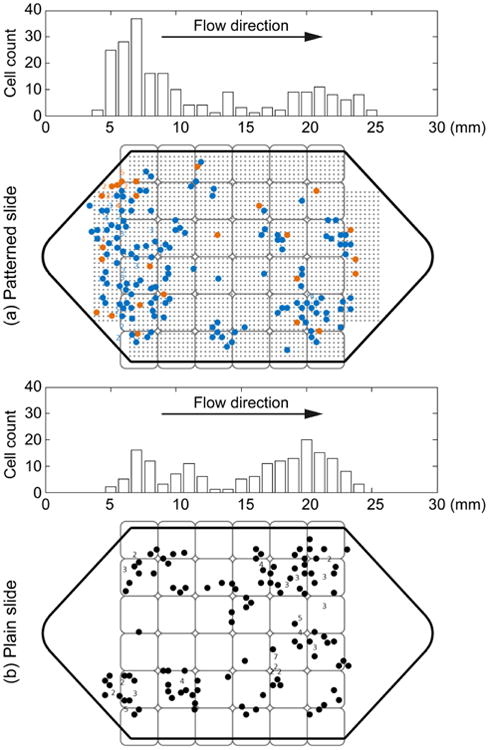
Locations and distributions of the captured COLO 205 cells on (a) inkjet-print micromagnet integrated slides and (b) plain slide respectively. In (a), blue dots represent the cells that are attached to the micromagnets, while the orange dots are the cells that are found not attached to any micromagnet.
Figure 8 (a) and (b) show the locations and distribution histograms of the captured COLO205 cells on two sample micromagnet and plain slides respectively. The position of the permanent magnet array is also shown in Figure 8. The gray dots in Figure 8(a) indicate the position of the micromagnet array. The pixel permanent magnet array and the spacers reduce the magnetic field at the front of the channel, thus allowing the target cells to be captured all over the substrate. With the previous design of our immunomagnetic microchip, more than 95% of the cancer cells were captured at the front edge of the permanent magnet array [10]. While with the current design, this number was lowered down to 61%. The reduced aggregation facilitates the subsequent studies including staining and imaging.
On plain slides (Figure 8(b)), more cancer cells are captured close to the outlet of the microchannel. This is because the spacers reduce the magnetic field at the front part of the channel, and the magnetic force is the strongest in the area close to the outlet. While on patterned slides, more cancer cells are captured close to the inlet of the microchannel (Figure 8(a)). It is because the micromagnets in the front part of the microchannel are magnetized and increase the attractive forces applied on the cancer cells for the separation. It can be considered as a strong indicator of the functionality of the micromagnets.
Conclusion
In this paper, we present the design and fabrication of a micromagnet structure using inkjet printing technology. The outer diameter of the fabricated structure is 48.5±3.5 μm, the inner diameter is 25.9±3.1 μm, the width of the edge is 11.2±1.3 μm, and the peak thickness is 300 nm. The micromagnets are designed to generate sufficient magnetic force to retain the target rare CTCs. The periodicity of the micromagnet array is 150 μm, which distributes the CTCs across the substrate to facilitate cell imaging and identification. We then integrate the inkjet micromagnets into the immuomagnetic assay and perform blood screening experiments to separate COLO205 cells. The inkjet micromagnets significantly increase the capture rate by 26% compared with using plain glass slide as the substrate.
Acknowledgments
We thank our collaborator Professor Konstantin V. Sokolov at the University of Texas MD Anderson Cancer Center and Dr. Zhigang Li at the Geisel School of Medicine at Dartmouth for the supports in validating the presented results. We thank Ms. Nancy Lane and Drs. Michael Huebschman, Jonathan W. Uhr, and Eugene P. Frenkel at the University of Texas Southwestern Medical Center for their invaluable suggestions on the experiment design. We appreciate the help from Professor Tim Yeh and Dr. Judy Obliosca at the University of Texas at Austin with the spectrofluorometer measurement. We are grateful for the financial support from the National Institute of Health (NIH) National Cancer Institute (NCI) Cancer Diagnosis Program under grant 1R01CA139070.
References
- 1.Williams SCP. Circulating tumor cells. Proceedings of the National Academy of Sciences. 2013;110:4861. doi: 10.1073/pnas.1304186110. [DOI] [PMC free article] [PubMed] [Google Scholar]
- 2.Chen Y, Li P, Huang PH, Xie Y, Mai JD, Wang L, Nguyen NT, Huang TJ. Rare cell isolation and analysis in microfluidics. Lab on a Chip. 2014;14:626–45. doi: 10.1039/c3lc90136j. [DOI] [PMC free article] [PubMed] [Google Scholar]
- 3.Shields CW, IV, Reyes CD, López GP. Microfluidic cell sorting: a review of the advances in the separation of cells from debulking to rare cell isolation. Lab on a Chip. 2015 doi: 10.1039/c4lc01246a. [DOI] [PMC free article] [PubMed] [Google Scholar]
- 4.Hoshino K, Huang YY, Lane N, Huebschman M, Uhr JW, Frenkel EP, Zhang X. Microchip-based immunomagnetic detection of circulating tumor cells. Lab on a Chip. 2011;11:3449–57. doi: 10.1039/c1lc20270g. [DOI] [PMC free article] [PubMed] [Google Scholar]
- 5.Chen P, Huang YY, Hoshino K, Zhang X. Multiscale immunomagnetic enrichment of circulating tumor cells: from tubes to microchips. Lab on a Chip. 2014;14:446–58. doi: 10.1039/c3lc51107c. [DOI] [PubMed] [Google Scholar]
- 6.Zanini LF, Dempsey NM, Givord D, Reyne G, Dumas-Bouchiat F. Autonomous micro-magnet based systems for highly efficient magnetic separation. Applied Physics Letters. 2011;99:232504. [Google Scholar]
- 7.Nawarathna D, Norouzi N, McLane J, Sharma H, Sharac N, Grant T, Chen A, Strayer S, Ragan R, Khine M. Shrink-induced sorting using integrated nanoscale magnetic traps. Applied Physics Letters. 2013;102:063504. doi: 10.1063/1.4790191. [DOI] [PMC free article] [PubMed] [Google Scholar]
- 8.Dempsey NM, Le Roy D, Marelli-Mathevon H, Shaw G, Dias A, Kramer RBG, Viet Cuong L, Kustov M, Zanini LF, Villard C, Hasselbach K, Tomba C, Dumas-Bouchiat F. Micro-magnetic imprinting of high field gradient magnetic flux sources. Applied Physics Letters. 2014;104:262401. [Google Scholar]
- 9.Yung CW, Fiering J, Mueller AJ, Ingber DE. Micromagnetic-microfluidic blood cleansing device. Lab on a Chip. 2009;9:1171–7. doi: 10.1039/b816986a. [DOI] [PubMed] [Google Scholar]
- 10.Chen P, Huang YY, Hoshino K, Zhang JXJ. Microscale Magnetic Field Modulation for Enhanced Capture and Distribution of Rare Circulating Tumor Cells. Sci Rep. 2015;5 doi: 10.1038/srep08745. [DOI] [PMC free article] [PubMed] [Google Scholar]
- 11.Jensen GC, Krause CE, Sotzing GA, Rusling JF. Inkjet-printed gold nanoparticle electrochemical arrays on plastic. Application to immunodetection of a cancer biomarker protein. Physical Chemistry Chemical Physics. 2011;13:4888–94. doi: 10.1039/c0cp01755h. [DOI] [PMC free article] [PubMed] [Google Scholar]
- 12.Truskett VN, Watts MP. Trends in imprint lithography for biological applications. Trends in biotechnology. 2006;24:312–7. doi: 10.1016/j.tibtech.2006.05.005. [DOI] [PubMed] [Google Scholar]
- 13.Seekamp J, Zankovych S, Helfer A, Maury P, Torres CS, Boettger G, Liguda C, Eich M, Heidari B, Montelius L. Nanoimprinted passive optical devices. Nanotechnology. 2002;13:581. [Google Scholar]
- 14.Tekin E, Smith PJ, Hoeppener S, van den Berg AM, Susha AS, Rogach AL, Feldmann J, Schubert US. Inkjet printing of luminescent CdTe nanocrystal–polymer composites. Advanced Functional Materials. 2007;17:23–8. [Google Scholar]
- 15.Wu W, Jung GY, Olynick D, Straznicky J, Li Z, Li X, Ohlberg D, Chen Y, Wang SY, Liddle J. One-kilobit cross-bar molecular memory circuits at 30-nm half-pitch fabricated by nanoimprint lithography. Applied Physics A. 2005;80:1173–8. [Google Scholar]
- 16.Kim JD, Choi JS, Kim BS, Choi YC, Cho YW. Piezoelectric inkjet printing of polymers: Stem cell patterning on polymer substrates. Polymer. 2010;51:2147–54. [Google Scholar]
- 17.Voit W, Zapka W, Belova L, Rao K. Application of inkjet technology for the deposition of magnetic nanoparticles to form micron-scale structures. IEE Proceedings-Science, Measurement and Technology. 2003;150:252–6. [Google Scholar]
- 18.Fuller SB, Wilhelm EJ, Jacobson JM. Ink-jet printed nanoparticle microelectromechanical systems. Microelectromechanical Systems, Journal of. 2002;11:54–60. [Google Scholar]
- 19.Singh M, Haverinen HM, Dhagat P, Jabbour GE. Inkjet printing—process and its applications. Advanced materials. 2010;22:673–85. doi: 10.1002/adma.200901141. [DOI] [PubMed] [Google Scholar]
- 20.Tekin E, Smith PJ, Schubert US. Inkjet printing as a deposition and patterning tool for polymers and inorganic particles. Soft Matter. 2008;4:703–13. doi: 10.1039/b711984d. [DOI] [PubMed] [Google Scholar]
- 21.Mitchell MJ, Wayne E, Rana K, Schaffer CB, King MR. TRAIL-coated leukocytes that kill cancer cells in the circulation. Proceedings of the National Academy of Sciences. 2014;111:930–5. doi: 10.1073/pnas.1316312111. [DOI] [PMC free article] [PubMed] [Google Scholar]
- 22.Hoshino K, Chen P, Huang YY, Zhang X. Computational Analysis of Microfluidic Immunomagnetic Rare Cell Separation from a Particulate Blood Flow. Analytical Chemistry. 2012;84:4292–9. doi: 10.1021/ac2032386. [DOI] [PMC free article] [PubMed] [Google Scholar]
- 23.Ozkumur E, Shah AM, Ciciliano JC, Emmink BL, Miyamoto DT, Brachtel E, Yu M, Chen Pi, Morgan B, Trautwein J. Inertial focusing for tumor antigen– dependent and–independent sorting of rare circulating tumor cells. Science translational medicine. 2013;5:179ra47–ra47. doi: 10.1126/scitranslmed.3005616. [DOI] [PMC free article] [PubMed] [Google Scholar]
- 24.Hou HW, Warkiani ME, Khoo BL, Li ZR, Soo RA, Tan DSW, Lim WT, Han J, Bhagat AAS, Lim CT. Isolation and retrieval of circulating tumor cells using centrifugal forces. Scientific reports. 2013;3 doi: 10.1038/srep01259. [DOI] [PMC free article] [PubMed] [Google Scholar]
- 25.Singh M, Haverinen HM, Dhagat P, Jabbour GE. Inkjet printing-process and its applications. Advanced materials. 2010;22:673. doi: 10.1002/adma.200901141. [DOI] [PubMed] [Google Scholar]
- 26.Gonzalez-Macia L, Morrin A, Smyth MR, Killard AJ. Advanced printing and deposition methodologies for the fabrication of biosensors and biodevices. Analyst. 2010;135:845–67. doi: 10.1039/b916888e. [DOI] [PubMed] [Google Scholar]
- 27.Riethdorf S, Fritsche H, Müller V, Rau T, Schindlbeck C, Rack B, Janni W, Coith C, Beck K, Jänicke F. Detection of circulating tumor cells in peripheral blood of patients with metastatic breast cancer: a validation study of the CellSearch system. Clinical Cancer Research. 2007;13:920–8. doi: 10.1158/1078-0432.CCR-06-1695. [DOI] [PubMed] [Google Scholar]
- 28.Huang Yy, Hoshino K, Chen P, Wu Ch, Lane N, Huebschman M, Liu H, Sokolov K, Uhr JW, Frenkel EP. Immunomagnetic nanoscreening of circulating tumor cells with a motion controlled microfluidic system. Biomedical Microdevices. 2012:1–9. doi: 10.1007/s10544-012-9718-8. [DOI] [PMC free article] [PubMed] [Google Scholar]
- 29.Stott SL, Hsu CH, Tsukrov DI, Yu M, Miyamoto DT, Waltman BA, Rothenberg SM, Shah AM, Smas ME, Korir GK. Isolation of circulating tumor cells using a microvortex-generating herringbone-chip. Proceedings of the National Academy of Sciences. 2010;107:18392–7. doi: 10.1073/pnas.1012539107. [DOI] [PMC free article] [PubMed] [Google Scholar]
- 30.Nagrath S, Sequist LV, Maheswaran S, Bell DW, Irimia D, Ulkus L, Smith MR, Kwak EL, Digumarthy S, Muzikansky A. Isolation of rare circulating tumour cells in cancer patients by microchip technology. Nature. 2007;450:1235–9. doi: 10.1038/nature06385. [DOI] [PMC free article] [PubMed] [Google Scholar]


