Abstract
Cancer initiating cells (CICs) have been the focus of recent anti-cancer therapies, exhibiting strong invasion capability via potentially enhanced ability to remodel extracellular matrices (ECM). We have identified CICs in a human breast cancer cell line, MX-1, and developed a xenograft model in SCID mice. We investigated the CICs’ matrix-remodeling effects using Second Harmonic Generation (SHG) microscopy to identify potential phenotypic signatures of the CIC-rich tumors. The isolated CICs exhibit higher proliferation, drug efflux and drug resistant properties in vitro; were more tumorigenic than non-CICs, resulting in more and larger tumors in the xenograft model. The CIC-rich tumors have less collagen in the tumor interior than in the CIC-poor tumors supporting the idea that the CICs can remodel the collagen more effectively. The collagen fibers were preferentially aligned perpendicular to the CIC-rich tumor boundary while parallel to the CIC-poor tumor boundary suggesting more invasive behavior of the CIC-rich tumors. These findings would provide potential translational values in quantifying and monitoring CIC-rich tumors in future anti-cancer therapies. CIC-rich tumors remodel the collagen matrix more than CIC-poor tumors.
Keywords: cancer initiating cells, Second Harmonic Generation microscopy, collagen, breast cancer
Graphical Abstract
1. Introduction
Cancer initiating cells (CICs) have been implicated as the cells responsible for the initiation, maintenance and growth of tumors [1–3]. The concept of CICs was first proposed in leukemia with the isolation of leukemic stem cells [4, 5] and CICs have since been isolated from many different cancers [6–9]. The presence of this minority population in not only cell lines but also in patient samples has supported their implications in the clinical settings [10, 11]. CICs are highly tumorigenic, with higher expression of Vascular Endothelial Growth Factor (VEGF) and more invasive than non-CICs [12–14]. CICs are also more radiation-resistant and chemo-resistant than the bulk of the tumors [15–17].
CICs have so far been studied as isolated cells out of their tissue context important in orchestrating the observed phenotypic events in tumor development [18]. At every stage of tumor progression – initiation, vascularization and growth, the cancer cells interact with their microenvironment. The cancer niche consists of ECM, soluble factors, cancer cells and host cells such as fibroblasts, endothelial cells and immune cells [19, 20]. The interactions between cancer and host cells have been studied at cellular and molecular levels [21–23] with systems biology and mechanobiology approaches to understand these events in tissue context [24, 25]. There has not been a study of the CIC-host interaction in tissue context beyond a review by Sleeman and Cremers [26].
Several techniques have been developed to isolate and study CICs in-vitro. Protein markers such as CD44/CD24 [10], CD133 [27], EpCAM [28], and stem-cell related gene Musashi [29], play a role in CICs. A generic approach (side population technique) to isolate CICs by measuring the drug efflux potential was developed by Goodell in 1996 [30] and has been demonstrated in many types of cancer [31–35] with a few exceptions [36]. All existing techniques are only useful to identify CICs from cell suspension and not in solid tumors. CICs represent a minority population consisting of less than one percent of the tumor cells. Identifying these rare cell populations in biopsies requires extensive processing to isolate the cellular fraction for flow cytometric analysis [37]. There is no known non-destructive technique to identify CICs or its phenotype by staining or imaging the biopsy sample, even though it would be important to identify CIC-rich versus CIC-poor tumors that require different treatment regimens [3, 38]. Despite being a minority population, the CICs seem to be coordinating tumor development and progression [39] thus exhibiting potentially amplified effects on extracellular tumor microenvironment. We hypothesize that quantitative imaging by non-linear optics of the amplified tumor ECM signatures [40, 41] would allow for the differentiation of CIC-rich and CIC-poor tumors.
Collagen being one of the most abundant biomolecule in the ECM milieu renders itself as a good candidate to study CIC-ECM interactions. Fibrillar collagen such as type-I and III can be quantitatively imaged using Second Harmonic Generation (SHG) microscopy for their unique non-centro symmetric structure [42]. Collagen distributions have been imaged in breast, cervical, ovarian and skin cancers in the tumor stroma to assess collagen as a potential biomarker for cancer diagnosis [43–45]. Here we quantitatively compare the SHG-imaged collagen distributions in and around the CIC-rich and CIC-poor breast tumors from a xenograft model, and extracted features that can potentially be used as a phenotypic marker for identification of CIC-rich tumors.
2. Materials and methods
2.1 Side population sorting, CICs isolation and cell proliferation assay
GFP-labeled breast cancer cell line MX-1 kindly provided by Dr. Robert Hoffman was used for all the experiments. MX-1 cells were cultured in RPMI medium with 10% fetal calf serum (FCS), 1.5 g/L Sodium Pyruvate, Sodium Bicarbonate and Penicillin Streptomycin. Cells were passaged every 3 days when they were 80% confluent.
For side population analysis, cells were trypsinized, centrifuged at 1000 × g and 1 million cells were re-suspended in 1 mL RPMI medium with 2% FCS and 10 µM Hepes Buffer. 5 µg/mL Hoechst 33342 dye was added and the cell suspension was placed in a 37 °C water bath for 2.5 hrs. For blocking the cells from pumping out the dye, the transporters can be deactivated using the drug verapamil (Sigma Cat No: V4629). 10 µg/mL of verapamil was added to the cell suspension during the 2.5 hrs, 37 °C incubation. After 2.5 hrs the cells were pelleted in a centrifuge at 1000 × g pre-cooled to 4 °C. The cell pellet was re-suspended in a chilled HBSS buffer with 2% FCS and 10 µM Hepes at 3 million cells/mL.
A BD Fluorescence activated cell sorter (FACS) FACS Aria was used to analyze and sort for CICs. A UV laser was used to excite the cells and emission at 450/20 nm (blue) and 675 nm (red) were recorded. When the cells retain the dye in the cell interior a blue fluorescence can be detected. As time progresses the dye enters the nucleus where they bind to the DNA and produce red fluorescence. The side population or CICs are those capable of pumping the Hoechst 33342 dye out resulting in low signal levels for both blue and red fluorescence. Both the CICs and non-CICs were collected in culture medium supplemented with antibiotics and antimycotic drugs. 100,000 cells were collected for data analysis.
After sorting, 20,000 cells/well were plated in 24-well plate. Images of the cultured cells were acquired using Olympus IX51 light microscope one week after sorting. The cells were cultured and maintained over five passages over a period of 3 weeks and cell numbers were counted. The experiments were performed twice in triplicates.
2.2 Flow cytometric analysis for chemotherapeutic drug efflux
To study the side population profile for short-term drug treatment, 1 million cells were incubated in 1 mL RPMI medium with 2% FCS and 10 µM Hepes Buffer, 5 µg/mL Hoechst 33342 and 200 ng/mL of either doxorubicin or mitoxantrone for 2 hrs at 37 °C. The cells were pelleted in a centrifuge pre-warmed to 37 °C and re-suspended in 1 mL RPMI medium with 2% FCS and 10 µM Hepes Buffer and 5 µg/mL Hoechst 33342 and incubated for 0.5 hr. To study the side population profile for long-term drug-treated cells, MX-1 were cultured with 50 ng/mL doxorubicin or mitoxantrone for 7 days and then stained with Hoechst 33342 and analyzed for side population.
2.3 Developing animal models for in vivo imaging of MX-1 induced tumors
Isolated CICs and non-CICs were cultured for 2 days to allow them to recover from the stress of sorting before injecting into the animals. Female severe combined immunodeficiency (SCID) mice (17–20 g, 4–6 weeks old) were purchased from the Animal Resources Centre (Canning Vale, WA, Australia). On the day of injection, 100,000 CICs and 10 million non-CICs were trypsinized, counted, pelleted and re-suspended in 200 µL of chilled 1X PBS. The cell suspension was injected subcutaneously in the left thigh flank and left arm flank of four CIC-rich and four CIC-poor SCID mice. As the MX-1 cells were GFP-labeled the tumor growth was imaged using an in-vivo live imaging system (OV100, Olympus Corporation). The animal handling protocols were reviewed and approved by Institutional Animal Care and Use Committee (IACUC) in compliance with the guidelines on the care and use of animals for scientific purpose.
2.4 Tissue preparation and Second Harmonic Generation (SHG) imaging
The animals were sacrificed at the 8-week time point and either tumor or the tissue at the site of injection was isolated. The tissue was snap frozen in liquid nitrogen and stored at –80 °C for sectioning. The tissues were embedded in tissue freezing medium (Jung OCT solution. Cat No. 020108926) frozen at – 30 °C overnight. 40 µm and 10 µm sections were cut on a cryostat and collected on poly-lysine coated glass slides. The sections were stored in –30 °C freezer.
The 40 µm tissue section was fixed in ethanol for 10 minutes and washed in 1X PBS and de-ionized water for 10 minutes each to remove the remnant OCT solution. A 0.22 mm coverslip was mounted on the glass slide over the tissue section and the samples were imaged using second harmonic imaging microscope with pulse modulation [46]. The excitation Ti Sapphire laser (Mai Tai, Spectra Physics, Mountain View, CA) wavelength is 900 nm and the SHG signal is collected in the transmission mode through a 450 nm band pass filter (FWHM of 10 nm) and collected using a photomultiplier tube (PMT) (Hamamatsu, R6357). The two photon excited fluorescence (TPEF) from the GFP-labeled tumors were collected using another PMT after it passes a 685 nm short pass filter in reflection mode. A Carl Zeiss LSM 510 meta was modified to be used for this purpose. Images were acquired using a 0.45 NA, 10× Objective to obtain 920 µm × 920 µm, 512 × 512 pixels images.
2.5 Histology
Haematoxylin and Eosin (H&E) staining was carried out using standard protocol [47]. Briefly 10 µm tissue sections were fixed in ethanol and stained in Ham’s Haematoxylin for two minutes, washed thoroughly, and stained in Eosin for a few seconds. The stained sections are dehydrated in ethanol and Xylene and mounted in Depex mounting medium (Sigma) and imaged (IX51, Olympus).
2.6 Image processing and quantification of percentage of high SHG intensity area and collagen fiber orientation in tumors
The collagen pixels were segmented from SHG channel images using an image segmentation algorithm based on mixture Gaussian model [48]. It is assumed that the intensity of pixels in the image can be modeled as the mixture of two Gaussian distributions, one representing collagen area with strong SHG signals and the other representing the background. Using the Expectation-Maximization (EM) algorithm [49], the parameters of the Gaussian distributions that best model the intensity of pixels in the image could be found. A binary image was generated by applying value 1 to all the pixels having intensities that belong to the Gaussian distribution representing high SHG intensity area, and value 0 to the remaining pixels. The percentage of high SHG intensity area was calculated as the ratio of the collagen pixels to the total number of pixels in the image.
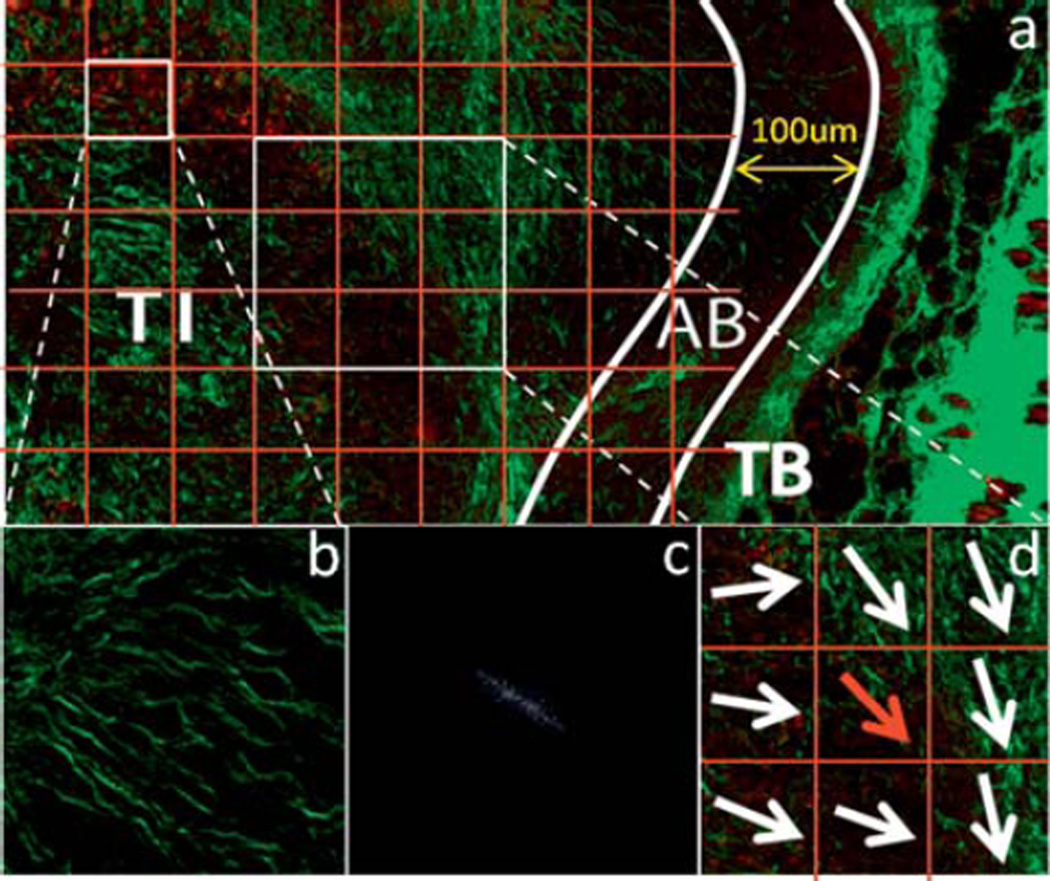
The edge where the tumor meets the muscle or skin was traced manually and the percentage of collagen of each line, which is parallel to the edge, is calculated. The width of the tumor boundary (TB) was defined as the depth where the percentage of collagen changes most between neighboring lines. The “area beneath the tumor boundary” (AB) demarcates the area 100 µm into the tumor, from the boundary. The core area of the tumor beneath AB was identified as the tumor interior (TI). The binary image of AB and TI was then divided into small blocks (Fig. 1a) and the overall collagen fiber orientation in each block (Fig. 1b) was calculated using the Fourier transform (Fig. 1c) as in [50]. The collagen fiber was characterized using two parameters, angle index (AI) and neighbor index (NI) similar to [1] (Fig. 1d). The angle index is quantified as the sum of the differences in the orientation of the index block to that of each of its neighbor blocks normalized to the number of neighbors used in the computation. The neighbor index refers to the number of non-parallel neighbor blocks, while a neighbor block is defined as non-parallel if the difference between its orientation angle and that of the index block is greater than a threshold of 30°. Different sizes of the block were evaluated, and it was found that the block size would not affect the quantification results of AI and NI when it is smaller than 100 pixels by 100 pixels. The angle index and the neighbor index were calculated for the TI and AB areas.
Figure 1.
Illustration of the quantification of angle index (AI) and neighbor index (NI). (a) The TI and AB areas are divided into 100 pixel by 100 pixel blocks. The representation of one block of SHG image which shows a majority direction is shown in (b) and its spectrum after Fourier transformation is illustrated in (c). The Fourier spectrum clearly indicates the overall direction of collagen in the block to be quantified. The AI and NI of each block are quantified according to the overall directions of the target block (red arrow) and of its eight neighbor blocks (d).
To calculate the resultant angle of the collagen fibers to the tumor surface in the AB area, the image was divided into 100 pixels by 100 pixel blocks. In each block, the collagen fiber network was extracted using the algorithm in [52]. The angle between each collagen fiber and tumor surface was calculated and a histogram was generated.
2.7 Statistical analysis
The analyses were performed using the Statistics toolbox in Microsoft Excel. p < 0.05 was considered statistically significant. Cell proliferation, drug resistance and tumor growth data were analyzed statistically by the Student t-test for two group comparisons. The quantification of percentage of high SHG intensity area, angle index and neighbor index were performed in MATLAB and the statistical significance was also calculated using a Student t-test.
3. Results
3.1 CICs are isolated from the invasive breast cancer cell line MX-1
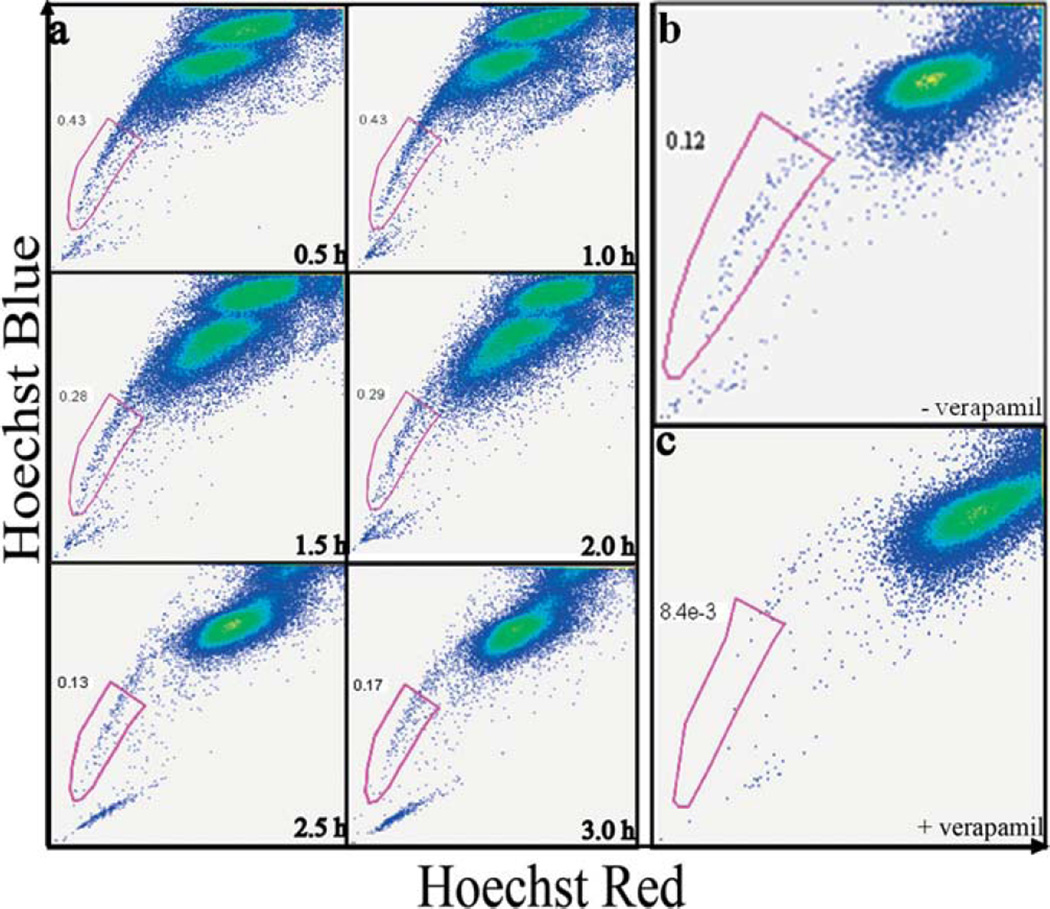
We incubated MX-1 cells with Hoechst 33342 to identify the optimal conditions for isolating CICs as side population that exhibit strong efflux properties pumping out small molecules such as drugs or dyes [29] (Fig. 2a). After 0.5 hr and 1 hr of staining, majority of the cells were still low in dye concentration resulting in a relatively high percentage (> 0.4%) of the side population or the tails in the dot-plots. This high percentage of side population should contain a mixture of the CICs that pump the dyes as well as the non-CICs that are poorly stained. After 1.5 hrs of staining the tail percentage dropped and after 2.5 hrs reached stable low percentage of < 0.3%. At this point, dye interaction with cells has reached a steady state and the side population should primarily contain the CICs that are pumping out the dye.
Figure 2.
CICs can be isolated from the cell line MX-1 using Side Population method. (a) Fluorescence activated cell sorting (FACS) dot plots showing CICs isolation from MX-1 cancer cell line at various time points. MX-1 cells were incubated with Hoechst 33342 nuclear dye for 0.5–3 hrs. The x-axis ‘Hoechst Red’ and y-axis ‘Hoechst Blue’ is the fluorescence at 675 nm and 450 nm respectively. At 2.5 hrs, the majority G0-G1-S population was saturated with the dye and the separation of the low and high fluorescence cells is evident. The low fluorescent population is collected as CICs. Verapamil, a molecular pumps inhibitor added along with Hoechst 33342 during incubation. FACS dot plots of MX-1 analysed without (b) and with (c) verapamil. Verapamil abolishes the side population, demonstrating that CICs can efflux dyes only through molecular pumps.
To investigate whether the side population as identified in Fig. 2a indeed contains primarily CICs with active drug transporters, we co-incubated verapamil (an ubiquitous ABC transporter inhibitor) along with Hoechst 33342 with the cells [53]. In the presence of verapamil, the side population was essentially abolished (less 15 folds), confirming that the side population that we have isolated indeed contains primarily the CICs that are pumping out dye through ABC transporters (Fig. 2b – c) [54].
3.2 MX-1 CICs are highly proliferative, forming tight colonies and can efflux doxorubicin and mitoxantrone
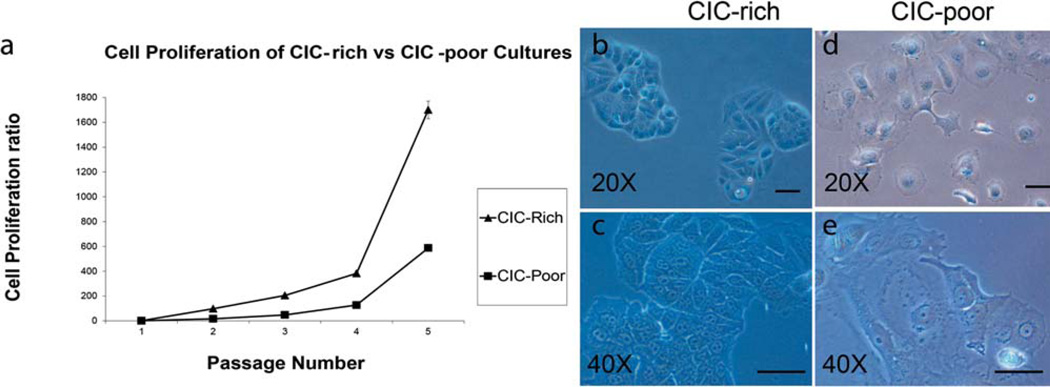
CICs are known to divide rapidly with clonal morphology in many tumors [12, 23]. We compared the rate of cell proliferation of the isolated side population (CICs) with the rest of the MX-1 cells (non-CICs) by culturing them over a period of 3 weeks (5 passages). When 20,000 cells were seeded, the side population could proliferate at a higher rate (doubling time of 36 hours) to yield 33 million cells, while the rest of the MX-1 cells could only yield 11.5 million cells (doubling time of 48 hours) (Fig. 3a). When seeded as single cells, the side population can repeatedly proliferate to form tight colonies (Fig. 3b, 3c) while the rest of the MX-1 cells proliferate less and exhibit a flat and spread morphology (Fig. 3d, 3e). The tight clonal morphology of the MX-1 side population is reminiscent of the CICs that can grow and divide even when anchoring poorly to substrata [12].
Figure 3.
CICs exhibit different morphology and proliferation properties compared to non-CICs. (a) A graph comparing the rate of proliferation of CIC-rich (triangle) with that of CIC-poor cultures (square). The isolated CICs and non-CICs were sub-cultured and counted over five passages. Light micrographs of CICs and non-CICs in culture, 7 days after isolation show that CICs form colonies with more 3D appearance shown at 20× and 40× magnification (b, c) while the non-CICs are more spread out and well attached to the substratum (d, e). Scale bar: 20 µm.
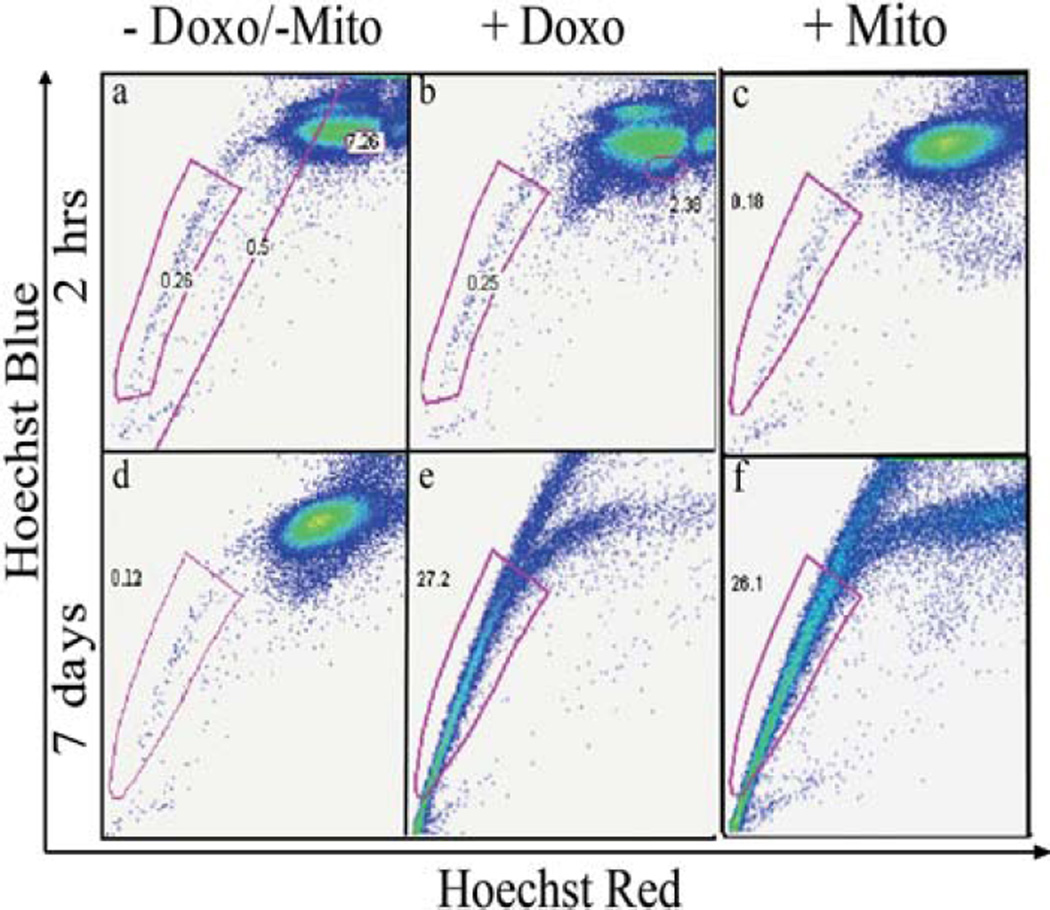
CICs have been shown to survive chemotherapeutic regimens by better efflux of the drug molecules [55, 56]. We assessed the drug resistance of the side population cells using a short-term (2 hrs) and long-term (7 days) doxorubicin and mitoxantrone exposure followed by staining and flow cytometry. In short-term exposure to drugs, the percentage of side population (< 0.3%) did not change significantly while the dye absorption and retention profiles of the non-CIC population were disrupted (Fig. 4a – c) consistent with the improved resistance of CICs to chemotherapy over non-CICs. After long-term drug exposure, the percentage of the non-CIC population was drastically reduced while the CIC-rich population now constitutes of > 25% of the total cell population (Fig. 4d – f) likely due to the selective survival of CICs in long-term chemotherapy further supporting that our isolated side population contains primarily CICs [16].
Figure 4.
CICs are more resistant to chemotherapeutic treatments. FACS dot plots of MX-1 cells treated with doxorubicin and mitoxantrone and stained with Hoechst showing changes in the CIC and non-CIC population. (a) and (d) are control groups without any chemotherapy treatment. (b) and (c) show that after a short-term treatment of 2 hrs, the CIC percentage remains unchanged while the non-CIC population is disrupted. (e) and (f) show that after long term treatment of 7 days, the non-CIC population is almost abolished and most of the surviving cells are able to efflux the Hoechst dye.
3.3 CICs are more tumorigenic in SCID mice models compared to non-CICs and SHG imaging and histology reveal tumor and stromal structures
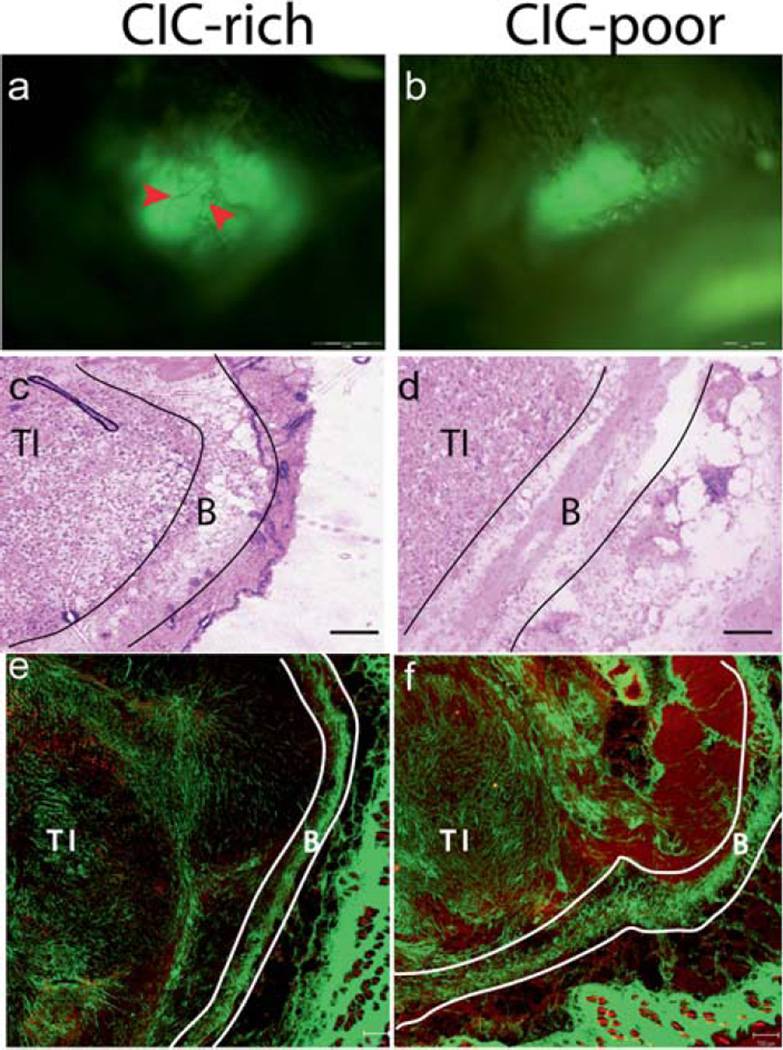
CICs are highly tumorigenic in animal models, where injecting very few CICs can result in tumor formation [10, 11, 13]. CICs and non-CICs were injected into animals, and tumor growth was observed using a whole animal imaging system (OV100, Olympus Corporation, Japan). In 8 weeks, all the animals injected with CICs formed tumors, while only one animal with non-CICs formed a single tumor despite injecting up to hundred folds more cells (Fig. 5a and b).
Figure 5.
CICs are more tumorigenic in SCID mice models compared to non-CICs. Whole animal imaging system imaging the GFP labelled MX-1 tumors in vivo. After 8 weeks, visible tumors were observed in all animals injected with CICs (a), and only one animal injected with non-CICs formed a tumor (b). The CIC-rich tumors were bigger than the CIC-poor tumor. Blood vessels were visualised in the CIC-rich tumor (red arrows) but not in the CIC-poor tumor. The H&E images of CIC-rich (c) and CIC-poor (d) tumors were acquired using a light microscope with a 10X objective. The SHG images of CIC-rich (e) and CIC-poor (f) tumors are tile scan images where several images taken with 10X objective are digitally stitched together. The red channel depicts the cells and the green channel the collagen. The tumor interior (TI), area beneath the boundary (AB) and tumor boundary (TB) are shown for the CIC-rich and CIC-poor tumors. Scale bar: 1 mm in (a) and (b), 50 µm in (c) and (d) 200 µm in (e) and (f).
The tumors in the CIC-rich cohort were large with well-developed structure with blood vessels. The only tumor in the CIC-poor cohort was barely visible under the animal’s skin. Histology images of CIC-rich and CIC-poor tumor sections are shown in Fig. 5c and d. The H&E stains showed well-developed tumor encapsulated by stromal boundary in all eight CIC-rich and the only one CIC-poor tumor. SHG imaging of tumor sections adjacent to the stained section provide both cellular and stromal information (Fig. 5e, 5f). The tumor interior (TI) and the stromal boundary (TB) are identified in both histology and SHG images. The ability of the cells isolated by side population technique to form well developed, large tumors from fewer injected cells confirm that the isolated cells are indeed CICs [10, 11, 13].
3.4 Second Harmonic Imaging of CIC-rich tumors reveal extensive collagen remodeling in the tumor interior
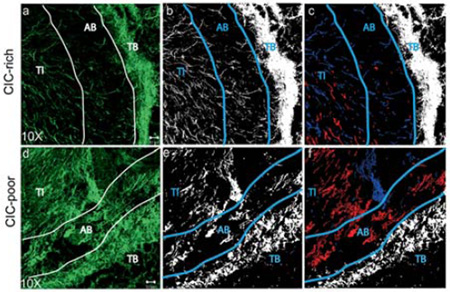
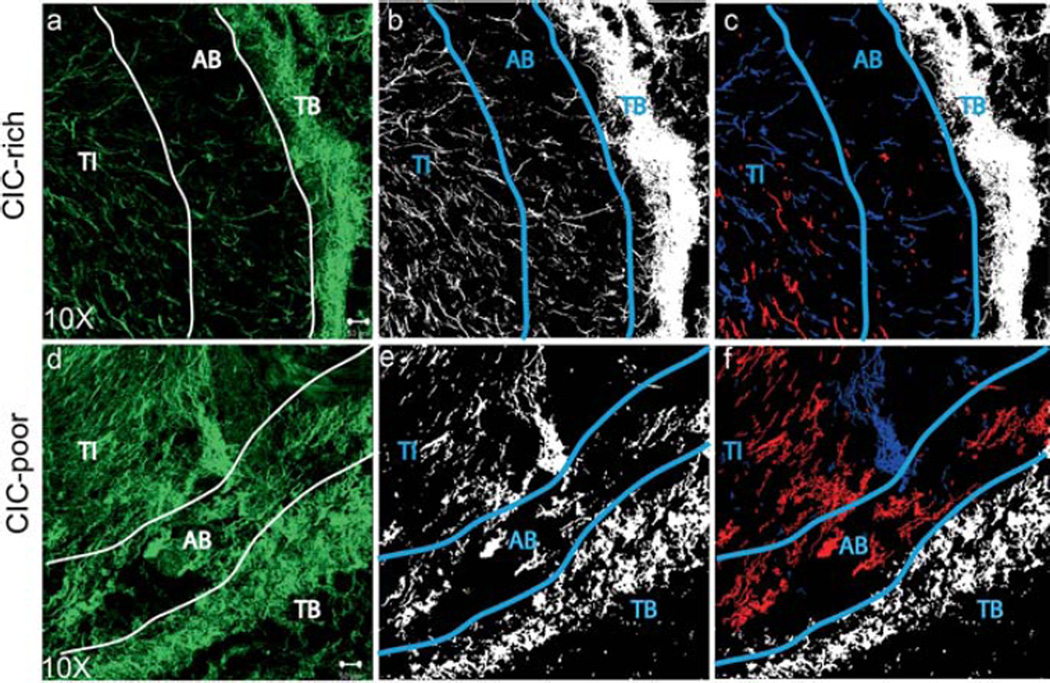
Second Harmonic Generation (SHG) imaging is a powerful tool for visualizing and quantifying fibrillar collagen in tissue samples without the need for staining [46, 57–59]. SHG imaging of tumor sections revealed a distinct difference in collagen distribution between the tumor boundary and the interior. The collagen fibers in the tumor boundary (TB) was bundled and coiled; and it was very difficult to distinguish individual collagen fibers. The collagen distribution in TB of both CIC-rich and CIC-poor tumors had similar appearance. The collagen fibers in the tumor interior (TI) were more distinct and individual fiber structures could be identified. The CIC-rich tumors had less collagen than the CIC-poor tumors (Fig. 6a, d).
Figure 6.
CIC-rich tumors remodel the collagen matrix more than CIC-poor tumors. Second Harmonic Generation (SHG) image stacks were acquired of the 40 µm thick sample and the projections of the green channel were reconstructed to show collagen structure in the tumor (a, d). The tumor interior (TI), area beneath the boundary (AB) and tumor boundary (TB) are shown. The collagen information was segmented and the pixels identified as collagen were given the value of 1 (white) and the pixels identified as background were given the value of 0 (black) (b, e). The collagen fibers in the AB region that are aligned at an angle lesser than 30° are pseudo-colored red, while those that are aligned at an angle greater than 60° are pseudo-colored blue (c, f). Scale bar: 50 µm.
In the area where the interior meets the boundary, there was a zone where collagen fibers were sparsely distributed. We identified this region as the area beneath the tumor boundary (AB). The collagen fibers in the AB region of CIC-rich tumors were sparse, well aligned and emanating from the tumor center, appearing perpendicular to the tumor boundary. The AB region of CIC-poor tumor had denser collagen fibers without preferential orientation. The fiber orientation of CIC-rich tumors is more evident after image segmentation (Fig. 6b, e) and pseudo-coloring the fibers perpendicular to the boundary in blue versus the fibers parallel to the boundary in red (Fig. 6c, f). The CIC-poor tumors have more fibers parallel to the boundary than the CIC-rich tumors.
3.5 Quantification of distinct collagen remodeling in MX-1 CIC-rich tumors
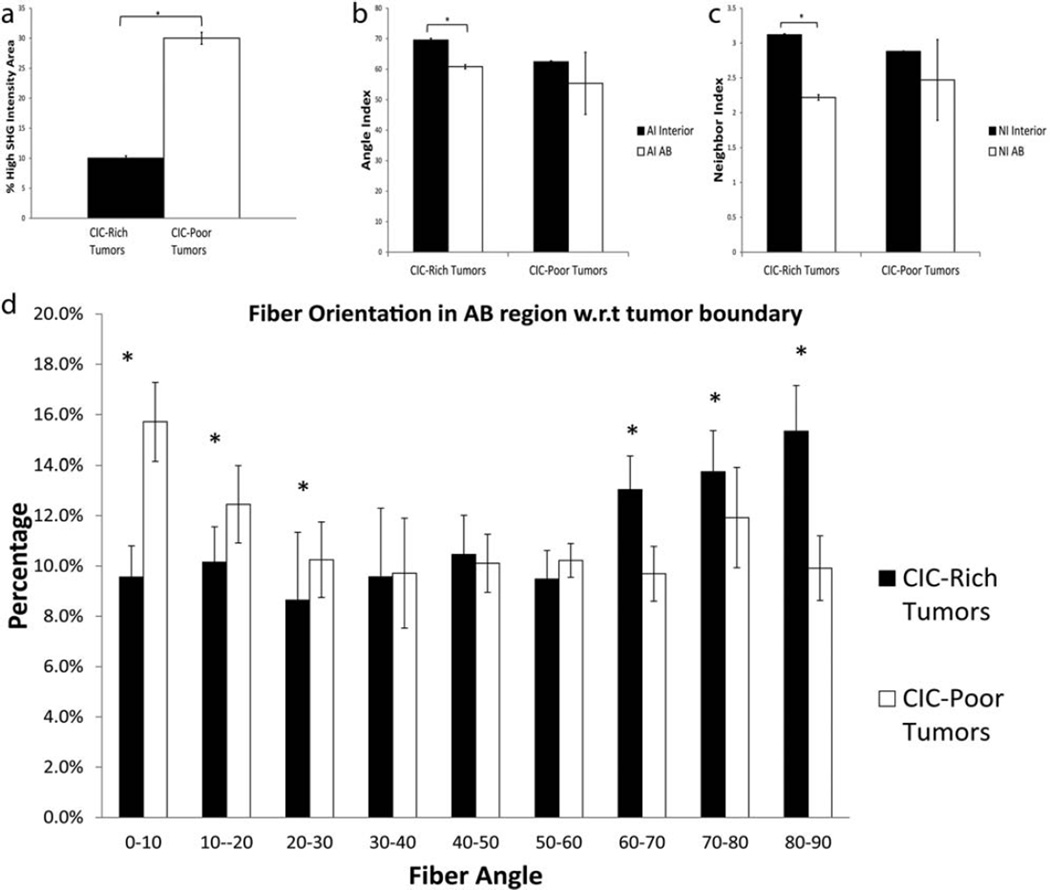
The collagen fiber distributions in CIC-rich and CIC-poor tumors were quantitatively analyzed using percentage of high SHG intensity area, angle index (AI), neighbor index (NI) and fiber angle. CIC-rich tumors had a percentage of high SHG intensity area of 10.02% ± 0.4%, and CIC-poor tumor 30% ± 1% in their tumor interiors (Fig. 7a) confirming that there are more active collagen remodeling in the interior of the CIC-rich tumors than the CIC-poor tumor.
Figure 7.
Collagen fibers in CIC-rich tumors are aligned perpendicular to the boundary. (a) Percentage of high SHG intensity area of CIC-rich (black bar) and CIC-poor tumors (white bar) was quantified as the ratio of the total collagen pixels in the tumor interior to the background. Angle Index (b) and Neighbor Index (c) of collagen fibers in the tumor interior (black bar) and the AB region (white bar) was quantified and compared for CIC-rich and CIC-poor tumors. The interior fiber orientation is significantly different from the AB region fiber orientation in CIC-rich tumors. The fiber orientation in the AB region with respect to the tumor boundary is shown in panel (d). The CIC-rich tumors (black bars) had significantly higher percentage of fibers oriented perpendicular to the tumor boundary, while the CIC-poor tumors (white bars) had significantly higher percentage of fibers oriented parallel to the tumor boundary. * indicate p < 0.05.
The angle and neighbor index in the TI and AB regions were quantified and compared. Angle index indicates the fiber alignment within a 100 × 100 pixel block with respect to its neighboring blocks; and the neighbor index indicates the number of misaligned neighbors. The higher the indices the more misaligned the fibers are with their neighbors. The AI and NI in CIC-rich TI was statistically higher than in the AB region, while in CIC-poor tumors there was no such differences (Fig. 7b, c). In CIC-rich tumors, the collagen fibers are more misaligned in the TI and they progressively have better alignment in the AB region. CIC-rich tumors seem to undergo differential remodeling of collagen near the tumor boundary whereas CIC-poor tumors do not. Thus, AI and NI in the AB region would be good morphological markers for the presence of CICs in tumors.
We also quantified the angle between individual collagen fibers in the AB region with respect to its boundary. 0° means that the fiber is parallel to the boundary and 90° means that it is perpendicular. The number of fibers aligned perpendicular to the boundary was significantly higher in the CIC-rich tumors, while the number of fibers aligned parallel to the boundary was significantly higher in the CIC-poor tumors (Fig. 7d). The collagen fibers aligning itself perpendicular to the tumor boundary has been shown to be a hallmark of tumor invasion and metastasis [60]. It is consistent that the CIC-rich tumors are remodeling their matrix extensively and aligning their fibers perpendicular to the boundary possibly as a step towards invasion and metastasis.
4. Discussion
The side population analysis technique was first established to study stem cell populations in the hematopoietic system [30]. The technique has been adopted to isolate CICs as both stem cells and CICs are able to efflux drug through molecular pumps such as the Multiple Drug Resistance (MDR) proteins, P-glycoprotein and ATP binding cassette (ABC) family transporters [54, 56]. These pumps can be ubiquitously blocked using drugs such as verapamil, cyclosporin and Fumitremorgin C. We have successfully isolated CICs from MX-1 cell line using the side population technique and confirmed the identity of CICs in the side population through abolition of the side population by verapamil. We further observed high level of cell proliferation and drug resistance of the side population consistent with their identity as the CICs.
The ability of CICs to recapitulate the entire population (both CICs and non-CICs), has been demonstrated as a hallmark of CICs [13]. When we analyzed the CICs after culturing it for three weeks, the population consisted of ~2% of CICs and ~98% non-CICs (data not shown). This asymmetric division of CICs is reminiscent of stem cells, where they remain the minority population, controlling and directing the proliferation of the non-CICs majority.
Drug resistance is the basis of cancer relapse where a few cancer cells can evade treatment and re-establish tumors at the primary site or metastasize to other organs. Prior studies on breast CICs have demonstrated their improved drug resistance [15, 16]. We tested drug resistance of the CICs using two commonly used chemotherapeutic drugs doxorubicin and mitoxantrone used in the treatment of meta-static breast cancers, non-Hodgkin’s lymphoma and acute myeloid leukaemia (AML). We demonstrated that CICs are resistant to both doxorubicin and mitoxantrone. After 7 days of culture with the chemotherapeutic drugs, we found that >25% of the cells survived were CICs. This increase in CICs may be due to the CIC’s proliferation in culture even in the presence of doxorubicin or mitoxantrone, or due to the drug transporters enabling them to efflux more drugs efficiently. It is evident that the CICs are able to survive the onslaught of chemotherapy better than the non-CICs.
The ability to generate tumors in animal models in small numbers is another hallmark of CICs [10–12]. When we injected 100,000 CICs and 10 million non-CICs cells into the animals, all CIC-injected animals developed tumors, but only one non-CICs injected animal formed a single tumor despite injecting up to hundred folds more non-CICs. In an ovarian cancer study it was also demonstrated that the non-CICs were able to form a tumor only because there was a contamination of non-CICs with some CICs [61].
CIC’s collagen remodeling activity was visualized ex-vivo using SHG imaging. CIC-rich tumors had a distinct collagen distribution. Their percentage of high SHG intensity area was lower than seen in CIC-poor tumors; the fiber alignment changed significantly from the interior to the boundary and most of the fibers beneath the tumor boundary were aligned perpendicular to the boundary. Prior studies have demonstrated qualitative SHG imaging of collagen in cancer models in melanoma, breast cancer, cervical and ovarian cancers [43–45]. Very few groups have reported collagen visualization in the tumor interior even though there are many reports on the study of the tumor boundaries where collagen is more abundant [60, 62]. Collagen both in the tumor interior and boundary was clearly visualized in this study due to the improved performance of the pulse modulated SH imaging system employed.
Wolf et al. [63] described three dimensional movements of cancer cells through in vitro 3D collagen matrices. The in vitro imaging of cancer cell invasion is useful to observe how individual cancer cells change their morphology as well as their surrounding matrix. However, several other factors come into play when the cancer cells are growing in a solid tumor such as vascularization and other cell types in the tumor. The importance of studying cancer-matrix interactions in vivo was demonstrated by Provenzano et al. [60] describing the tumor associated collagen signatures where the collagen density above and around the tumor is increased and the collagen fibers in the non-invading areas were aligned parallel to the boundary. Keely et al. [62] described tumor-associated collagen signatures at tumor-host tissue interface where fibers were perpendicular to the surrounding host tissue at invading regions of the tumors.
The significant reduction of angle index and neighbor index from the CIC-rich tumor interior to the boundary shows that the fibers, which are more disorderly in the tumor interior, start to align themselves towards the boundary. This realignment process is not detected in CIC-poor tumors. In the interface of the tumor interior and boundary, more than 40% of the collagen fibers are aligned perpendicular to the boundary in CIC-rich tumors. This observation is reminiscent of the invading tumor phenotype in the work of Keely et al. [62]. The manifestation of this phenotype might be related to CIC’s higher migratory and invasive potential.
CIC-rich tumors profoundly remodel the collagen in the AB region as compared to the CIC-poor tumors. It would be impractical to directly visualize CICs with high degree of confidence in tissue samples since CICs represent a rare cell population; however, the impact of CICs on the ECM in the AB region of the tumors is significant and can be quantified. Such distinct CIC-associated collagen signatures would potentially help clinicians to ascertain the presence of CICs in a tumor mass and help surgeons to identify hotspots of CIC invasion for removal, and guide follow-up radiotherapy.
5. Conclusions
We have demonstrated that CICs can be isolated from a breast cancer cell line MX-1, exhibiting high rate of cell proliferation, drug efflux, drug resistance and tumorigenesis. The CIC-rich tumors can actively remodel the collagen in the tumor interior leaving behind sparse collagen fibers, and preferentially align the fibers in AB region perpendicular to the boundary. These patterns of collagen fibers in CIC-rich tumors can be quantified with SHG microscopy and analyzed as CIC-associated collagen signatures in animal models and human samples. With such amplified CIC signatures, clinicians might be able to assess the presence and distribution of CICs in patient samples to aid the design of appropriate treatment regimens.
Supplementary Material
Acknowledgments
This work is supported in part by the National Research Foundation Singapore, through the Singapore MIT Alliance for Research and Technology (SMART) Centre’s BioSyM IRG research programme to PS and HY, the Institute of Bioengineering and Nanotechnology, Biomedical Research Council, A*STAR; grants from Janssen, and Mechanobiology Institute, Singapore to HY, NIH −5-P41-EB015871-27, DP3-DK101024 01, 1-U01-NS090438-01, 1-R01-EY017656 −0,6A1, 1-R01-HL121386-01A1, the Singapore-MIT Alliance 2, and the MIT Skoltech Initiative and the Koch Institute for Integrative Cancer Research Bridge Initiative to PS, the National Natural Science Foundation of China (61275006 and 61335011) and the Natural Science Foundation for Distinguished Young Scholars of Fujian Province (2014J06016) to SZ. SZ is a SMART postdoctoral fellow.
Footnotes
Author biographies Please see Supporting Information online.
References
- 1.Clarke MF, Fuller M. Cell. 2006;124:1111–1115. doi: 10.1016/j.cell.2006.03.011. [DOI] [PubMed] [Google Scholar]
- 2.Molyneux G, Regan J, Smalley MJ. Cellular and Molecular Life Sciences. 2007;64:3248–3260. doi: 10.1007/s00018-007-7391-5. [DOI] [PMC free article] [PubMed] [Google Scholar]
- 3.Eyler CE, Rich JN. Journal of Clinical Oncology. 2008;26:2839–2845. doi: 10.1200/JCO.2007.15.1829. [DOI] [PMC free article] [PubMed] [Google Scholar]
- 4.Lapidot T, Sirard C, Vormoor J, Murdoch B, Hoang T, Cacerescortes J, Minden M, Paterson B, Caligiuri MA, Dick JE. Nature. 1994;367:645–648. doi: 10.1038/367645a0. [DOI] [PubMed] [Google Scholar]
- 5.Bonnet D, Dick JE. British Journal of Haematology. 1996;93:553–553. [Google Scholar]
- 6.Vassilopoulos A, Wang RH, Petrovas C, Ambrozak D, Koup R, Deng CX. International Journal of Biological Sciences. 2008;4:133–142. doi: 10.7150/ijbs.4.133. [DOI] [PMC free article] [PubMed] [Google Scholar]
- 7.Singh SK, Hawkins C, Clarke ID, Squire JA, Bayani J, Hide T, Henkelman RM, Cusimano MD, Dirks PB. Nature. 2004;432:396–401. doi: 10.1038/nature03128. [DOI] [PubMed] [Google Scholar]
- 8.Pohl A, Lurje G, Kahn M, Lenz HJ. Clinical Colorectal Cancer. 2008;7:92–98. doi: 10.3816/CCC.2008.n.012. [DOI] [PubMed] [Google Scholar]
- 9.Lee CJ, Dosch J, Simeone DM. Journal of Clinical Oncology. 2008;26:2806–2812. doi: 10.1200/JCO.2008.16.6702. [DOI] [PubMed] [Google Scholar]
- 10.Al-Hajj M, Wicha MS, Benito-Hernandez A, Morrison SJ, Clarke MF. Proceedings of the National Academy of Sciences of the United States of America. 2003;100:3983–3988. doi: 10.1073/pnas.0530291100. [DOI] [PMC free article] [PubMed] [Google Scholar]
- 11.Hirschmann-Jax C, Foster AE, Wulf GG, Nuchtern JG, Jax TW, Gobel U, Goodell MA, Brenner MK. Proceedings of the National Academy of Sciences of the United States of America. 2004;101:14228–14233. doi: 10.1073/pnas.0400067101. [DOI] [PMC free article] [PubMed] [Google Scholar]
- 12.Ponti D, Costa A, Zaffaroni N, Pratesi G, Petrangolini G, Coradini D, Pilotti S, Pierotti MA, Daidone MG. Cancer Research. 2005;65:5506–5511. doi: 10.1158/0008-5472.CAN-05-0626. [DOI] [PubMed] [Google Scholar]
- 13.Chiba T, Kita K, Zheng YW, Yokosuka O, Saisho H, Iwama A, Nakauchi H, Taniguchi H. Hepatology. 2006;44:240–251. doi: 10.1002/hep.21227. [DOI] [PubMed] [Google Scholar]
- 14.Sheridan C, Kishimoto H, Fuchs RK, Mehrotra S, Bhat-Nakshatri P, Turner CH, Goulet R, Badve S, Nakshatri H. Breast Cancer Research. 2006;8(5):R59. doi: 10.1186/bcr1610. [DOI] [PMC free article] [PubMed] [Google Scholar]
- 15.Li XX, Lewis MT, Huang J, Gutierrez C, Osborne CK, Wu MF, Hilsenbeck SG, Pavlick A, Zhang XM, Chamness GC, Wong H, Rosen J, Chang JC. Journal of the National Cancer Institute. 2008;100:672–679. doi: 10.1093/jnci/djn123. [DOI] [PubMed] [Google Scholar]
- 16.Rottenberg S, Nygren AOH, Pajic M, van Leeuwen FWB, van der Heijden I, van de Wetering K, Liu XL, Visser KEC, Gilhuijs KG, Van Tellingen O, Schouten JP, Jonkers J, Borst P. Proceedings of the National Academy of Sciences of the United States of America. 2007;104:12117–12122. doi: 10.1073/pnas.0702955104. [DOI] [PMC free article] [PubMed] [Google Scholar]
- 17.Phillips TM, McBride WH, Pajonk F. Journal of the National Cancer Institute. 2006;98:1777–1785. doi: 10.1093/jnci/djj495. [DOI] [PubMed] [Google Scholar]
- 18.Wiseman BS, Werb Z. Science. 2002;296:1046–1049. doi: 10.1126/science.1067431. [DOI] [PMC free article] [PubMed] [Google Scholar]
- 19.McSherry EA, Donatello S, Hopkins AM, McDonnell S. Cellular and Molecular Life Sciences. 2007;64:3201–3218. doi: 10.1007/s00018-007-7388-0. [DOI] [PMC free article] [PubMed] [Google Scholar]
- 20.Guise T. Seminars in Oncology. 2010;37:S2–S14. doi: 10.1053/j.seminoncol.2010.10.007. [DOI] [PubMed] [Google Scholar]
- 21.Cichon MA, Degnim AC, Visscher DW, Radisky DC. Journal of Mammary Gland Biology and Neoplasia. 2010;15:389–397. doi: 10.1007/s10911-010-9195-8. [DOI] [PMC free article] [PubMed] [Google Scholar]
- 22.Dvorak HF, Weaver VM, Tlsty TD, Bergers G. Journal of Surgical Oncology. 2011;103:468–474. doi: 10.1002/jso.21709. [DOI] [PMC free article] [PubMed] [Google Scholar]
- 23.Sztiller-Sikorska M, Koprowska K, Jakubowska J, Zalesna I, Stasiak M, Duechler M, Czyz ME. Melanoma Research. 2012;22:215. doi: 10.1097/CMR.0b013e3283531317. [DOI] [PubMed] [Google Scholar]
- 24.Wallace JA, Li F, Leone G, Ostrowski MC. Cancer Research. 2011;71:1203–1207. doi: 10.1158/0008-5472.CAN-10-3263. [DOI] [PMC free article] [PubMed] [Google Scholar]
- 25.Pitteri SJ, Kelly-Spratt KS, Gurley KE, Kennedy J, Buson TB, Chin A, Wang H, Zhang Q, Wong CH, Chodosh LA, Nelson PS, Hanash SM, Kemp CJ. Cancer Research. 2011;71:5090–5100. doi: 10.1158/0008-5472.CAN-11-0568. [DOI] [PMC free article] [PubMed] [Google Scholar]
- 26.Sleeman JP, Cremers N. Clinical & Experimental Metastasis. 2007;24:707–715. doi: 10.1007/s10585-007-9122-6. [DOI] [PubMed] [Google Scholar]
- 27.Wu YJ, Wu PY. Stem Cells and Development. 2009;18:1127–1134. doi: 10.1089/scd.2008.0338. [DOI] [PubMed] [Google Scholar]
- 28.Marhaba R, Klingbeil P, Nuebel T, Nazarenko I, Buechler MW, Zoeller M. Current Molecular Medicine. 2008;8:784–804. doi: 10.2174/156652408786733667. [DOI] [PubMed] [Google Scholar]
- 29.Hemmati HD, Nakano I, Lazareff JA, Masterman-Smith M, Geschwind DH, Bronner-Fraser M, Kornblum HI. Proceedings of the National Academy of Sciences of the United States of America. 2003;100:15178–15183. doi: 10.1073/pnas.2036535100. [DOI] [PMC free article] [PubMed] [Google Scholar]
- 30.Goodell MA, Brose K, Paradis G, Conner AS, Mulligan RC. Journal of Experimental Medicine. 1996;183:1797–1806. doi: 10.1084/jem.183.4.1797. [DOI] [PMC free article] [PubMed] [Google Scholar]
- 31.Yang M, Zhang R, Yan M, Ye ZX, Liang W, Luo ZJ. Biochemical and Biophysical Research Communications. 2010;391:1062–1066. doi: 10.1016/j.bbrc.2009.12.020. [DOI] [PubMed] [Google Scholar]
- 32.Wu C, Alman BA. Cancer Letters. 2008;268:1–9. doi: 10.1016/j.canlet.2008.03.048. [DOI] [PubMed] [Google Scholar]
- 33.Komuro H, Saihara R, Shinya M, Takita J, Kaneko S, Kaneko M, Hayashi Y. Journal of Pediatric Surgery. 2007;42:2040–2045. doi: 10.1016/j.jpedsurg.2007.08.026. [DOI] [PubMed] [Google Scholar]
- 34.Jakubikova J, Adamia S, Kost-Alimova M, Klippel S, Cervi D, Daley JF, Cholujova D, Kong SY, Leiba M, Blotta S, Ooi M, Delmore J, Laubach J, Richardson PG, Sedlak J, Anderson KC, Mitsiades CS. Blood. 2011;117:4409–4419. doi: 10.1182/blood-2010-02-267344. [DOI] [PMC free article] [PubMed] [Google Scholar]
- 35.Sung JM, Cho HJ, Yi H, Lee CH, Kim HS, Kim DK, Ei-Aty AMA, Kim JS, Landowski CP, Hediger MA, Shin HC. Biochemical and Biophysical Research Communications. 2008;371:163–167. doi: 10.1016/j.bbrc.2008.04.038. [DOI] [PubMed] [Google Scholar]
- 36.Lichtenauer UD, Shapiro I, Geiger K, Quinkler M, Fassnacht M, Nitschke R, Ruckauer KD, Beuschlein F. Endocrinology. 2008;149:1314–1322. doi: 10.1210/en.2007-1001. [DOI] [PubMed] [Google Scholar]
- 37.Tirino V, Camerlingo R, Franco R, Malanga D, La Rocca A, Viglietto G, Rocco G, Pirozzi G. European Journal of Cardio-Thoracic Surgery. 2009;36:446–453. doi: 10.1016/j.ejcts.2009.03.063. [DOI] [PubMed] [Google Scholar]
- 38.Alama A, Orengo AM, Ferrini S, Gangemi R. Drug discovery today. 2011 doi: 10.1016/j.drudis.2011.02.005. [DOI] [PubMed] [Google Scholar]
- 39.Mueller M, Hermann P, Heeschen C. Frontiers in bioscience (Elite edition) 2010;2:602. doi: 10.2741/e117. [DOI] [PubMed] [Google Scholar]
- 40.Saha S, Lo PK, Duan X, Chen H, Wang Q. Integr Biol (Camb) 2012;4:897–904. doi: 10.1039/c2ib20034a. [DOI] [PubMed] [Google Scholar]
- 41.Kikuchi K, Li X, Zheng Y, Takano Y. FEBS letters. 2011;585:286–290. doi: 10.1016/j.febslet.2010.12.010. [DOI] [PubMed] [Google Scholar]
- 42.Provenzano PP, Rueden CT, Trier SM, Yan L, Ponik SM, Inman DR, Keely PJ, Eliceiri KW. Journal of Biomedical Optics. 2008;13 doi: 10.1117/1.2940365. 00–00. [DOI] [PubMed] [Google Scholar]
- 43.Zhuo S, Chen J, Luo T, Jiang X, Xie S, Chen R. Lasers in medical science. 2008 doi: 10.1007/s10103-008-0570-2. [DOI] [PubMed] [Google Scholar]
- 44.Kirkpatrick ND, Brewer MA, Utzinger U. Cancer Epidemiology Biomarkers & Prevention. 2007;16:2048–2057. doi: 10.1158/1055-9965.EPI-07-0009. [DOI] [PubMed] [Google Scholar]
- 45.Brown E, McKee T, diTomaso E, Pluen A, Seed B, Boucher Y, Jain RK. Nature Medicine. 2003;9:796–800. doi: 10.1038/nm879. [DOI] [PubMed] [Google Scholar]
- 46.Raja AM, Xu S, Sun W, Zhou J, Tai DC, Chen C-S, Rajapakse JC, So PT, Yu H. Journal of Biomedical Optics. 2010;15 doi: 10.1117/1.3497565. 056016-056016-056011. [DOI] [PubMed] [Google Scholar]
- 47.Lillie RD. Histopathologic technic and practical histochemistry. 1954 [Google Scholar]
- 48.Carson C, Belongie S, Greenspan H, Malik J. Pattern Analysis and Machine Intelligence, IEEE Transactions on. 2002;24:1026–1038. [Google Scholar]
- 49.Dempster AP, Laird NM, Rubin DB, Journal of the Royal Statistical Society. Series B. 1977;39:1–38. [Google Scholar]
- 50.Xia Y, Elder K. Journal of Microscopy-Oxford. 2001;204:3–16. doi: 10.1046/j.1365-2818.2001.00925.x. [DOI] [PubMed] [Google Scholar]
- 51.Reiser KM, Bratton C, Yankelevich DR, Knoesen A, Rocha-Mendoza I, Lotz J. Journal of Biomedical Optics. 2007;12(6) doi: 10.1117/1.2812631. 064019/1-7. [DOI] [PubMed] [Google Scholar]
- 52.Stein AM, Vader DA, Jawerth LM, Weitz DA, Sander LM. Journal of Microscopy. 2008;232:463–475. doi: 10.1111/j.1365-2818.2008.02141.x. [DOI] [PubMed] [Google Scholar]
- 53.Keizer HG, Joenje H. Journal of the National Cancer Institute. 1989;81:706–709. doi: 10.1093/jnci/81.9.706. [DOI] [PubMed] [Google Scholar]
- 54.Hu C, Li H, Li J, Zhu Z, Yin S, Hao X, Yao M, Zheng S, Gu J. Carcinogenesis. 2008;29:2289–2297. doi: 10.1093/carcin/bgn223. [DOI] [PubMed] [Google Scholar]
- 55.Vinogradov S, Wei X. Nanomedicine. 2012;7:597–615. doi: 10.2217/nnm.12.22. [DOI] [PMC free article] [PubMed] [Google Scholar]
- 56.Shervington A, Lu C. Cancer investigation. 2008;26:535–542. doi: 10.1080/07357900801904140. [DOI] [PubMed] [Google Scholar]
- 57.Sun W, Chang S, Tai DC, Tan N, Xiao G, Tang H, Yu H. Journal of Biomedical Optics. 2008;13 doi: 10.1117/1.3041159. 064010-064010-064017. [DOI] [PubMed] [Google Scholar]
- 58.Tai DC, Tan N, Xu S, Kang CH, Chia SM, Cheng CL, Wee A, Wei CL, Raja AM, Xiao G. Journal of Biomedical Optics. 2009;14 doi: 10.1117/1.3183811. 044013-044013-044010. [DOI] [PubMed] [Google Scholar]
- 59.He YT, Kang CH, Xu SY, Tuo XY, Trasti S, Tai DCS, Raja AM, Peng QW, So PTC, Rajapakse JC, Welsch R, Yu H. Journal of Biomedical Optics. 2010;15(5):056007. doi: 10.1117/1.3490414. [DOI] [PubMed] [Google Scholar]
- 60.Provenzano PP, Eliceiri KW, Campbell JM, Inman DR, White JG, Keely PJ. Bmc Medicine. 2006;4 doi: 10.1186/1741-7015-4-38. 00–00. [DOI] [PMC free article] [PubMed] [Google Scholar]
- 61.Szotek PP, Pieretti-Vanmarcke R, Masiakos PT, Dinulescut DM, Connolly D, Foster R, Dombkowski D, Preffer F, MacLaughlin DT, Donahoe PK. Proceedings of the National Academy of Sciences of the United States of America. 2006;103:11154–11159. doi: 10.1073/pnas.0603672103. [DOI] [PMC free article] [PubMed] [Google Scholar]
- 62.Provenzano PP, Inman DR, Eliceiri KW, Knittel JG, Yan L, Rueden CT, White JG, Keely PJ. BMC Medicine. 2008;6:11. doi: 10.1186/1741-7015-6-11. [DOI] [PMC free article] [PubMed] [Google Scholar]
- 63.Wolf K, Friedl P. Clinical & Experimental Metastasis. 2009;26:289–298. doi: 10.1007/s10585-008-9190-2. [DOI] [PubMed] [Google Scholar]
Associated Data
This section collects any data citations, data availability statements, or supplementary materials included in this article.


