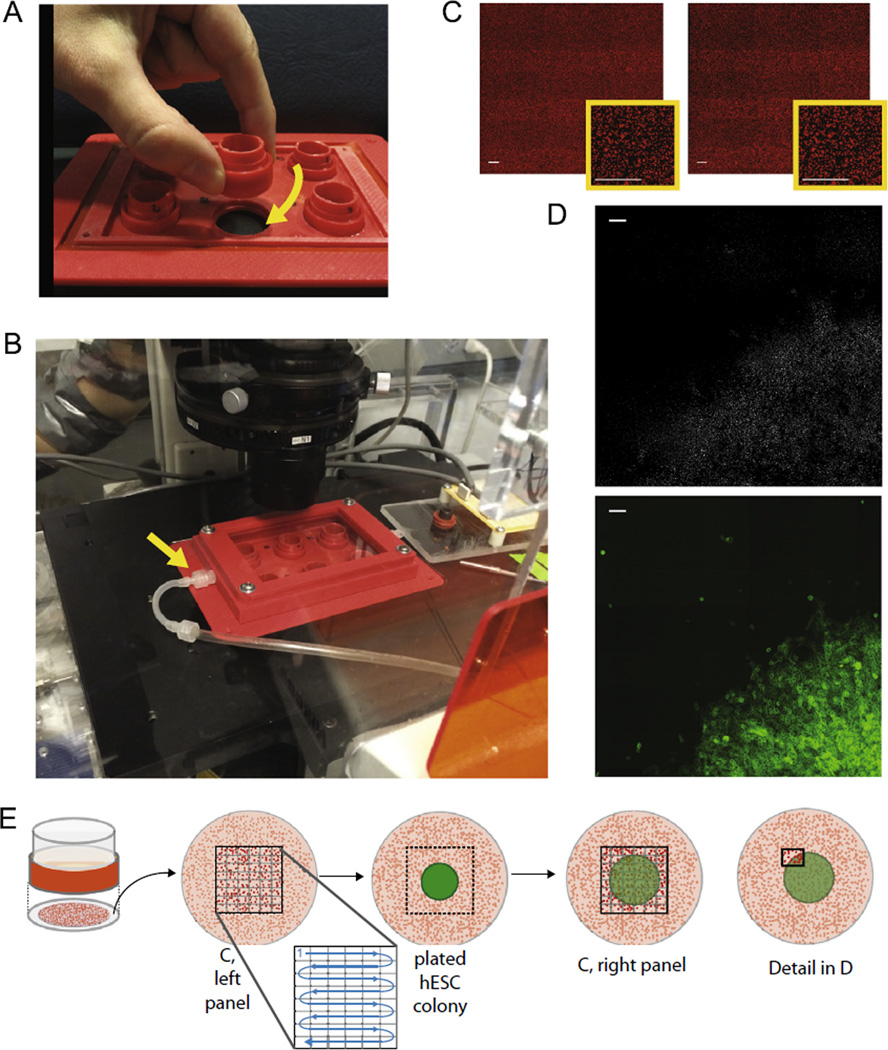
Fig. 4.
Stage insert and microscope setup for gathering traction force images prior to plating cells. (A) Photograph of 6-well assembly for culture and microscopy of consistently centered colonies on traction force gels. Cassettes have threads to screw firmly into stage insert. (B) Fully assembled stage insert with environmental control lid inserted into microscope. Arrow indicates connection to CO2 input line. (C) Bead images before (left) and after (right) plating cells. All scale bars = 100 µm. (D) The subtracted image indicating changes in bead location from large bead plots shown in (C). Bottom panel displays corresponding cell location via a MUC1-venus membrane marker. Scale bars = 100 µm. (E) Diagram showing where and when bead images are taken in the context of the gel and cell colony. Images are taken sequentially across a grid before and after colonies are plated.

