

Abstract
AIM
To characterize the pattern of intraocular pressure (IOP) change and the deficit of retinal ganglion cells (RGCs) in DBA2J, which is most well-characterized chronic glaucoma mouse model and wild type (WT) C57bl/6 mice, and to study the relationship between IOP change and RGCs deficit.
METHODS
IOP was monitored with a rebound tonometer in WT C57bl/6 and DBA2J mice from 3 to 15-month-old. Retinal function was evaluated by dark-adapted electroretinogram (ERG) in DBA2J and WT mice of 15-month-old. A dye (Neurobiotin) was applied to optic nerve stump to retrograde label RGCs. TO-PRO-3 visualized all nuclei of cells in the RGC layer.
RESULTS
The IOP in WT mice was 9.03±0.6 mm Hg on average and did not increase significantly as aging. The IOP in DBA2J mice, arranging from 7.2 to 28 mm Hg, was increasing significantly as aging, and it was normal at 3-month-old compared with WT mice, slightly increased from 7-month-old and increased in 50% animals at 11-month-old and in 38% animals at 15-month-old. The RGCs density in DBA2J mice started reducing by 7-month-old, continuously decreased until reached about 20% of RGC in WT retina by 15-month-old. RGC density was not linearly correlated with IOP in 15-month-old DBA2J mice. The amplitude of positive scotopic threshold response, and negative scotopic threshold response of ERG were significantly reduced in DBA2J mice of 15-month-old than that in age-paired WT mice.
CONCLUSION
The present study found that DBA2J mice display pathological and functional deficits of the retina that was not linearly correlated with IOP.
Keywords: retinal ganglion cell, glaucoma, intraocular pressure, retina, mouse
INTRODUCTION
Glaucoma is a group of ocular disorders associated with elevated intraocular pressure (IOP) and death of retinal ganglion cells (RGCs) and optic nerve degeneration[1]. Ganglion cells collect all the information from the retina and carry it out of the eye on their axons through the optic nerve head to the brain. More than 60 million people have glaucoma, the second most common cause of blindness worldwide[2]. There is currently no cure for the disease, although medical and surgical treatments that decrease IOP may slow the rate of optic nerve damage[3]. However, not all glaucoma patients respond equally to the decreasing IOP treatment[4]. Some glaucoma patients who have advanced retinal and optic nerve defect don't have remarked increase of IOP, while some other glaucoma patients who have significantly increased IOP don't have severe retinal and optic nerve defect[5]–[6]. According to the ocular hypertension treatment study, 4.4% patients with ocular hypertension who have no clinical signs of glaucomatous damage to optic nerve or visual field at beginning of trial, still developed signs of glaucoma after 5y of lowering IOP treatment[7]. More studies are needed about whether IOP should be considered to account for the onset of the pathogenesis in all forms of glaucoma or just as a diagnostic risk marker.
Animal models have proven helpful for investigating the mechanistic basis of complex diseases. The most well-characterized glaucoma mouse model is the DBA2J mouse that develops pigment dispersion and elevated IOP and ultimately degeneration of optic nerve[8]–[10]. The DBA2J mice carry mutations in GPNMB and Tyrp1 gene that leads to iris pigment dispersion and stromal atrophy. As a consequence, the mice tend to develop an IOP elevation due to a synechiae between iris and/or cornea and lens[11]–[12]. It is considered as a preferred chronic glaucoma model because it shares similarities with primary open angle glaucoma (POAG). DBA2J mice are receiving increasing attention because it can be used to gain better understanding of the complex nature of the glaucoma and to design specific treatments to prevent death of RGCs and their axons.
In the present research study, we characterized the IOP change pattern and deficit of inner retinal neurons, RGCs, in the glaucoma mouse models (the DBA2J mice), and studied the relationship between IOP changes and RGCs deficit.
MATERIALS AND METHODS
Animal Preparations
DBA2J mice and wild type (WT) C57bl/6 mice were purchased from the Jackson Laboratories (Bar Harbor, Maine, USA). Animals were handled in accordance with the policies on treatment of laboratory animals of Baylor College of Medicine and the National Institutes of Health. The procedures of dissection and recording were described in previous publications[13]–[14].
Intraocular Pressure Measurement
IOP was measured with a rebound tonometer (Tonolab, Icare, Espoo, Finland) once per week. Animals were kept in a holding room maintained at 68°F to 72°F with a light-dark cycle of 12h light and 12h dark. For all animals, IOP was measured with a tonometer in right eyes once per week for 3 to 15mo of age in eight WT and eight DBA2J animals[15]. To minimize variability, all IOP readings were taken at the same time of day (beginning at 9 a.m.), on the same days of the week (Tuesday), and cages were tested in the same order at each session. Before measurement, the animals were anesthetized briefly with inhaled isoflurane so that they did not require restraint during measurement. Animals were placed on their stomachs and the IOP reading obtained from the central cornea of each eye. The tonometer reports as the IOP an average of 3 measurements. The average of at least two such readings (6 measurements) was considered to be the IOP.
Retrograde Labeling of Retinal Ganglion Cells in the Retinal Ganglion Cell Layers
A dye (Neurobiotin, NB) was applied to optic nerve stumps of the mice for retrograde labelling of GCs. The detailed procedures were described in previous paper[16]. To briefly describe, the nerve stump was first dipped into the 2 µL internal solution that contained 8% NB for 30min. Afterward, the eyeball was rinsed extensively with external solution and then was dissected. The eye cup with intact retina and sclera tissue was transferred into fresh oxygenated Ames medium and kept at room temperature for 40min. Then, the whole retinas were rinsed and fixed in 4% paraformaldehyde (Electron Microscopy Sciences, Fort Hatfield, PA, USA) and 0.5% glutaraldehyde (Sigma-Aldrich) in phosphate buffer (D-PBS, pH 7.4; Invitrogen, Carlsbad, CA, USA), for 30 to 45min in room temperature. Then, the whole retinas were incubated in the secondary antibody of Cy3-conjugated streptavidin (1:200; Jackson Immuno Research) in 3% normal donkey serum-TBS for 1d at 4°C. The cells labeled by NB were recognized as RGCs. A fluorescent nuclear dye, TO-PRO-3 (1: 3000; Molecular Probe, Eugene, OR, USA), was used to visualize all nuclei in the retinas.
The fluorescent retinas were visualized with the confocal laser-scanning microscope (Zeiss, NY, USA). Images were acquired using the 20× objective lenses and scanned with 512×512 pixels. To obtain quantitative numbers of neurons in the RGC layer, stacked images through the RGC layer were taken from the central zone and peripheral zone of the retina. All cells were counted manually in this study. The cell density and distribution pattern were presented as mean±standard deviation. Each central retinal zone and peripheral retinal zone represents the confocal image of a 320 µm×320 µm patch of retina which is 500 µm and 1500 µm away from the optical nerve head respectively, in the dorsal, ventral, nasal and temporal retinas. The reported average number of cell density is the average of 4 central and 4 peripheral retinal zones. For 3, 7 or 11-month-old, data of 4 retinas per group were averaged. For 15-month-old, data of 8 retinas per group were averaged that were also recorded electroretinogram (ERG) and IOP.
Electroretinogram Recording
Animals were anesthetized with an intraperitoneal injection of ketamine (70 mg/kg) and xylazine (7 mg/kg), and anesthesia was maintained with subcutaneous injections of ketamine (20 mg/kg) and xylazine (1 mg/kg) every 20-30min. Dark-adapted (DA) full-field flash ERGs were recorded differentially between the two eyes. Pupils were fully dilated with topical atropine 0.5% and phenylephrine 2.5%. Body temperature was maintained between 36.5°C and 37°C with a thermostatically controlled blanket (CWE Inc.). For DA ERG, animals were prepared for recording under red illumination (LED, λ>620 nm). Signals were amplified with a grass P122 amplifier, band pass 0.1 to 1000 Hz (Grass Instruments, West Warwick, RI, USA). Data were acquired with a National Instruments data acquisition board at a sampling rate of 10 000 Hz. Traces were analyzed with custom software written in Matlab (MathWorks, Natick, MA, USA)[17]. Scotopic flashes were generated with cyan light emitting diodes calibrated with a photometer and converted to the unit activated rhodopsin molecules/rod, where 1 scot cd/m2=581 activated rhodopsin molecules/rod/s. A 5ms stimulus of 500 nm wavelength light was used for all flashes.
Statistical Analysis
A two example t-test was used to determine significant difference in IOP levels and difference in ERG amplitudes at a single flash strength. Linear regression analysis was used to calculate Pearson's correlation coefficient (r) to indicate the direction and strength of any linear association between IOP measurements and mouse age.
RESULTS
Intraocular Pressure Changes over the Time in Wild Type C57bl/6 Mice and Glaucomatous Model DBA2J Mice
The IOP of eight WT C57bl/6 mice (right eye of each animal) were monitored from three months of age to fifteen months of age. The IOP of WT C57bl/6 mice were ranging from 6 to 11 mm Hg with the average of 9.03±0.6 mm Hg, as shown in Figure 1. The IOP was not significantly (P>0.05) correlated with the age of animals. The IOP of eight glaucomatous model DBA2J mice (right eye of each animal) were from three months of age to fifteen months of age, as shown in Figure 2. In DBA2J mice, the IOP was slightly increased from 7mo of age in two of eight animals, compare with IOP of WT mice. IOP was increased in four of eight animals at 11mo of age. After 11mo of age, IOP was slightly decreasing, but IOP were still elevated in three of eight animals, compared with IOP of WT animals. The elevated IOP was arranging from 11 to 28 mm Hg. The IOP was positively correlated with the animal age significantly (P<0.0001, r=0.45).
Figure 1. IOP changes in WT C57bl/6 mice.

The grey line indicates the correlation between IOP and age of mice.
Figure 2. IOP changes in glaucoma model DBA2J mice.

The grey line indicates the correlation between IOP and age of mice.
Retinal Ganglion Cell Loss in Glaucomatous DBA2J Mice Compared with Wild Type Mice
Figure 3 shows one WT retina in which RGCs and their axons were retrograde labeled by fluorescence dye NB. All RGCs including the ones in very peripheral retina were successfully labelled by NB. TO-PRO-3 visualized all nuclei in the RGC layer, including RGCs, displaced amacrine cells and glial cells, as shown in Figure 4. The density of cells were estimated by sampling through central and peripheral regions of the retina. In the RGC layer, the average cell density was 4860±266 cells/mm2 in 3-month-old WT mice, as shown in Figure 5. The cell density decreased slightly to 4110±251 cells/mm2 in 15-month-old WT mice, but it is not significantly different (P>0.05) compared with that in 3-month-old WT mice. The central zone presented higher cell density compared with the peripheral zone. The average density of RGCs was 3935±243 cells/mm2 which accounted for 81.6%±5.1% of the total cells in RGC layer in 3-month-old WT mice. The rest of neurons including displaced amacrine cells and glial cells constituted 19.4%±4.8% of the total neurons in this layer. The RGC density decreased slightly to 3125±239 cells/mm2 in 15-month-old WT mice, but it is not significantly different (P>0.05) compared with that in 3-month-old WT mice. As WT C57bl/6 mice were aging, the number of total neuron and the non-RGC neurons were not changing significantly. But the RGCs were losing continuously from 7-month-old to 15-month-old. The percentage of RGCs in the total neurons in the RGC layer dropped from 81% at 3-month-old to 76% 15-month-old, while the percentage of non-RGC neurons, mainly the displaced amacrine cells and glial cells in the RGC layer, increased from 19% to 24%.
Figure 3. A flat-mount whole retina of WT C57bl/6 mouse with NB (red) retrograde labeling.
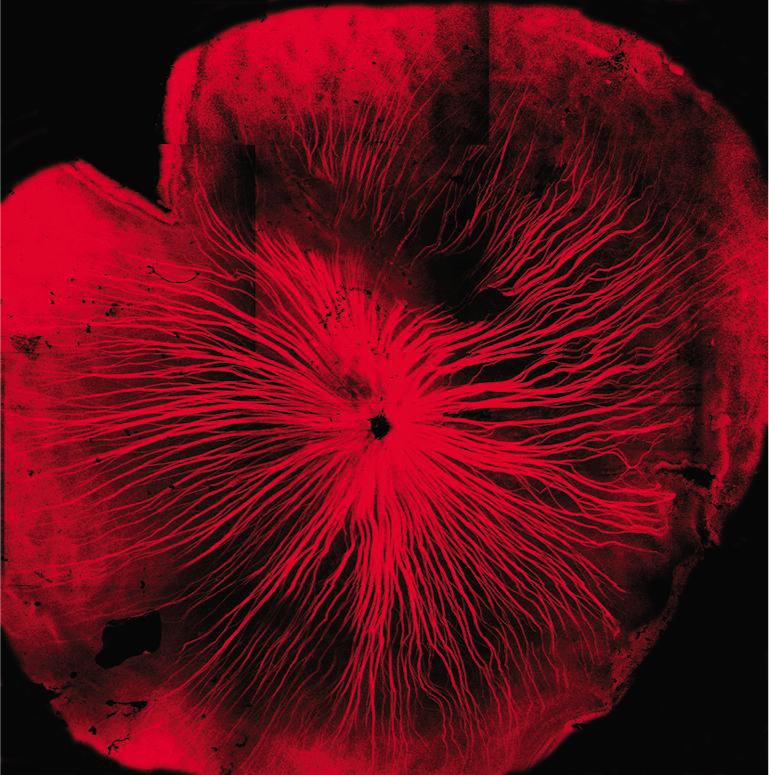
The RGCs and their axons were labelled with NB (red) in the whole retina.
Figure 4. All cells in RGC layer were labelled by TO-PRO-3 (blue) and RGCs were labelled by NB (red).

Top, typical staining pattern from retina of a 3-month-old WT mice. Bottom, staining pattern from retinas of two 15-month-old DBA2J mice.
Figure 5. The cell density of total neurons and RGCs in the RGC layer of WT mice and DBA2J mouse.

As shown in Figure 5, in the 3-month-old DBA2J mice, the average cell density in the RGC layer was 4715±278 cells/mm2 which is not significantly different from that in WT mice. The cell density decreased to 2951±351 cells/mm2 in 15-month-old DBA2J mice, and it is significantly different (P<0.01) compared with that in 15-month-old WT mice. The RGC density decreased significantly from 3874±258 cells/mm2 in 3-month-old to 535±474 cells/mm2 in 15-month-old DBA2J mice, and it is significantly lower (P<0.01) than that in 15-month-old WT mice. The percentage of non-RGC neurons in the RGC layer was remarkably increased from 19% to 80%. Figure 6 shows the relationship between RGC density and IOP in the DBA2J mice of 15-month-old (n=8). RGC density was not significantly correlated with the IOP in DBA2J mice (P>0.05).
Figure 6. The relationship between RGC density and IOP in DBA2J mice of 15-month-old.

The ERG is a mass potential representing the summed activity of all retinal cells. In the DA ERG, in response to weaker flashes (-1.26 and -0.94 log activated rhodopsin molecules per rod), the responses are dominated by a small sensitive positive wave called the positive scotopic threshold response (pSTR), which peaks at 110ms and a negative wave called the negative scotopic threshold response (nSTR) peaked at 200ms[18]. pSTR and nSTR are related to activation of inner retina neurons, i.e. the amacrine cells and/or ganglion cells, and mediated by Müller glia currents[19]–[20]. The initial negative a-wave, is mainly associated with photoreceptor activity, but includes postreceptoral contributions[21]. The positive going b-wave peaked at 110ms originates primarily from the rod bipolar cells in scotopic ERG[22]–[24].
Figure 7A shows the representative DA whole-field flash ERG recorded from one 15-month-old DBA2J mouse and one age-paired WT mouse in response to brief flashes of increasing stimulus strength. The typical control ERGs shown as grey traces had a prominent positive b-wave that grew in amplitude with increasing stimulus strength and a negative a-wave preceding the b-wave. ERGs recorded from the DBA2J mouse had a-waves slightly smaller to those of WT, shown as black traces. The b-wave of the DBA2J mouse had lower maximum amplitude than that for the WT mouse. Figure 7C shows stimulus response functions for the averaged result of 8 animals per group for dark adapted ERGs in DBA2J and WT mice of 15-month-old. The b-wave stimulus response relation in DBA2J mice was significantly different (P<0.001) from that in WT mice.
Figure 7. DA ERGs recorded from WT and DBA2J mice.

A: ERG traces recorded from WT (grey) and DBA2J (black) mice of 15-month-old evoked by brief flash stimuli with stimulus intensity increasing from bottom to top; B: The average amplitude of nSTR measured at 200ms and pSTR measure at 110ms for stimulus intensity of -1.26 and -0.95 log activated rhodopsin molecules per rod in WT (grey) and DBA2J (black) mice; C: The average amplitude of b-wave measured from a-wave trough to b-wave peak in WT (white circles) and DBA2J (black circles) mice. Functional deficit of RGCs in DBA2J mice compared with WT mice.
The typical pSTR and nSTR elicited by weak flashes in flash DA-ERG, were shown as grey traces at the bottom of Figure 7A. Illustrated in Figure 7B, the nSTR amplitudes measured at 200ms in DBA2J mice (n=8) were -20±7 mV for the stimulus of-1.26 log activated rhodopsin molecules per rod and -12±5 mV for flash of -0.94 log activated rhodopsin molecules per rod, which were different (P<0.05) from that in WT mice (-140±18 mV and -80±7 mV for stimuli of -1.26 and -0.94 log activated rhodopsin molecules per rod, respectively). The pSTR amplitudes measured at 110ms in DBA2J mice (n=8), illustrated in Figure 7B, were different (P<0.001) from the WT mice.
DISCUSSION
The present study found that DBA2J mice display normal IOP and normal histologic retina at young age (3-month-old). DBA2J mice started presenting raised IOP at 7-month-old. By 11- and 15-month-old, raised IOP was presented in more than half of DBA2J mice, ranging from 7 to 28 mm Hg in DBA2J mice. However, the IOP in C57bl/6 mice did not show significantly increased as aging, ranging from 6 to 11 mm Hg. By 7mo of age, the RGCs in DBA2J mice show signs of apoptotic death. The RGC death continuously increased and reached about 80% by 15mo. Libby et al[25] also reported that in DBA2J mice axonal damage in the optic nerves is apparent in approximately 50% of eyes by 10 to 11mo of age and in approximately 90% of eyes by 18mo. All in all, raised IOP was present in some of DBA2J mice, but not all DBA2J mice develop an increase in IOP and furthermore, not every DBA2J mouse developing optic neuropathy had an increase in IOP.
ERG measurements in WT and DBA2J mice were made to further investigate whether DBA2J mice display functional deficits of the retina as well and whether functional deficits correlates with the IOP. The amplitude of pSTR and nSTR which are primarily generated by inner retinal neurons, especially pSTR which originates mainly from RGCs in mice[26]–[29], were significantly reduced in all DBA2J mice and were reduced even in DBA2J with normal IOP. We showed in addition that DBA2J mice display functional deficits of the retina by ERG measurements that were not correlated with IOP.
Both findings in the present study strongly suggested that DBA2J mice display pathological and functional deficits of the retina that were not linearly correlated with IOP. Ocular hypertension alone cannot be postulated as a compulsory factor for the onset of the optic neuropathy or RGC degeneration in DBA2J. Mutations in two genes, GPNMB and Tyrp1, in the DBA2J mouse cause iris atrophy and pigment dispersion. The iris disease is apparent at 6mo and progresses with age, resulting in elevated IOP, loss of RGCs and optic nerve axons, and optic disc excavation[8],[24]. Although reduction of IOP is the only proven method to treat glaucoma[30], even in several forms of human glaucoma-for example, POAG-degeneration of the optic nerve axons or RGCs also develops independently of IOP elevation[4]. These evidences support the hypothesis that additional and unknown factors except IOP elevation may be present to cause glaucomatous damage in DBA2J mice and even in human glaucoma patients. Mechanistic understanding of the interaction between pressure-dependent and independent pathways is needed. Recent study suggests that immune component may trigger the progression of pigment dispersing disease to glaucoma in DBA2J mice[31]. Several new signaling mechanisms and agents are described to be associated with RGC injury and remodeling of the optic nerve head. For instance, Ion channels such as transient receptor potential vanilloid isoform 4 (TRPV4), pannexin-1 (Panx1) and P2X7 receptor are localized to RGCs and are reported to act as potential sensors and effectors of mechanical strain, ischemia and inflammatory responses in the glaucoma diesease[32]–[34].
Additional finding of present study is that the amplitudes of both b-wave and a-wave were significantly reduced in DA ERG of DBA2J mice compared with that of WT mice. It suggests the changes in the functional integrity of the outer retina including photoreceptors and bipolar cells, as a-wave and b-wave are mainly generated by photoreceptor and ON bipolar cell response. Fernandez-Sanchez and his colleagues also reported outer retinal degeneration in DBA2J mice including photoreceptor death, loss of bipolar and horizontal cell processes, and loss of synaptic contacts[35].
Effect of Anesthetic Drug on the Intraocular Pressure in Mouse Models
It has been reported[5] that the anesthetic drug isoflurane did not statistically significantly affect IOPs in mouse models 3min after the induction of general anesthesia, and caused only a minimum change in the IOP 5min after the induction of general anesthesia. In this study, isoflurane was used to induce anesthesia for IOP measurement. The whole process of IOP measurement was completed in 3min. The IOP measurements in this study were not affected by anesthetic drug isoflurane.
The anesthetic drugs ketamine and xylazine were used in this study to induce general anesthesia for the ERG recordings, not for the IOP measuring. The IOP measurements reported in this study were not affected by ketamine and xylazine, although ketamine and xylazine have been reported[5] to significantly reduce IOPs in mouse models. DBA2J mice are a chronic IOP elevation mouse models. Short term reduction of IOP for 30min during ERG recordings would not affect the average IOP level in the DBA2J mice. The damage of IOP elevation on the retina occurred before ERG recordings, and the damage would not be reversed by temporal IOPs reduction in DBA2J mice.
Limitations
The sample size and follow-up time are major limitation for this study. Although it has been reported that anesthetic drug might affect the IOPs in mouse models, based on previous study about the effect of anesthetic drug on the IOPs in mouse models and the experiment design in this study, IOP measurements and retinal damage of IOP elevation reported in this study were not affected by the use of anesthetic drug.
Acknowledgments
Foundation: Supported by International Retinal Research Foundation.
Conflicts of Interest: Wang J, None; Dong Y, None.
REFERENCES
- 1.Weinreb RN, Aung T, Medeiros FA. The pathophysiology and treatment of glaucoma: a review. JAMA. 2014;311(18):1901–1911. doi: 10.1001/jama.2014.3192. [DOI] [PMC free article] [PubMed] [Google Scholar]
- 2.Quigley HA, Broman AT. The number of people with glaucoma worldwide in 2010 and 2020. Br J Ophthalmol. 2006;90(3):262–267. doi: 10.1136/bjo.2005.081224. [DOI] [PMC free article] [PubMed] [Google Scholar]
- 3.McKean-Cowdin R, Wang Y, Wu J, Azen SP, Varma R. Impact of visual field loss on health-related quality of life in glaucoma: the Los Angeles Latino Eye Study. Ophthalmology. 2008;115(6):941–948 e1. doi: 10.1016/j.ophtha.2007.08.037. [DOI] [PMC free article] [PubMed] [Google Scholar]
- 4.Gottanka J, Kuhlmann A, Scholz M, Johnson DH, Lutjen-Drecoll E. Pathophysiologic changes in the optic nerves of eyes with primary open angle and pseudoexfoliation glaucoma. Invest Ophthalmol Vis Sci. 2005;46(11):4170–4181. doi: 10.1167/iovs.05-0289. [DOI] [PubMed] [Google Scholar]
- 5.Yanagi M, Kawasaki R, Wang JJ, Wong TY, Crowston J, Kiuchi Y. Vascular risk factors in glaucoma: a review. Clin Experiment Ophthalmol. 2011;39(3):252–258. doi: 10.1111/j.1442-9071.2010.02455.x. [DOI] [PubMed] [Google Scholar]
- 6.Cherecheanu AP, Garhofer G, Schmidl D, Werkmeister R, Schmetterer L. Ocular perfusion pressure and ocular blood flow in glaucoma. Curr Opin Pharmacol. 2013;13(1):36–42. doi: 10.1016/j.coph.2012.09.003. [DOI] [PMC free article] [PubMed] [Google Scholar]
- 7.Kass MA, Heuer DK, Higginbotham EJ, Johnson CA, Keltner JL, Miller JP, Parrish RK, 2nd, Wilson MR, Gordon MO. The ocular hypertension treatment study: a randomized trial determines that topical ocular hypotensive medication delays or prevents the onset of primary open-angle glaucoma. Arch Ophthalmol. 2002;120(6):701–713; discussion 829–830. doi: 10.1001/archopht.120.6.701. [DOI] [PubMed] [Google Scholar]
- 8.John SW, Smith R, Savinova OV, Hawes NL, Chang B, Turnbull D, Davisson M, Roderick TH, Heckenlively JR. Essential iris atrophy, pigment dispersion, and glaucoma in DBA/2J mice. Invest Ophthalmol Vis Sci. 1998;39(6):951–962. [PubMed] [Google Scholar]
- 9.Anderson MG, Libby RT, Mao M, Cosma IM, Wilson LA, Smith RS, John SW. Genetic context determines susceptibility to intraocular pressure elevation in a mouse pigmentary glaucoma. BMC Biol. 2006;4:20. doi: 10.1186/1741-7007-4-20. [DOI] [PMC free article] [PubMed] [Google Scholar]
- 10.Libby RT, Gould DB, Anderson MG, John SW. Complex genetics of glaucoma susceptibility. Annu Rev Genomics Hum Genet. 2005;6:15–44. doi: 10.1146/annurev.genom.6.080604.162209. [DOI] [PubMed] [Google Scholar]
- 11.Anderson MG, Smith RS, Hawes NL, Zabaleta A, Chang B, Wiggs JL, John SW. Mutations in genes encoding melanosomal proteins cause pigmentary glaucoma in DBA/2J mice. Nat Genet. 2002;30(1):81–85. doi: 10.1038/ng794. [DOI] [PubMed] [Google Scholar]
- 12.Anderson MG, Smith RS, Savinova OV, Hawes NL, Chang B, Zabaleta A, Wilpan R, Heckenlively JR, Davisson M, John SW. Genetic modification of glaucoma associated phenotypes between AKXD-28/Ty and DBA/2J mice. BMC Genet. 2001;2:1. doi: 10.1186/1471-2156-2-1. [DOI] [PMC free article] [PubMed] [Google Scholar]
- 13.Yang XL, Wu SM. Effects of background illumination on the horizontal cell responses in the tiger salamander retina. J Neurosci. 1989;9(3):815–827. doi: 10.1523/JNEUROSCI.09-03-00815.1989. [DOI] [PMC free article] [PubMed] [Google Scholar]
- 14.Zhang AJ, Zhang J, Wu SM. Electrical coupling, receptive fields, and relative rod/cone inputs of horizontal cells in the tiger salamander retina. J Comp Neurol. 2006;499(3):422–431. doi: 10.1002/cne.21117. [DOI] [PubMed] [Google Scholar]
- 15.Pease ME, Cone FE, Gelman S, Son JL, Quigley HA. Calibration of the TonoLab tonometer in mice with spontaneous or experimental glaucoma. Invest Ophthalmol Vis Sci. 2011;52(2):858–864. doi: 10.1167/iovs.10-5556. [DOI] [PMC free article] [PubMed] [Google Scholar]
- 16.Zhang J, Yang Z, Wu SM. Immuocytochemical analysis of spatial organization of photoreceptors and amacrine and ganglion cells in the tiger salamander retina. Vis Neurosci. 2004;21(2):157–166. doi: 10.1017/s0952523804042075. [DOI] [PubMed] [Google Scholar]
- 17.Abd-El-Barr MM, Pennesi ME, Saszik SM, Barrow AJ, Lem J, Bramblett DE, Paul DL, Frishman LJ, Wu MS. Genetic dissection of rod and cone pathways in the dark-adapted mouse retina. J Neurophysiol. 2009;102(3):1945–1955. doi: 10.1152/jn.00142.2009. [DOI] [PMC free article] [PubMed] [Google Scholar]
- 18.Lyubarsky AL, Daniele LL, Pugh EN., Jr From candelas to photoisomerizations in the mouse eye by rhodopsin bleaching in situ and the light-rearing dependence of the major components of the mouse ERG. Vision Res. 2004;44(28):3235–3251. doi: 10.1016/j.visres.2004.09.019. [DOI] [PubMed] [Google Scholar]
- 19.Saszik SM, Robson JG, Frishman LJ. The scotopic threshold response of the dark-adapted electroretinogram of the mouse. J Physiol. 2002;543(Pt 3):899–916. doi: 10.1113/jphysiol.2002.019703. [DOI] [PMC free article] [PubMed] [Google Scholar]
- 20.Wang J, Cheng H, Hu YS, Tang RA, Frishman LJ. The photopic negative response of the flash electroretinogram in multiple sclerosis. Invest Ophthalmol Vis Sci. 2012;53(3):1315–1323. doi: 10.1167/iovs.11-8461. [DOI] [PMC free article] [PubMed] [Google Scholar]
- 21.Robson JG, Saszik SM, Ahmed J, Frishman LJ. Rod and cone contributions to the a-wave of the electroretinogram of the macaque. J Physiol. 2003;547(Pt 2):509–530. doi: 10.1113/jphysiol.2002.030304. [DOI] [PMC free article] [PubMed] [Google Scholar]
- 22.Herrmann R, Heflin SJ, Hammond T, Lee B, Wang J, Gainetdinov RR, Caron MG, Eggers ED, Frishman LJ, McCall MA, Arshavsky VY. Rod vision is controlled by dopamine-dependent sensitization of rod bipolar cells by GABA. Neuron. 2011;72(1):101–110. doi: 10.1016/j.neuron.2011.07.030. [DOI] [PMC free article] [PubMed] [Google Scholar]
- 23.Robson JG, Frishman LJ. Response linearity and kinetics of the cat retina: the bipolar cell component of the dark-adapted electroretinogram. Vis Neurosci. 1995;12(5):837–850. doi: 10.1017/s0952523800009408. [DOI] [PubMed] [Google Scholar]
- 24.Wang J, Mojumder DK, Yan J, Xie A, Standaert RF, Qian H, Pepperberg DR, Frishman LJ. In vivo electroretinographic studies of the role of GABAC receptors in retinal signal processing. Exp Eye Res. 2015;139:48–63. doi: 10.1016/j.exer.2015.07.002. [DOI] [PMC free article] [PubMed] [Google Scholar]
- 25.Libby RT, Anderson MG, Pang IH, Robinson ZH, Savinova OV, Cosma IM, Snow A, Wilson LA, Smith RS, Clark AF, John SW. Inherited glaucoma in DBA/2J mice: pertinent disease features for studying the neurodegeneration. Vis Neurosci. 2005;22(5):637–648. doi: 10.1017/S0952523805225130. [DOI] [PubMed] [Google Scholar]
- 26.Perez de Lara MJ, Santano C, Guzman-Aranguez A, Valiente-Soriano FJ, Aviles-Trigueros M, Vidal-Sanz M, de la Villa P, Pintor J. Assessment of inner retina dysfunction and progressive ganglion cell loss in a mouse model of glaucoma. Exp Eye Res. 2014;122:40–49. doi: 10.1016/j.exer.2014.02.022. [DOI] [PubMed] [Google Scholar]
- 27.Salinas-Navarro M, Alarcon-Martinez L, Valiente-Soriano FJ, Ortin-Martinez A, Jimenez-Lopez M, Aviles-Trigueros M, Villegas-Perez MP, de la Villa P, Vidal-Sanz M. Functional and morphological effects of laser-induced ocular hypertension in retinas of adult albino Swiss mice. Mol Vis. 2009;15:2578–2598. [PMC free article] [PubMed] [Google Scholar]
- 28.Bach M, Poloschek CM. Electrophysiology and glaucoma: current status and future challenges. Cell Tissue Res. 2013;353(2):287–296. doi: 10.1007/s00441-013-1598-6. [DOI] [PubMed] [Google Scholar]
- 29.Mao CA, Cho JH, Wang J, Gao Z, Pan P, Tsai WW, Frishman LJ, Klein WH. Reprogramming amacrine and photoreceptor progenitors into retinal ganglion cells by replacing Neurod1 with Atoh7. Development. 2013;140(3):541–551. doi: 10.1242/dev.085886. [DOI] [PMC free article] [PubMed] [Google Scholar]
- 30.Boland MV, Ervin AM, Friedman DS, Jampel HD, Hawkins BS, Vollenweider D, Chelladurai Y, Ward D, Suarez-Cuervo C, Robinson KA. Comparative effectiveness of treatments for open-angle glaucoma: a systematic review for the U.S. Preventive Services Task Force. Ann Intern Med. 2013;158(4):271–279. doi: 10.7326/0003-4819-158-4-201302190-00008. [DOI] [PubMed] [Google Scholar]
- 31.Nair KS, Barbay J, Smith RS, Masli S, John SW. Determining immune components necessary for progression of pigment dispersing disease to glaucoma in DBA/2J mice. BMC Genet. 2014;15:42. doi: 10.1186/1471-2156-15-42. [DOI] [PMC free article] [PubMed] [Google Scholar]
- 32.Ryskamp DA, Witkovsky P, Barabas P, Huang W, Koehler C, Akimov NP, Lee SH, Chauhan S, Xing W, Renteria RC, Liedtke W, Krizaj D. The polymodal ion channel transient receptor potential vanilloid 4 modulates calcium flux, spiking rate, and apoptosis of mouse retinal ganglion cells. J Neurosci. 2011;31(19):7089–7101. doi: 10.1523/JNEUROSCI.0359-11.2011. [DOI] [PMC free article] [PubMed] [Google Scholar]
- 33.Niyadurupola N, Sidaway P, Ma N, Rhodes JD, Broadway DC, Sanderson J. P2X7 receptor activation mediates retinal ganglion cell death in a human retina model of ischemic neurodegeneration. Invest Ophthalmol Vis Sci. 2013;54(3):2163–2170. doi: 10.1167/iovs.12-10968. [DOI] [PubMed] [Google Scholar]
- 34.Roh M, Zhang Y, Murakami Y, Thanos A, Lee SC, Vavvas DG, Benowitz LI, Miller JW. Etanercept, a widely used inhibitor of tumor necrosis factor-α (TNF-α), prevents retinal ganglion cell loss in a rat model of glaucoma. PloS One. 2012;7(7):e40065. doi: 10.1371/journal.pone.0040065. [DOI] [PMC free article] [PubMed] [Google Scholar]
- 35.Fernandez-Sanchez L, de Sevilla Muller LP, Brecha NC, Cuenca N. Loss of outer retinal neurons and circuitry alterations in the DBA/2J mouse. Invest Ophthalmol Vis Sci. 2014;55(9):6059–6072. doi: 10.1167/iovs.14-14421. [DOI] [PMC free article] [PubMed] [Google Scholar]