

Abstract
Mild traumatic brain injury (TBI) from focal head impact is the most common form of TBI in humans. Animal models, however, typically use direct impact to the exposed dura or skull, or blast to the entire head. We present a detailed characterization of a novel overpressure blast system to create focal closed-head mild TBI in mice. A high-pressure air pulse limited to a 7.5 mm diameter area on the left side of the head overlying the forebrain is delivered to anesthetized mice. The mouse eyes and ears are shielded, and its head and body are cushioned to minimize movement. This approach creates mild TBI by a pressure wave that acts on the brain, with minimal accompanying head acceleration-deceleration. A single 20-psi blast yields no functional deficits or brain injury, while a single 25–40 psi blast yields only slight motor deficits and brain damage. By contrast, a single 50–60 psi blast produces significant visual, motor, and neuropsychiatric impairments and axonal damage and microglial activation in major fiber tracts, but no contusive brain injury. This model thus reproduces the widespread axonal injury and functional impairments characteristic of closed-head mild TBI, without the complications of systemic or ocular blast effects or head acceleration that typically occur in other blast or impact models of closed-skull mild TBI. Accordingly, our model provides a simple way to examine the biomechanics, pathophysiology, and functional deficits that result from TBI and can serve as a reliable platform for testing therapies that reduce brain pathology and deficits.
Key words: : axonal injury, mild TBI, motor deficits, overpressure blast, visual deficits
Introduction
Mild traumatic brain injury (TBI) is an extremely common occurrence during military combat, sports, recreational activities, and vehicle use.1–5 Mild TBI, which involves either brief or no loss of consciousness, causes minimal focal brain damage as assessed by magnetic resonance imaging (MRI), but typically produces widespread (i.e., diffuse) axonal injury that is evident with diffusion tensor imaging (DTI).6,7
Mild TBI leads to a variety of adverse sensory, motor, cognitive, and emotional outcomes. The injury with mild TBI appears to stem from the brain tissue deformation that results from the shockwave transmitted through brain and cerebrospinal fluid (CSF) by the impact force, or from the brain compression—expansion during rapid head acceleration—deceleration,8 which leads to diffuse axonal injury and subsequent secondary degenerative events.9
A variety of animal models of TBI have been developed to elucidate the biomechanics, pathophysiology, and/or treatment approaches for TBI.8 Some animal models of TBI use lateral fluid percussion or controlled piston impact to the exposed dura, which typically causes brain destruction at the site of impact. These approaches thus model severe penetrating TBI rather than mild TBI.8,10–18 Some researchers have used shock tubes to deliver compressed air blasts to the animal, to mimic blast-produced TBI.19–33 These models, however, are often accompanied by hypoxia and blood pressure surges resulting from compression of the lungs, heart, and aorta, which in turn damage brain blood vessels.8,34 Moreover, the direct exposure of the eye to the blast makes it difficult to distinguish visual deficits caused by brain trauma from visual deficits caused by the direct ocular impact of the blast.
Animal models that involve weight drop or piston impact to the head or exposed skull avoid these various problems, because the lungs, vasculature, and eye are not directly affected.26,35–39 The head, however, is typically not restrained in weight-drop, piston impact, and blast models, and its rapid displacement means that head acceleration contributes to the brain injury. Although head impact by a blow or blast together with head movement is true to many real world concussive events, their combined contribution makes it more difficult to ascertain the biomechanical basis of a specific neural injury in an animal model.
We sought to develop a model in which we could create a closed-head mild concussive brain injury without significant contribution from the variables of head acceleration, lung damage, cardiovascular pressure surges, or injury to other head structures. To this end, we adapted an overpressure air blast system initially developed for ocular blast injury in mice.40 In our approach, a high pressure air blast is delivered to a 7.5-mm diameter circular area of the parietal region on the left side of the shaved head, with the anesthetized mouse secured in a cushioned holder that limits head displacement and shields all but the exposed part of the head.
This model simulates the temporal and physical dynamics of intracranial pressure wave-mediated mild TBI, such as would occur from an explosion or blow to the head. Because we stabilize the head, the injury appears to stem largely from the neural tissue deformation produced when the shockwave is transmitted through the braincase, with minimal contribution from the forces caused by sudden head acceleration-deceleration.
Here we provide detailed descriptions of our blast methodology, the physical characteristics of the blast itself, and the pathological and functional consequences of single blasts ranging from 0 to 70 psi (pounds per square inch). We show that closed-head 50–60 psi overpressure air blasts targeted specifically to the parietal region of one side of the cushioned head cause mild TBI and associated motor and visual impairments. Moreover, the blasts produce the characteristic histological features of mild TBI—axonal injury in major fiber tracts accompanied by microglial activation, but no evident foci of neuronal destruction.
Methods
Animals
Three-month-old male mice underwent single blasts, ranging from 0–70 psi above atmospheric pressure (i.e., 14.7 psi), and the outcome was evaluated behaviorally and histologically at different time points after the blast. The 0-psi blasts are also referred to here as sham blasts. Two strains of mice were used, C57BL/6 mice and enhanced yellow fluorescent protein (EYFP) reporter mice (on a C57BL/6 background) conditionally expressing EYFP in Thy1-expressing telencephalic neurons of the emx1 lineage.
The C57BL/6 mice were used in behavioral and histological studies and were either purchased from Jackson Laboratories (Bar Harbor, ME), and/or taken from a colony maintained from C57BL/6 founders from JAX. We used the reporter mice conditionally expressing EYFP in Thy1-expressing telencephalic neurons of the emx1 lineage to histologically evaluate the effects of blast on excitatory neurons of the cerebral cortex and amygdala, and on various axon tracts of the brain, especially those arising from cortex and from retina.
Cre-driven recombination occurs in nearly 90% of pyramidal cortical neurons.41,42 Thus, in the progeny of a cross between a floxed Thy1-EYFP reporter mouse and an emx1-Cre driver mouse, nearly all excitatory cortical and many amygdalar neurons express EYFP.41–43 Although emx1 has not been reported to be expressed in the retina, we found that about 5% of retinal ganglion cells also express EYFP. The floxed Thy1-EYFP reporter mice (purchased from JAX) and emx1-Cre driver mice (purchased from the Mutant Mouse Regional Resource Consortium, or MMRRC) were maintained as colonies at the University of Tennessee Health Science Center (UTHSC). All animal studies were performed in accordance with an UTHSC Institutional Animal Care and Use Committee approved protocol and complied with the National Institutes of Health and Society for Neuroscience guidelines.
TBI methods
Blast device
The overpressure air blast is delivered by a small horizontally mounted air cannon system,40,43 consisting of a modified paintball gun (Invert Mini, Empire Paintball, Sewell, NJ), pressurized air tank, and x-y table secured onto a medium-density fiberboard (Fig. 1). The original paintball gun barrel with a 13-mm aperture was replaced with a machined barrel with a 6.5-mm diameter aperture to increase output pressure. The air blast pressures from the paintball gun are controlled by adjusting the output from a pressurized air tank, as monitored by a gun input pressure gauge.
FIG. 1.
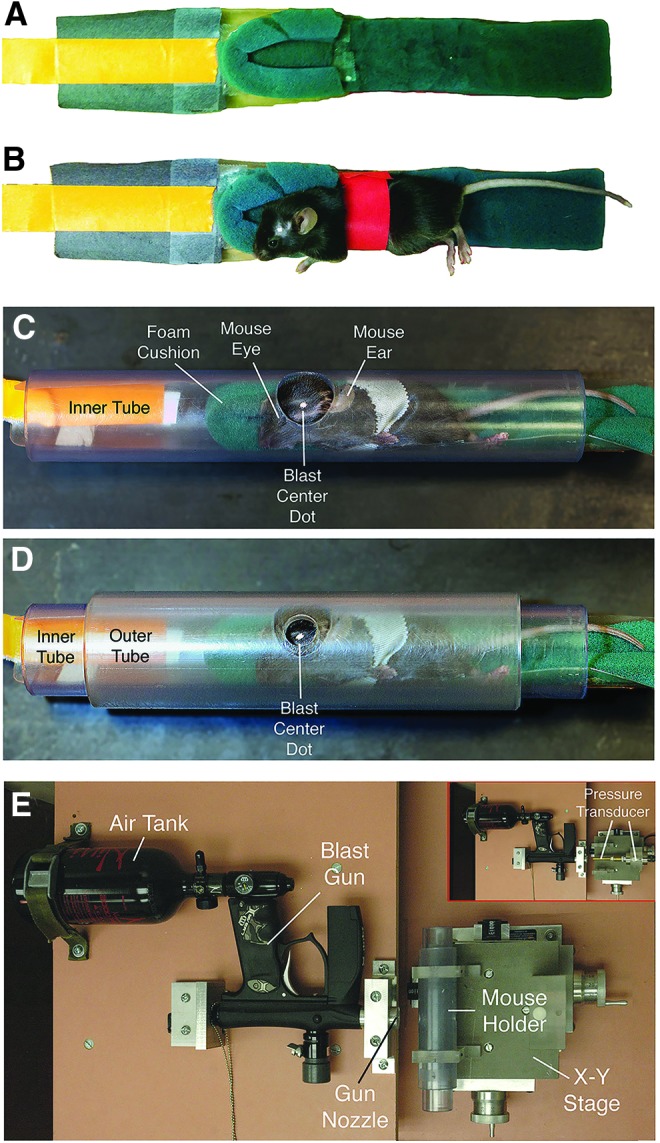
Anesthetized mice are secured within a foam rubber sleeve (A, B) in a narrow polyvinyl chloride (PVC) pipe with a 2.0-cm opening in one wall (C), and slid into a just-wider PVC pipe with a 7.5-mm hole bored into its wall (D). The two pipes are aligned so that the small outer hole exposes the parietal-squamosal region of the mouse skull between ear and eye (the overlying fur is shaved, and a centering white spot marked on the skin). The foam rubber sleeve cushions the nonblast side of the mouse (A, B). The foam rubber is secured on a plastic sled, and the sled has a tab by which the mouse holder can be pulled into the tube. The mouse is secured to the holder with several rounds of surgical tape, red in A and B, but white in C and D. The overpressure air blast in our model is delivered by a horizontally mounted modified paintball gun (E). No mouse is present in the tube in E. The blast from the gun is regulated by adjustment of input from a pressurized air tank, and desired blast intensity is calibrated using a pressure gauge (inset in E). The inset shows the pressure transducer to the right, with its barrel passing through the region otherwise occupied by the mouse and mouse holder tubes. Color image is available online at www.liebertpub.com/neu
The part of the mouse exposed to the blast is restricted to a 7.5-mm diameter midcranial area in the following manner (Fig. 1A–D): anesthetized mice are secured within a foam rubber sleeve in a 33-mm outer diameter wide clear polyvinyl chloride (PVC) pipe (26-mm inner diameter), with the left side of the mouse head apposed to a 20-mm opening in the midpoint of one wall of the tube. This “inner” tube is slid into a 44-mm outer-diameter wide clear PVC pipe (35-mm inner diameter) with a 7.5-mm hole bored into the midpoint of its wall. The inner PVC tube is rotated in the outer PVC tube so that the targeted head region is positioned in the center of the 7.5-mm hole in the outer tube.
The outer tube is mounted perpendicular to the blast cannon using two Plexiglas holders that are mounted on an x-y table, which is itself mounted to the medium-density fiberboard base (Velmex Inc., Bloomfield, NY). The outer tube opening is then aligned with the gun barrel opening, using the x-y controls, so the mouse head is 4–5-mm from the blast cannon barrel tip (Fig. 1E). This arrangement exposes the parietal region of the left side of the mouse head between the ear and the eye to the blast, while the rest of the mouse is shielded from the blast by the pipe.
The blast area encompasses the skull overlying the forebrain (Fig. 2A). The foam rubber sleeve surrounding the mouse cushions the nonblast side of the mouse, to stabilize it and minimize head displacement. Before blast exposure, mice were anesthetized with Avertin (400 mg/kg body weight), the fur of the parietal region of the left side of the head shaved, a white dot painted in the middle of the region (midway between eye and ear), and the mouse secured in the holder as described above. Mice received 35 mg/mL acetaminophen in their drinking water for 24 h after blast.
FIG. 2.

Image A shows the 7.5-mm area of the mouse cranium exposed to blast, in relationship to the eyes, auditory meatus, and brain. Note that the blast area encompasses the forebrain, but does not include the eye or ear. Image B shows pressure waves for different peak blast levels. Blast durations increase with increasing peak blast amplitude. Color image is available online at www.liebertpub.com/neu
Blast characterization
In addition to the 7.5-mm hole that faces the gun barrel, the outer tube possesses an 11-mm hole on the opposite side, allowing the barrel of a model STJE Sensotec pressure transducer (Honeywell, Morristown, NJ) to be inserted so the barrel tip is in the same position that the mouse head occupies during blast.40,43 The pressures detected by this transducer are recorded and analyzed using Labview software (National Instruments, Austin, TX). This makes it possible to measure the air blast pressure at the position occupied by the mouse head during a blast session.
Adjustment of the pressure gauge on the gun to specific levels calibrated by the pressure gauge allowed us to vary the pressure from 0-psi to 70-psi above atmospheric pressure. This range includes pressures that were previously reported to produce TBI in rats and mice exposed to head or whole body blasts.20,21,24–26,30,33
We also measured the pressure detected by the pressure gauge at increasing distances of the tip of the pressure gauge barrel from the gun barrel tip, at a series of blast gun input tank pressure settings, and determined that the blast gun output pressure was uniform over a distance of 3–5 mm from the tip of the blast gun. Accordingly, we measured the pressure waves produced at different peak output blast settings at 4–5-mm from the blast gun tip, and mice were also subsequently positioned at this distance.
To characterize the speed of the blast wave, we used a typical lens-based Schlieren system,44 in which light from a pin source is collimated through a double-convex lens to visualize variations in refractive index caused by density gradients in a flowing liquid or gas. The collimated light was further converged using a double-convex lens, and a knife-edge was placed at the focal distance of the lens, positioned so as to block half of the light. By visualizing the air pressure wave within this light beam at 1400 fps with a high-speed pco.1200 hs video camera (The Cooke Corp., Romulus, MI), lighter and darker patches corresponding to positive and negative pressure density gradients in the direction normal to the knife-edge are visible. With pressure waves moving at or above the speed of sound, a standing wave pattern is seen in the wake of the blast front, from which the speed of the leading edge of the shockwave can be calculated.44
To characterize the movement of the head during blast, we videotaped the mouse through the open front end of the mouse holder at 1100 fps during 30-psi and 60-psi blasts. The head center of mass was identified in every video frame, and its position along the horizontal plane was determined in each frame for 24 msec after the blast. Zero time was taken to be the frame when a slight movement of the fur was seen, evidence that the overpressure wave front was just reaching the mouse. This occurred one frame before overt head movement was detected. We then plotted head position over time and fit this with a 6th-order sum of sines equation in MATLAB. The first and second derivatives of this equation described instantaneous head velocity and acceleration during blast, respectively.
Behavioral studies
General health
Blood oxygenation, breath rate, and heart rate were measured before and after blast using a MouseOx Plus (Star Life Science, Oakmont, PA). Intraocular pressure was measured with an AccuPen Tonopen (Elkridge, MD) before and after blast. Mice were weighed the day before blast, the day of blast, and then again the day after blast, 1 week after blast, and 2 weeks after blast.
Motor assessment
Rotarod analysis was performed using a San Diego Instruments (San Diego, CA) rodent rotarod. For the rotarod task, revolutions per minute (rpm) increased from 0 to 30 over a 4-min period, and 30 rpm was then maintained for another 2 min. The first rotarod session was a two-trial training session 2 days before blast, followed by a two-trial test session 1 day before blast. Mice were then tested again the day after blast, 1 week after blast, and 2 weeks after blast. Time to fall was the measure of rotarod performance.
We also conducted an automated 30-min assessment of open field behavior, using a Noldus EthoVision video tracking system to record and digitize the mouse movements (Noldus Information Technology, The Netherlands), and the SEE software of Drai and Golani45 to analyze mouse motor behavior. The SEE software uses algorithms to dichotomize mouse movements into lingering episodes and progression segments, and can calculate further parameters for these, such as speed and acceleration, that are robust in characterizing differences among strains, disease states, or treatment groups.45–50
Each animal was brought from its housing room, introduced into the open field arena, and returned after the 30-min session. The arena was 200 cm in diameter with a nonporous gray floor and a 50-cm high gray wall. Open field sessions were conducted the day before blast, the day after blast, 1 week after blast, and 2 weeks after blast. A DigiGait Imaging System (Mouse Specifics, Inc) was used to assess gait. The DigiGait system uses a high-speed video camera positioned under a transparent motorized treadmill to capture the movements of the paws as they approach, contact, and move away from the belt surface during locomotion.
Each mouse was given a few minutes to acclimate to the chamber enclosing the treadmill, and then to the movement of the treadmill, before video tracking of gait. Several seconds of videotape of the mouse maintaining a steady pace in the center of the viewing field were chosen for the software to analyze. DigiGait analysis was performed before blast, and then again 3 weeks after blast, at 20-cm/sec treadmill speed.
Visual acuity and contrast sensitivity
We used a virtual reality OptoMotry System (CerebralMechanics Inc.: www.cerebralmechanics.com) that allows rapid quantification of acuity and contrast sensitivity in untrained, unrestrained awake rodents, using the optokinetic head response to horizontally moving vertical stripes.51 In this system, four computer monitors surround a small square animal platform and create a virtual cylinder in which vertical sine-wave gratings are presented to the animal. A video camera located above the animal provides a real-time display by which the investigator observes the animal response.
Spatial frequency thresholds can be determined by systematically increasing the spatial frequency of the grating at 100% contrast until animals no longer display tracking behavior. Direction of drum rotation is random from trial to trial, and the experimenter determines from the video display for each stimulus presentation whether the animal moves clockwise or counterclockwise, or not at all. Because the stimulus presentations are computer-controlled and the experimenter is blinded to the stimuli seen by the animal (as well as to the blast pressure the mouse had previously received), the scoring of animal performance by the experimenter is unbiased.
The optokinetic response is driven by temporal to nasal stimulus movement. Thus, clockwise movement of the pattern tests the left eye, and counterclockwise pattern movement tests the right eye. Vision testing was performed 3 weeks after blast. Acuity testing was performed at 100% contrast (i.e., white vs. black stripes), while contrast sensitivity testing was performed at 0.042 cycles per degree (c/d).
Histological studies
Tissue fixation
Histological analysis was performed on fixed tissue to determine the effects of TBI on brain, spinal cord, retina, and optic nerve using a number of approaches: (1) cresyl violet Nissl staining of brain sections; (2) hematoxylin and eosin (H&E) staining of brain sections; (3) immunolabeling of brain, spinal cord, retina, and/or optic nerve sections for NeuN, glial fibrillary acidic protein (GFAP), SMI-32, IBA1 (ionized calcium-binding adapter molecule-1), major histocompatibility complex (MHC) class II antigen, type-2 cannabinoid receptors (CB2), and/or protein kinase C–gamma (PKC-gamma); (4) NeuroSilver staining of brain sections; (5) phenylenediamine staining of optic nerves before plastic-embedding and sectioning at 1 μm; (6) toluidine blue staining of 1-μm sections through plastic-embedded retina; and (7) EYFP visualization of neurons and axons in brain, spinal cord, retina, and optic nerve in EYFP reporter mice.
Post-blast survival times ranged from 2 days to 11 weeks, depending on the specific tissue and histological end-point. Cresyl violet and H&E staining and immunolabeling for NeuN, GFAP, and SMI-32 were used to assess general brain pathology at 2–11 weeks after blast. Immunostaining for IBA1, MHC class II, and CB2 were used to assess microglial activation at 2–77 days after blast. Further details on the blast groups and survival times for approaches #4–7 are described in more detail below.
Mice were deeply anesthetized (Avertin; 0.2 mL/g body weight), the chest opened, and 0.1 mL of heparinized saline (800 U.S.P. units/mL) injected into the heart. They were then perfused transcardially with 40 mL of 0.9% NaCl in 0.1 M sodium phosphate buffer at pH 7.4 (PB), followed by 200 mL of 4% paraformaldehyde, 0.1 M lysine-0.1 M sodium periodate in 0.1 M PB at pH 7.4 (PLP). The brains were removed and stored for at least 24 h in a 20% sucrose/10% glycerol solution at 4°C. A pin was inserted longitudinally into the right side of the brains to distinguish left from right.
The fixed brains were sectioned frozen on a sliding microtome in the transverse plane at 35 μm. Each brain was collected as 12 separate series in 0.1 M PB with 0.02% sodium azide. A one in six series of brain sections from each mouse was mounted as sectioned, and stained for cresyl violet, and an additional series was stained for H&E. Other series were immunostained for the above noted markers (as described in more detail below), or processed by the NeuroSilver method (as described in more detail below).
After perfusion and brain removal, the eyes and optic nerves were removed. Optic nerves were transferred to 4% paraformaldehyde–0.5% glutaraldehyde in 0.1 M PB, and then embedded in plastic, sectioned at 1 μm, and stained with 1% p-phenylenediamine in 50% methanol (PPD) as described in Bricker-Anthony and associates.52,53 For eyes, the corneas were incised, either PLP or 4% paraformaldehyde–0.5% glutaraldehyde in 0.1 M PB infused, and the eyes post-fixed for 2 h in the same fixative infused. Corneas were then dissected free and the lens removed. Eyes fixed with 4% paraformaldehyde–0.5% glutaraldehyde in 0.1 M PB were washed, dehydrated, and embedded in plastic, sectioned at 1 μm, and stained with toluidine blue. Eyes fixed with PLP were washed, stored at 4°C in 20% sucrose in 0.1 M PB, and sectioned at 30 μm using a cryostat. Typically, part of the optic nerve remained attached for all eyes.
After brain/eye removal, the spinal cords were exposed by ventral laminectomy and post-fixed overnight in PLP at 4°C. The thoracic cord was then dissected free, stored at 4°C in 20% sucrose in 0.1 M PB, and sectioned at 30 μm using a cryostat. On-the-slide immunolabeling for eyes and spinal cords was performed as described previously.54
Edema assessment
We used six mice to evaluate edema after TBI based on comparing the wet and dry weights of the brain. At 24 h after blast, the brains from three mice with a 0-psi blast and three mice with a 50-psi blast were quickly removed from the skull and meninges dissected away. The olfactory bulbs were removed, and the brainstem and cerebellum was cut just behind the midbrain. The remaining forebrain–midbrain specimen was cut in half at the midline using a fresh razor blade, each half placed on a pre-weighed piece of aluminum foil, and foil and brain weighed together to determine the weight for each specimen. The brain pieces on their piece of aluminum foil were transferred to an oven at 70°C for 48 h. They were then weighed again to determine their dry weight. The difference between wet and dry weight reflects water content.
Immunohistochemical studies
Immunohistochemical single labeling using peroxidase-antiperoxidase (PAP) procedures described previously55 was used to visualize a variety of markers. Immunolabeling for NeuN was used to detect neuronal perikarya, using a mouse monoclonal anti-NeuN. The specificity and efficacy of the anti-NeuN antibody has been shown previously.56,57 Note that the NeuN antigen has been identified as Fox-3, a new member of the Fox-1 gene splicing family.58 Microglial activation is thought to contribute to the progression of brain injury in many neurodegenerative conditions, including TBI.59,60 We thus used immunolabeling with an antibody selective for the microglial marker IBA1 to determine whether microglia showed morphological alterations reflective of activation.61
In addition, we used immunolabeling with antibodies for MHC Class II antigen and CB2 to evaluate microglial activation, because both are elevated in activated microglia.62–64 IBA1 was detected with a Wako rabbit polyclonal antibody against the conserved IBA1 C-terminus, and the MHC Class II antigen was detected with the mouse monoclonal OX6 antibody from BD Pharmingen.65 CB2 was detected with a rabbit polyclonal antibody (Cayman Chemical). The SMI-32 antibody detects nonphosphorylated heavy neurofilament protein, which is abundant in neuronal cell bodies and dendrites, especially those of pyramidal cortical neurons,66 and its abundance is sensitive to cortical neuron disease and injury.67 To detect corticospinal tract fibers in the spinal cord, we performed immunolabeling for PKC-gamma using a rabbit polyclonal antibody (Abcam).68–70
For PAP immunolabeling, sections were incubated for 24 h at room temperature in primary antibody diluted in 0.8% Triton X-100/0.01% sodium azide/0.1 M PB (PBX). Sections were then rinsed and incubated in donkey anti-mouse IgG or anti-rabbit IgG (depending on the primary antibody) diluted 1:200 in PBX, followed by incubation in the appropriate mouse or rabbit PAP complex diluted 1:1000 in PBX, with each incubation at room temperature for 1 h. The sections were rinsed between secondary and PAP incubations in three 5-min washes of PB.
Subsequent to the PAP incubation, the sections were rinsed with three to six 10-min washes in 0.1 M PB, and a peroxidase reaction using diaminobenzidine tetrahydrochloride (DAB) was performed. Sections were incubated in 5 mL of 0.05 M imidazole/0.05 M cacodylate buffer (pH 7.2) containing 5 mg DAB for 10 min and then incubated for an additional 10 min after adding 20 μL of 3% hydrogen peroxide. Sections were then rinsed in distilled water, transferred to 0.1 M PB, mounted on gelatin-coated slides, dried, dehydrated, and cover-slipped with Permount.®
Immunofluorescence labeling was performed to detect multiple fluorescent markers, typically IBA1 or OX6 in optic tract or nerve in the emx1-Thy1-EYFP reporter mice. For these studies, we used the rabbit polyclonal anti-IBA1 or the mouse monoclonal OX6 antibody. Slide-mounted cryostat sections of eye and optic nerve or free-floating sections of brain were incubated overnight at room temperature in the primary antibody, as described previously.54,71 The sections were then rinsed three times and incubated for 2 h at room temperature (with gentle agitation in the case of free floating) in an Alexa 594-conjugated goat anti-mouse or rabbit IgG (Molecular Probes; Eugene, OR).
Sections were rinsed three times in 0.1M PB after incubation in secondary antibody, free-floating sections were mounted on gelatin-coated slides, and all slides were cover-slipped with ProLong® antifade medium (Molecular Probes, Eugene, OR). Sections were viewed and images captured using a Zeiss 710 confocal laser-scanning microscope (CLSM).
NeuroSilver
Free-floating sections from mice sacrificed at 2–6 weeks after blast were processed with a commercially available modification of the Gallyas silver method (NeuroSilver kit II; FD Neurotechnologies, Ellicott City, MD), using manufacturer instructions, to detect degenerating axons.67
Thy1-EYFP–Emx1-cre reporter mice
Thy1-EYFP–Emx1-cre mice at 2–16 days post-blast were transcardially perfused with fixative and sectioned as described above. To examine axon injury, sections were mounted on gelatin-coated slides, dried, dehydrated, and cover-slipped with ProLong antifade medium (Molecular Probes) and viewed using the Zeiss 710 CLSM. To study forebrain neuron loss, PAP immunolabeling with a mouse monoclonal anti-GFP from Rockland Antibodies (which cross-reacts with EYFP) was used to render EYFP detectible by transmitted light microscopy.
Morphometry
The extent of cortical neuron labeling for SMI-32 was evaluated at 3 weeks after blast in coronal sections at the level of globus pallidus internus. This level corresponds to Bregma-1.5 in the mouse atlas of Franklin and Paxinos72 and is located at the approximate middle of the blast area. In normal mice at this level, the dendrites and perikarya of neurons in layers 3 and 5 of somatosensory and cingulate cortex are rich in SMI-32. NIH ImageJ software was used to measure the percent of the cerebral cortex occupied by SMI-32 imunoreactivity in mice with a range of blast pressures (six 0-psi, two 20-psi, two 25-psi, two 30-psi, two 40-psi, five 50-psi, five 60-psi).
In addition, blinded stereological neuron counts were performed for cerebral cortex in mice 45 days after 0-psi sham blast or 60-psi blast, using a 1-in-12 series of coronal sections immunolabeled for NeuN from the rostral end of striatum to the anterior commissure, as described previously.50 Unbiased stereological counts were obtained using Stereo Investigator (Micro-Brightfield, Colchester, VT) with the optical fractionator method.
To evaluate the effects of blast on forebrain volume, blinded image analysis was performed as described previously.50,73 In brief, an image of each section through the forebrain in a 1-in-12 cresyl violet series (3–6 weeks after blast), or a 1-in-12 SMI-32 immunostained series (2 weeks after blast), from the rostral telencephalic pole to the diencephalon, was captured using an Aperio ScanScope XT scanner. NIH ImageJ software was used to measure the area occupied by the forebrain from the end of the olfactory bulb to the level at which the internal capsule detaches from the diencephalon. Section thickness and spacing were used to calculate volume from the area measurements.
Quantification of the dorsal corticospinal tract (dCST) used images of PKC-gamma immunostained transverse sections of upper-midthoracic levels of spinal cord from 50–60 psi blast versus sham blast mice 1–2 months after blast. Blinded image analysis using Image J was then used to threshold the labeled fibers in the left and right dCST and measure the relative fiber abundance in the selected area. To assess the time course of axon pathology, swollen axon bulbs and microglia per unit area were counted blinded in the right optic tract of 0-psi and 60-psi mice at 1, 3, 5, 7, and 16 days after blast, using EYFP reporter mice and SMI-32 immunostained tissue.
We determined the number of degenerating optic nerve axons at 2–3 weeks and 7–9 weeks after various blast pressures, and measured surviving axons at 10–11 weeks after sham versus 50-psi blast. For counts of degenerating and healthy axons, plastic-embedded 1-μm thick optic nerve cross-sections were analyzed using the StereoInvestigator software in a blinded manner. Forty 5-μm by 5-μm fields were randomly counted per optic nerve cross-section. Normal axons possess a dark myelin ensheathment surrounding the clearly visible pale cytoplasm of the axon, whereas degenerating axon profiles possessed unraveling myelin sheaths and cytoplasm that was either darkened or pale and full of cellular debris. The cytoplasm of degenerating axons also often looked distended. Two sections were analyzed per optic nerve per mouse to determine axon number and count degenerating axon profiles.
Retinal thickness was measured in tissue from 50–60 psi blast versus sham blast mice 10–11 weeks after blast. To measure retinal thickness, images were taken from at least three fields of retina from its midpoint. These images were then measured blinded, for total retinal thickness, inner nuclear layer (INL) thickness, and inner plexiform layer (IPL) to nerve fiber layer (NFL) thickness. Total retinal thickness was measured from the outer edge of the retinal pigmented epithelium (RPE) to the inner edge of the NFL. Inner plexiform layer to NFL measurements were taken from the inner edge of the INL to the outer edge of the NFL. The resulting measurements from each eye were averaged to yield a thickness for each retina, as well as for the sublayers.
Statistics
Parametric t tests were used to evaluate differences between groups in instances in which only two blast levels were involved. For comparisons of effects among more than two blast levels, analysis of variance (ANOVA) was used, followed by individual planned comparisons using the Fisher PLSD test. Statistical analysis was performed using Microsoft Excel for t tests and SPSS 22 (SPSS Inc., Chicago, IL) for ANOVA.
Results
Blast characterization
We calibrated the amplitude and duration of blasts ranging from 20–70 psi, and videotaped mice during blast to evaluate blast dynamics. The 20-, 40- and 60-psi blasts, for example, had times to peak of 2.48 msec, 4.38 msec, and 4.96 msec, respectively, with total blast duration also increasing with increasing blast amplitude (Fig. 2B). Schlieren imaging of the blast pressure wave revealed Mach disk formation in the wake of the blast, indicating its movement at supersonic speed (Fig. 3). Mach disks are characteristic of the underexpanded supersonic exhaust from a nozzle, such as the compressed air plume from a rocket exhaust, and they occur as the under-expanded gas equilibrates with ambient air pressure in the form of multiple internally reflected shocks.44 We measured the angle formed by the intercepting shock and the jet boundary, known as the Mach angle, to calculate the speed of the blast wave44 and determined that a 60-psi blast leaves the blast gun nozzle at Mach 1.7.
FIG. 3.
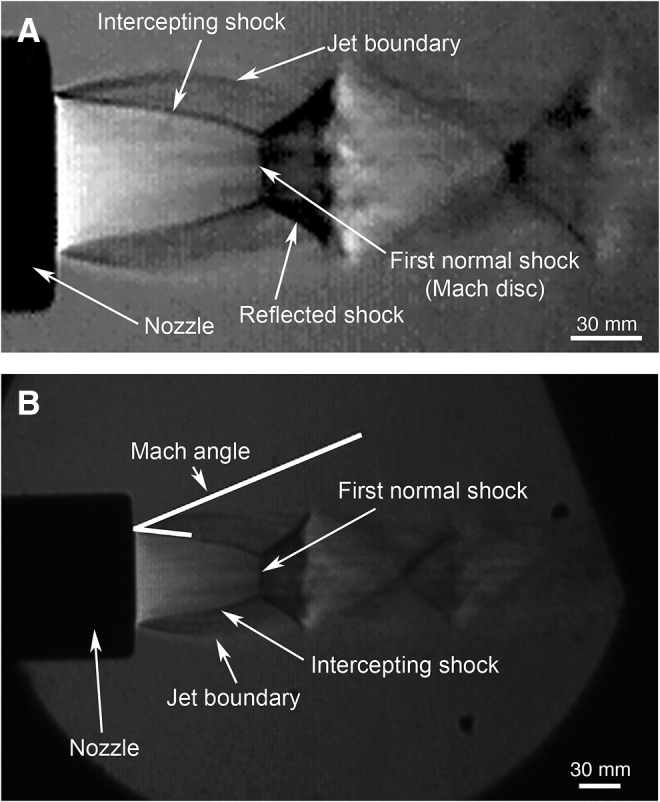
High speed Schlieren imaging of the blast pressure wave from the gun barrel tip reveals Mach disk formation in the wake of the blast (A), indicating that the peak pressure output moves at supersonic speed. Measurements of the angle formed by the intercepting shock and the jet boundary, known as the Mach angle (B), were used to calculate the speed of the blast wave as it leaves the blast gun nozzle.44 Image A is an enlarged and higher contrast view of the original image in B, shown for easier visualization of the Mach disks and other blast features.
The high-speed video imaging of the mouse showed that the foam cushioning limits but does not prevent head movement, with up to about 0.9 cm of displacement occurring with both 30-psi and 60-psi blasts. The video record was used to measure head position in each frame (about 0.9 msec apart) after the onset of blast impact, which we then plotted and fit with a 6th-order sum of sines equation (Fig. 4). Peak head displacement was achieved around the 5th msec after the blast wave had reached the mouse head and slightly sooner for 60-psi than 30-psi blasts (Fig. 4A).
FIG. 4.

Graphs illustrating mean fitted head displacement (A) for 30-psi (n = 5) and for 60-psi (n = 5) blasts as determined from high-speed video records, derived mean head velocity (B), and derived mean head acceleration (C). The head showed similar displacement with both 30- and 60-psi blasts, and the head velocity and the acceleration profiles over time were also similar. Color image is available online at www.liebertpub.com/neu
During peak head displacement, the head compressed rightward into the foam surrounding and supporting it. The foam then decompressed and displaced the head back to a position slightly beyond its initial one in the case of 30-psi blast and just short of its initial position in the case of the 60-psi blasts. Note that because the 30-psi blast wave duration is only 7 msec while the duration for the 60-psi blast is 14 msec, the head after a 60-psi blast was moving into the 9-msec tail of the 60-psi blast, but only into the 2-msec tail of the 30-psi blast (also see Fig. 5). This may explain, in part at least, why head position did not return to its start point in the case of 60-psi blasts.
FIG. 5.

Graphs relating mean head displacement and the blast pressure wave for 30-psi blast (A) in comparison with that for 60-psi blast (B). The vertical black lines in A and B mark the peak head displacement. The scale for blast pressure is to the left and head displacement to the right. Note the blast force before peak head displacement is twice as great for 60-psi blast, and the blast force after peak head position is about 10 times as great for 60-psi blast. Color image is available online at www.liebertpub.com/neu
Reflecting the head displacement data, head velocity for the 60-psi blasts reached a peak of 311.7 cm/sec at about 2.5 msec after the blast initially reached the mouse head (Fig. 4B). The head slowed to zero velocity at about 5 msec as it compressed into the foam, and then velocity gradually increased again until the 7th msec as the head was pushed by the decompressing foam back toward its initial position (shown as negative velocity in the graph because of the reverse in direction). Head movement then slowed once more and reached zero velocity by about 20 msec after blast impact.
The rapid initial increase in velocity yielded high initial acceleration (Fig. 4C) over the first msec of blast for 60-psi blasts (179.3g-force). Head acceleration slowed over the next few msec as the head compressed into the foam, but increased again to −176.6g-force by the 5th msec as the head was pushed back to its initial position, and then hovered around zero after the 7th msec. A similar pattern of results was seen for 30-psi blasts, but with the head velocity reaching a slightly lower and later peak of 269.2 cm/sec at 4.5 msec after the initial blast impact. The peak initial acceleration was correspondingly less (89.4g-force), and the initial positive and subsequent negative acceleration peaks were slightly later than those seen for 60-psi blasts.
Whereas both 30- and 60-psi blasts produce a peak head displacement of about 9 mm, 20-psi blasts maximally displaced the head only about 5.5 mm (data not shown). Thus, a blast force of at least 30-psi is needed to maximally displace the head into the foam. Because the duration of a 30-psi blast largely coincides with the time needed for maximal head displacement, much of a 30-psi blast force appears devoted to head displacement. By contrast, the force of a 60-psi blast occurring before peak head displacement is about twice that needed to displace the head, by the criterion set by 30-psi blasts (Fig. 5). The remaining force from the 60-psi blast would then produce a pressure wave that propagates through the skull and brain, causing rapid brain tissue deformation (alternating compression and stretching as the wave passes through the tissue). Very little of the 30-psi blast force occurs after peak head displacement, whereas about half of the 60-psi blast force occurs after this time.
We estimate that the total blast force available to produce a pressure wave through the brain case (total force before peak head displacement minus that needed to displace the head + total force after peak head displacement) is about 15 times greater for a 60-psi than 30-psi blast. By contrast, mean absolute head acceleration for the 60-psi and 30-psi blasts was very similar (60-psi to 30-psi ratio = 1.03) over the 15 msec after the arrival of the blast at the head, as is the amount of time the head spends at or beyond 100 g-forces (positive or negative)—(3.7 msec for 60-psi blast, 2.4 msec for 30-psi blast, for a ratio of 1.57 to 1). Thus, the much greater behavioral impairments and morphological signs of injury (described below) that we observed with 60-psi blasts than with 30-psi blasts are likely to stem largely from the pressure wave propagating through the skull and brain, rather than from the head acceleration caused by the blast.
Behavioral studies
Survival and health
Mice routinely survived blasts ranging from 20 to 40 psi, while 98.6% survived 50-psi blasts and 91.5% survived 60-psi blasts. No mice survived 70-psi blasts, and so 70-psi blasts were discontinued. Autopsy revealed that mice that died after 50-psi to 70-psi blasts tended to have widespread intracranial and subdural bleeding (not shown), indicating that the blast had damaged major brain blood vessels. Mice showed no abnormalities in heart rate, blood oxygenation, or breath rate, during or after 50-psi blast compared with 0-psi blast. The intraocular pressure (IOP) measured minutes after blast did not differ from that measured before blast.
Mice receiving blast recovered from anesthesia as quickly as did mice that received sham blast. We found no significant weight loss over the 2-week period after blast (Table 1). Thus, a 50-psi blast did not typically adversely affect the overall health of mice and appears to be the optimal blast level for creating mild TBI with our approach.
Table 1.
Mouse Weights before and after Blast of Different Levels
| Mouse TBI groups | Pre-blast day weight (g) | Blast day weight (g) | Post-blast day 1 weight (g) | Post-blast week 1 weight (g) | Post-blast week 2 weight (g) | Age in days on blast day | Number of mice assessed |
|---|---|---|---|---|---|---|---|
| 0–20 psi | 25.3 | 25.0 | 24.7 | 25.3 | 25.8 | 85.9 | 39 |
| 25–40 psi | 26.2 | 26.5 | 26.0 | 26.4 | 27.2 | 86.1 | 48 |
| 50–60 psi | 25.3 | 25.2 | 24.6 | 25.3 | 25.6 | 87.0 | 43 |
| Mouse TBI groups | Pre-blast day weight (% of pre) | Blast day weight (% of pre) | Post-blast day 1 weight (% of pre) | Post-blast week 1 weight (% of pre) | Post-blast week 2 weight (% of pre) | Age in days on blast day | Number of mice assessed |
|---|---|---|---|---|---|---|---|
| 0–20 psi | 100.0% | 99.0% | 97.9% | 99.9% | 101.9% | 85.9 | 39 |
| 25–40 psi | 100.0% | 101.0% | 99.1% | 100.7% | 103.7% | 86.1 | 48 |
| 50–60 psi | 100.0% | 99.5% | 97.4% | 100.0% | 101.4% | 87.0 | 43 |
Table shows weights both in grams (first four rows) and as a percent of pre-blast weight (last four rows). Blast did not significantly affect weight over the 2 weeks after blast.
Motor assessment
Sham blasted and 20-psi blasted mice showed a slightly better performance on rotarod on the day after blast compared with the day before blast (Fig. 6A). Their performance improved yet further on the first and second weeks after the blast session. The mice subjected to blasts of 25–40 psi showed no significant motor deficits on rotarod compared with 0–20 psi mice (Fig. 6A), either overall by ANOVA, or specifically at 1 day, 1 week, or 2 weeks post-blast.
FIG. 6.

Comparison of the effects of 0–20 psi blasts, 25–40 psi blasts, and 50–60 blasts on rotarod motor performance (A), and a series of motor end-points in open field (B–H). Note that motor performance is impaired for 50–60 psi mice on most parameters (other than acceleration), but for very few parameters in the case of 25–40 psi blast (notably distance in open field). Red asterisks at each time point indicate a significant difference between 50–60 psi mice and 0–20 psi mice, while a red asterisk to the right indicates a significant overall difference between 50–60 psi mice and 0–20 psi mice. Red pound signs at each time point indicate a significant difference between 50–60 psi mice and 25–40 psi mice. Green asterisks at each time point indicate a significant difference between 25–40 psi mice and 0–20 psi mice, while a green asterisk to the right indicates a significant overall difference between 25–40 psi mice and 0–20 psi mice. Color image is available online at www.liebertpub.com/neu
Similarly, the 25–40 psi mice showed no significant deficits in progression segment mean speed, progression segment maximum speed, acceleration, progression segment length, or turn radius overall compared with 0–20 psi mice. The 25–40 psi mice also did not differ from 0–20 psi mice for any of these parameters at 1 day, 1 week, or 2 weeks post-blast, except in the case of a reduction in maximum speed at 1 week (p = 0.027) (Fig. 6C–G). They did, however, show a consistent 10% shortfall in distance traveled at all post-blast time points compared with 0–20 psi mice (Fig. 6B), leading to a significant overall effect of 25–40 psi blast by ANOVA (p = 0.008), and a significant specific reduction at 2 weeks (p = 0.040).
By contrast to 25–40 psi mice, mice that underwent blasts of 50–60 psi showed more prominent motor deficits beginning 1 day post-blast. For example, rotarod performance for the 50–60 psi mice was significantly poorer overall by ANOVA than for the 0–20 psi mice (p = 0.018) and 25–40 psi mice (p = 0.001) (Fig. 6A), and at 1 day for the 0–20 psi mice (p = 0.029) and 1 day and 1 week for the 25–40 psi mice (p = 0.007; p = 0.021). By 2 weeks, however, the rotarod deficit had abated and was no longer significant compared with either the 0–20 psi or the 25–40 psi mice.
Similarly, progression segment speed (p = 0.014), progression segment maximum speed (p = 0.002), progression segment length (p = 0.001), and turn radius in open field (p = 0.001) were all poorer in mice with 50–60 psi blasts than in mice with 0–20 psi blasts overall by ANOVA. In addition, the number of stops-per-unit-distance was significantly increased (p = 0.001), and total distance traveled was significantly reduced by about 10% (p = 0.008).
The 50–60 psi mice also performed more poorly than the 25–40 psi mice on progression segment length (p = 0.006), turn radius (p = 0.008), and stops per unit distance (p = 0.002). The 50–60 psi mice were significantly worse than the 0–20 psi mice on progression segment length at 1 day (p = 0.033), 1 week (p = 0.020), and 2 weeks (p = 0.032), stops per unit distance at 1 day (p = 0.025), 1 week (p = 0.035), and 2 weeks (p = 0.002), maximum speed at 2 weeks (p = 0.027), speed at 1 week (p = 0.039), and turn radius at 1 week (p = 0.045), and 2 weeks (p = 0.041) (Fig. 6B–H). The 50–60 psi mice were also significantly worse than the 25–40 psi mice on progression segment length at 1 day (p = 0.030), stops per distance at 1 day (p = 0.022), and on turn radius at 2 weeks (p = 0.028). We also found that 50–60 psi blasts produced a mild deficit in gait symmetry compared with 0–20 psi mice, as measured using DigiGait (p = 0.0322).
OptoMotry
Optomotor visual testing at 3 weeks after blast in 22 mice with 20–30 psi blast, and 17 mice with 35–40 psi blast (compared with 18 untreated mice, and 24 sham blasted mice) revealed normal visual acuity (about 0.4 cycles per degree) in both eyes, and no statistically significant differences between any of these groups by ANOVA with post hoc comparisons (Fig. 7A). By contrast, we observed significantly impaired visual acuity in both eyes of 19 mice with 50–60 psi blast. Acuity in the left eye after 50–60 psi blasts was reduced to 74.7% of sham blast left eyes (p < 0.0001), and right eye acuity was 57.0% of that in right eyes from sham blasted mice (p < 0.0001).
FIG. 7.

Effect of blast on visual acuity (A) and contrast sensitivity (B). (A) Optomotor visual testing in mice with 20–40 psi blast revealed normal visual acuity measured at 100% contrast in both eyes compared with sham blasted or normal mice. Visual acuity in both eyes of 50–60 psi blast mice was diminished. (B) Contrast sensitivity was also significantly reduced in 50–60 psi mice compared with 0-psi mice—that is, the 50–60 psi mice needed more contrast to discriminate 0.042 c/d than did sham mice. Asterisks indicate significant differences between 50–60 psi and sham (0-psi) mice. TBI, traumatic brain injury. Color image is available online at www.liebertpub.com/neu
Because acuity deficits were only evident after 50–60 psi blasts, we restricted evaluation of contrast sensitivity to mice receiving 50–60 psi blasts compared with sham blasts. Whereas sham eyes were able to detect 0.042 c/d with about 44% contrast, 3 weeks after 50–60 left side blast contrast sensitivity was significantly reduced in both eyes (Fig. 7B). For example, in the left eye (n = 19) after 50–60 psi blasts, 86.6% contrast was required (nearly black on white) to detect 0.042 c/d (p = 0.0001). The contrast sensitivity for the right eye (n = 19) after a left side blast of 50–60 psi showed a smaller, but still significant reduction—68.3% contrast was needed to detect 0.042 c/d (p = 0.016). As discussed below, left cranial blast caused different pathologies in the two eyes, which may explain the difference in visual deficits for the two eyes.
Histological analysis
General histology of brain
Neither cresyl violet staining, H&E staining, nor NeuN or SMI-32 (Fig. 8) immunolabeling, nor examination of EYFP labeling in the reporter mice revealed obvious contusive injury or foci of neuron loss in the left cerebral cortex (blast side) or right cerebral cortex (contrecoup side) in any of the mice during the first 2 months after blast, as we reported previously in Heldt and colleagues.43 Similarly, no obvious increase in astrocytic GFAP was observed in the cerebral cortex at any time after blast (data not shown).
FIG. 8.

Images of SMI-32 immunostained tissue showing that although no major brain injury is apparent after 50-psi (E) or 60-psi blasts (F) compared with 0-psi (A), 25-psi (C) or 30-psi blasts (D), brains with 50–60 psi blast are enlarged compared with brains with 0–40 psi blast. The two bands of cortical immunostaining represent labeled neurons and their processes in layers 3 and 5 and do not differ in their regional extent between 0–40 psi and 50–60 psi mice (B). Pinholes mark the right side of brain (i.e., the nonblast side) in images A, C, D, E, as indicated by asterisks. The pin passed through the ventricle at the level shown in F. Images A and C–F are at the same magnification. Color image is available online at www.liebertpub.com/neu
We further evaluated the effect of blast on forebrain neuronal integrity by determining the extent of cortical labeling for SMI-32 at the level of globus pallidus internus. At this level, the dendrites and perikarya of neurons in layers 3 and 5 in the somatosensory and cingulate cortex appeared to be equally rich in SMI-32 in mice with blast intensities ranging from 0-psi to 60-psi. Image analysis confirmed that the percent of left cerebral cortex occupied by SMI-32 immunolabeling in 50–60 psi mice (27.2%) did not differ significantly (p = 0.3657) from that in 0–40 psi mice (27.0%) at 3 weeks after blast (Fig. 8B). Similarly, the percent of right cerebral cortex occupied by SMI-32 immunolabeling in 50–60 psi mice (24.8%) did not differ significantly (p = 0.3396) from that for 0–40 psi mice (27.7%).
Thus, neither side of the brain showed cortical injury at 3 weeks after 50–60 psi blast in terms of loss of SMI-32 immunoreactive neurons or their processes in the somatosensory and cingulate cortex (Fig. 8). Blinded stereological neuron counts, however, revealed an overall 12.3% loss of neurons from cerebral cortex 45 days after 60-psi blast compared with sham blast (p = 0.0192), which was fairly similar for the two sides of the brain (12.9% left side loss vs. 11.7% right side loss). Thus, slight, seemingly scattered neuron loss occurred in the cerebral cortex by 6–7 weeks after 60-psi blast.
Macroscopic examination of brain sections suggested slight forebrain enlargement after 50–60 psi blast (Fig. 8). Blinded measurements of cresyl violet stained material confirmed a significant 7.7% enlargement (p = 0.00047) of forebrain 3–6 weeks after 50–60 psi blasts (n = 39) compared with 0–40 psi blasts (n = 54). Blinded measurements of SMI-32 immunostained material 2 weeks after blast yielded a similar result, showing a significant 11.6% enlargement (p = 0.0129) of forebrain after 50–60 psi blasts (n = 7) compared with 0–20 psi blasts (n = 7) (Fig. 8).
These results suggested that 50–60 psi blasts produce some brain edema. To confirm this, we measured wet and dry brain weight in mice 1 day after 0-psi or 50-psi blast. We found a significant 0.8% increase in water content 1 day after 50-psi blast (p = 0.006), with the increase the same for the two sides of the brain. Despite this evidence for edema, no obvious signs were seen of blood vessel damage or perivascular anomalies. Moreover, H&E stained sections of mice 3–4 weeks after 50–60 psi blast were examined for evidence of peripheral leukocyte invasion, but no overt signs were found.
Axonal injury
The 50–60 psi blasts yielded axonal pathology in diverse brain regions, while axonal pathology after 20–40 psi blasts was infrequent and limited to the optic nerve (see below). Over the first 2–7 days after 50–60 psi blast, swollen axonal varicosities and bulbous endings were present in SMI-32+ immunolabeled sections and in the Thy1-EFYP – emx1-cre reporter mice (Fig. 9). This type of axonal morphology is thought to reflect microtubule disruption and the resulting blockage of axonal transport.
FIG. 9.
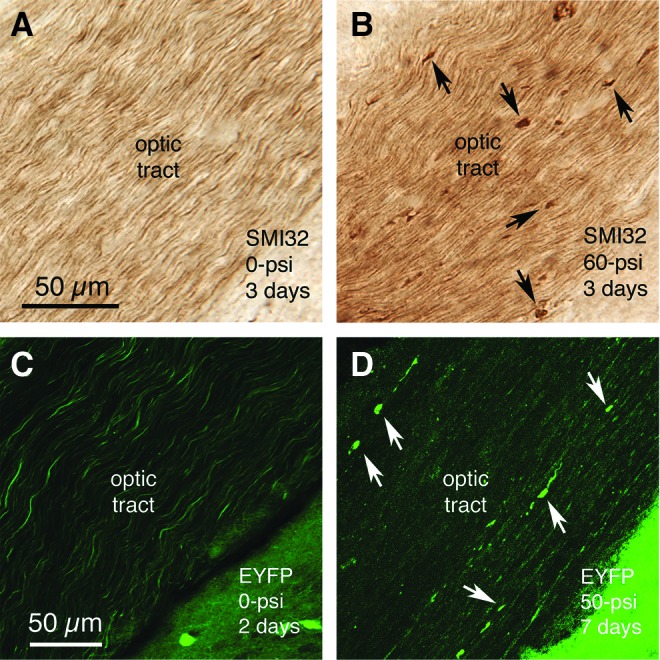
Swollen axon bulbs form in the optic tract by 2–7 days after 50–60 psi blasts, as visualized by SMI-32 immunostaining of optic nerve axons (A, B), or enhanced yellow fluorescent protein (EYFP) labeling in reporter mice (C, D). Note that more bulbs are evident in the SMI-32-immunostained material, because many fewer optic tract axons are EYFP-labeled in the reporter mice than are immunostained for SMI-32. Some of the axon bulbs in B and D are indicated by arrows. Images A and B are at the same magnification as one another, and images C and D are at the same magnification. Color image is available online at www.liebertpub.com/neu
Axonal bulbs were seen in the optic tract, the pyramidal tract, the medial lemniscus, the lateral lemniscus, and the cerebellar peduncles. Injured axons were more abundant on the right side for the optic tract (as retinal ganglion cell axons in the optic nerve cross at the optic chiasm before they continue into the optic tract), and on the left side for the pyramidal tract, medial lemniscus, lateral lemniscus, and cerebellar peduncles. Swollen axon bulbs in the right optic tract (i.e., the continuation of the left optic nerve) peaked in abundance at 3 days post-blast (24.02 swollen bulbs per 100 square microns), declined to 43.1% of peak abundance by 7 days blast, and were at control levels by 16 days after blast.
This temporal pattern was generally true throughout brain. The decline in axon bulbs did not necessarily mean the damaged axons had recovered, however, because at 3–4 weeks after blast, NeuroSilver staining revealed degenerating axons in the same locations in which we had observed axon bulbs (Fig. 10). Moreover, consistent with the axonal pathology in the left pyramidal tract, immunolabeling of the dorsal corticospinal tract for PKC-gamma showed a significant 10% atrophy on the right side (the left pyramidal tract gives rise to the right corticospinal tract as it crosses the midline at the spinomedullary junction) at thoracic levels in 50–60 psi mice (n = 28) compared with 0–20 psi mice (n = 27) at 1–2 months after blast (p = 0.0037) (Fig. 11).
FIG. 10.
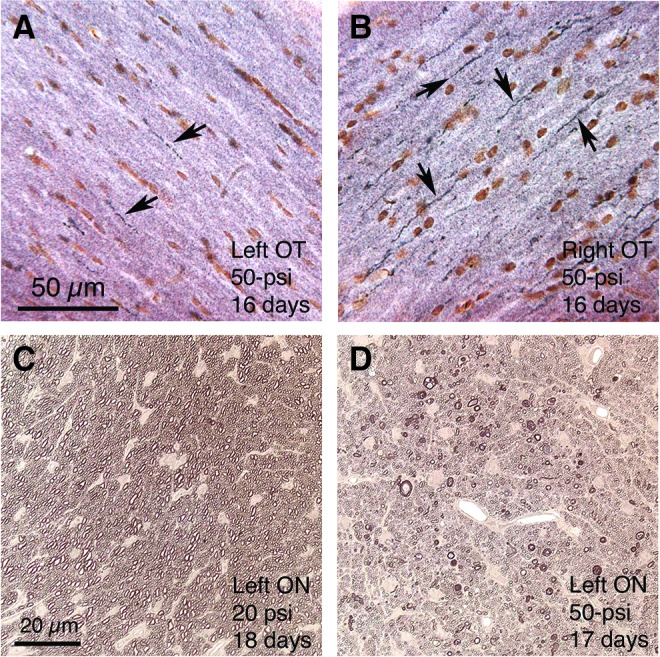
Images show degenerating axons in the right optic tract (A, B) and left optic nerve (C, D) following 50-psi blast. A, B: the right optic tract contains many degenerating axons, as revealed by NeuroSilver staining, and the left optic tract only a few, 16 days after a 50-psi left cranial blast (some degenerating axons are indicated by arrows). Because the right optic tract is formed mainly by contributions from the left optic nerve in mice, these results suggest that the left optic nerve was injured by the left cranial blast. Degenerating axons in the left optic tract are presumed to be uncrossed axons form the left optic nerve. C and D show that 50-psi but not 20-psi blasts cause axonal degeneration in the left optic nerve, as viewed in plastic-embedded 1-micron sections in which axons are stained with phenylenediamine. The many degenerating axons in D are evident as enlarged and darkened profiles, while normal myelinated axons are evident in C. Images A and B are at the same magnification as one another, and images C and D are at the same magnification as one another. Color image is available online at www.liebertpub.com/neu
FIG. 11.
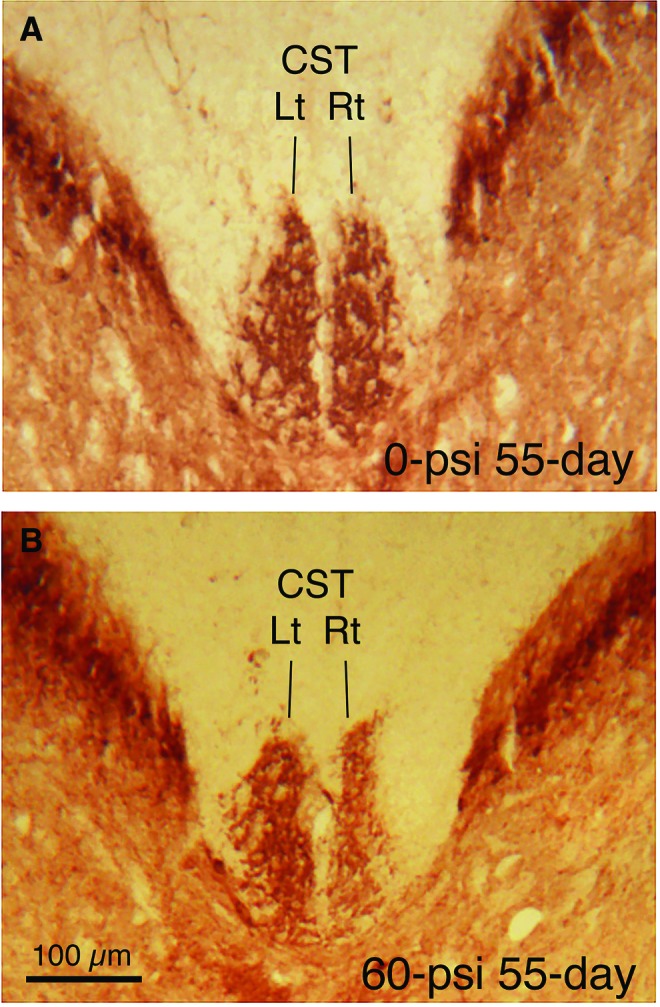
Transverse sections of the spinal cord at midthoracic levels immunostained for protein kinase C-gamma to visualize the dorsal component of the corticospinal tract (dCST). The dCST on the right side of the spinal cord is decreased in size after a 60-psi blast. Because the axons of pyramidal cortical neurons cross the midline at the spinomedullary junction before descending in the CST, these results are consistent with left pyramidal tract injury by blast to the left side of the cranium. Images A and B are at the same magnification. Color image is available online at www.liebertpub.com/neu
Consistent with the axonal pathologies in the right optic tract described above, we found many degenerating axons in the left optic nerve at 2–3 weeks after 50–60 psi blasts (Fig. 10), but few degenerating axons at 7–9 weeks, suggesting active degeneration had waned by then. The degenerating axons were characterized by unraveling of the myelin sheath, distended cytoplasm, and either unusually opaque or translucent cytoplasm. Many degenerating axons were also seen in the left optic nerve after 40-psi blasts and in some of the left optic nerves from 30–35 psi mice. By comparison, only a few degenerating axons were seen in either optic nerve from mice with 0–25 psi blasts and in the right optic nerves from mice with 30–60 psi blasts.
Axon counts indicated that the mean abundance of degenerating axons in the left optic nerve at 2–3 weeks after 40–60 psi blast (60.8, n = 6) was significantly more (p = 0.0289) than in 0–25 psi mice (15.8, n = 8). By contrast, degenerating axon abundance in the right optic nerve after both 0–25 psi blasts and 40–60 psi blasts did not differ significantly from that in the left optic nerve from mice with 0–25 psi blast. Thus, the blast wave targeted to the left forebrain appeared to damage axons in the ipsilateral (left) optic nerve, which cross at the chiasm and continue in the right optic tract (note that >90% of optic nerve axons cross at the optic chiasm in mice74).
We next examined whether this evidence of post-blast injury to the left optic nerve would later result in axon loss. Although left optic nerve axon abundance at 10–11 weeks after 50-psi blast (49,743, n = 10) was 5.2% less than in 0-psi mice (52,449, n = 11), this difference trended toward but did not achieve significance (p = 0.1376). For these same mice, mean right optic nerve abundance was nearly identical between 50-psi (52,046) and 0-psi mice (51,435).
Retinal histology
The left retina was 11.6% thinner 10 weeks after 50–60 psi blast (n = 12) compared with that in sham blasted mice (n = 12). The most prominent thinning was in the inner nuclear layer (14.2%) (p = 0.042) and the photoreceptor layers of the outer retina (14.4%) (p = 0.027). Cells in the ganglion cell layer were also reduced in abundance, although we do not know if this reflects ganglion cell loss, since we could not distinguish ganglion cells from displaced amacrine cells in our plastic-embedded sections. At 10 weeks after blast, the right eye showed no loss of cells from the right eye ganglion cell layer, but the inner retina was significantly thickened (11.6%, p = 0.024), suggesting it was edematous.
Microglial response
IBA1 immunolabeling of microglia revealed a prominent activation in fiber tracts that contained degenerating axons after 50–60 psi blasts, and in their target areas, over the same time frame as axon bulbs were observed (Fig. 12). The activation was manifested by the increased size and labeling intensity of the microglial cells. Regions with prominent microglial activation at 2–7 days included the pyramidal tract in the pons, the medial lemniscus and its target area in the ventral posterior thalamus, and the cerebellar white matter. Activated microglia were present in the right optic tract and its target areas in the right dorsal lateral geniculate and superior colliculus.
FIG. 12.
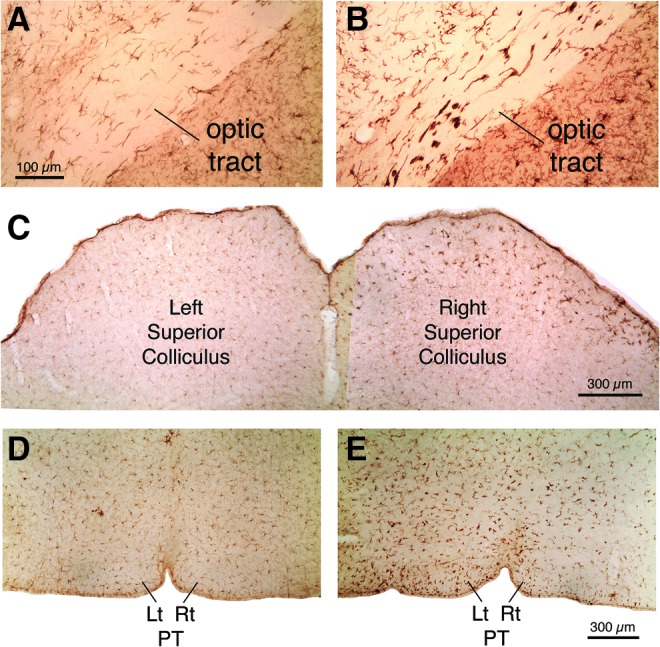
Transverse sections immunostained for the microglial marker IBA1, showing microglial activation in the right optic tract (B), right superior colliculus (C), and left pyramidal (E) tract 3 days after a left cranial 60-psi blast, compared with the right optic tract (A), right superior colliculus (C), and left pyramidal tract (D) 3 days after sham blast. Images A and B are at the same magnification as one another, and images D and E are at the same magnification as one another. Color image is available online at www.liebertpub.com/neu
Counts of activated versus quiescent microglia in the right optic tract revealed that by 3 days after blast, the majority of its microglia appeared to be activated. This persisted through 7 days post-blast, but was no longer evident by 2 weeks after blast. Many microglia in the right optic tract also showed elevated levels of CB2-type cannabinoid receptors (not shown) and OX6 during the first week after blast, consistent with their activated state (Fig. 13).
FIG. 13.
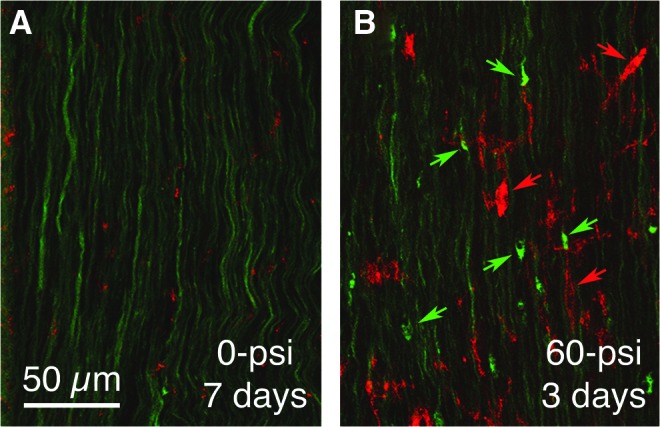
Immunostaining for the activated microglial marker OX6 (red) in right optic tract of a 60-psi blasted enhanced yellow fluorescent protein (EYFP)-reporter mouse (B) compared with a sham blasted EYFP-reporter mouse (A), 3 days after blast. The EYFP labeling is green in both. Note the axon bulbs in B (green arrows) and OX6+ microglia (red arrows). Color image is available online at www.liebertpub.com/neu
Interestingly, both IBA1-rich microglia and swollen axonal bulbs were especially numerous at the root of the left optic nerve as it exited the retina (Fig. 14), suggesting this location is particularly vulnerable to the forces created by the 50–60 psi blast wave traversing the cranium. IBA1-rich microglia and swollen axon bulbs were also present in the retina after the 50–60 psi blast, with at least some of the swollen axon bulbs probably belonging to off-center ganglion cells, identified as such by the ramification of their EYFP+ dendrites in the outer sublayer of the inner plexiform layer (Fig. 14B).
FIG. 14.
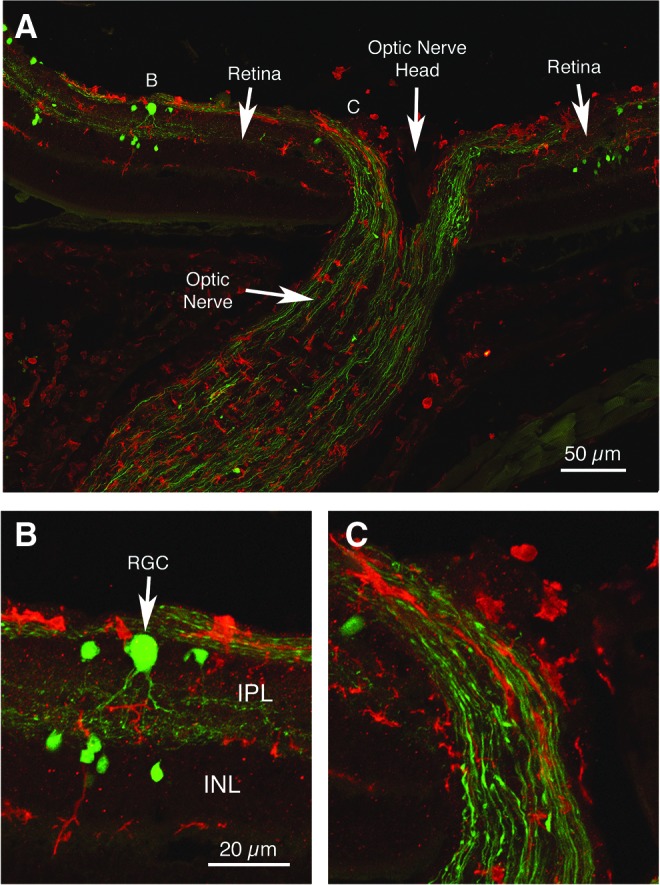
Immunostaining for IBA1 (red) showing activated microglia in the right optic nerve and retina of a 60-psi blasted enhanced yellow fluorescent protein (EYFP)-reporter mouse, 3 days after blast. Note the EYFP+ axon bulbs (green) in the optic nerve exiting the retina (A, C). The swollen axon bulbs in the retina and optic nerve appeared to belong to off-center ganglion cells, because EYFP+ retinal ganglion cell dendrites (RGC) ramified in the outer sublayer of the inner plexiform layer (B). The letters B and C in image A indicate the location of the enlarged views shown in images B and C. Images B and C are at the same magnification as one another. IPL, inner plexiform layer; INL, inner nuclear layer. Color image is available online at www.liebertpub.com/neu
Discussion
We adapted the overpressure air blast system originally developed to produce ocular blast injury in mice by Hines-Beard and associates40 for the purpose of creating mild TBI. In our approach, we target an air pressure blast to a small area at the side of the head, specifically the region overlying the parietal and squamosal bones, with the head secured and stabilized by foam. Our model produces a closed-head mild concussive brain injury without lung damage, cardiovascular pressure surge, or direct injury to other head structures, and without significant contribution from head acceleration.
The temporal and physical dynamics of the forces causing shock wave-mediated mild brain injury in our model suggest they mimic those associated with an explosion or a blow to the head.34,75–78 The initial rise times of the blast pressure waves were rapid,1 msec or less depending on the peak blast pressure, and reached a peak 2–4 msec after onset. Blast durations were brief as well, ranging from 5–15 msec depending on the peak blast pressure. In these regards, our blast dynamics are similar to those for explosive blast, although this varies with the explosive material and proximity to the blast source,77,79 as well as to those obtained with shock tubes, which are designed to simulate explosive blast pressure waves.19,75,77,80,81
Schlieren imaging revealed that the blast front for a 60-psi blast traveled at supersonic speed (Mach 1.7), again similar to that observed with explosive blast and shock tubes.77,82,83 High-speed video recordings showed that the mouse head moved only about 0.9 cm during both 30-psi and 60-psi blasts, the movement of the head being greatly limited by the snug fit of the mouse inside the narrow, foam-padded holder. The head velocities reached similar peaks—270 cm/sec for 30-psi blast and 311 cm/sec for 60-psi blast—and the peak instantaneous accelerations over the first msec of blast were high for both—90g for 30-psi blasts and 180g for 60-psi blasts. The g-forces, however, rapidly decreased as the head compressed into the foam, dropping to 0 within 2–4 msec, as head displacement was halted.
During recoil from the foam, head acceleration for both blasts reached a similar negative peak acceleration of −180 to −190 g-force at about 5 msec, and declined again to about zero by 7–8 msec. The extremely short duration of the peak head acceleration places it outside the range thought to be harmful, according to the Wayne State University Concussion Tolerance and Japan Head Tolerance Curves that relate magnitude and duration of linear g–forces to their tissue consequences.8,84–86
Of particular note for blast injury biomechanics, the mean absolute linear head acceleration over the 15 msec after initial blast impact was very similar for 30-psi and 60-psi blasts, as was the total time spent beyond 100g-forces. By contrast, the blast force not lost in compression of the head into the foam, and thus available to cause an intracranial pressure wave, was about 15 times greater for 60-psi than 30-psi blasts. Because the 30-psi blasts produced relatively little pathology and few behavioral deficits, these results suggest that head acceleration contributes minimally to the brain injury and functional deficits observed with 50–60 psi blasts. Instead, the pressure wave propagated through the braincase is likely to be the major basis of the TBI produced in our model.
Computational models of the biomechanical effects of primary blast87,88 predict that such a pressure wave would cause rapid brain tissue deformation by alternating compression and stretching. That we observed numerous behavioral deficits, clear axonal pathology, and noteworthy microglial activation in our model with single 50–60 psi blasts indicates that the pressure wave itself is sufficient to produce TBI, and neither head acceleration22 nor immune system activation by bodily involvement in the blast89 is essential, although both clearly exacerbate the effects of primary blast.29,33 Thus, our model simulates a primary blast injury, but without the complicating secondary and tertiary blast injuries that often occur in a battlefield, such as from shrapnel in a secondary blast wave and from rapid displacement of the victim as a tertiary effect.
Pathology and deficits produced by our current focal blast model of mild TBI
Using a single focal blast to the cranium, we have found that 3-month-old male C57BL/6 mice undergoing blast pressures of 20–40 psi showed little axonal injury and no overt contusive injury or neuron loss, astroglial reaction, or microglial activation. Consistent with this, the mice exhibited minimal deficits on rotarod or in motor parameters in open field, and they were normal in visual acuity. By contrast, the 50–60 psi blast mice showed motor deficits at 1–2 weeks and visual deficits at 3 weeks, as reported here, and increased fear, depression, and anxiety in tests of emotional behavior at 2–8 weeks, as described in Heldt and coworkers.43
Blasts of 50–60 psi yielded degenerating axons in many brain regions, including brainstem, pyramidal tract, corticospinal tract, and optic tract. Mice with 50–60 psi left side cranial blasts also showed degenerating axons in the left optic nerve, thinning of the left retina, and thickening of the right retina, but little degeneration in the right optic nerve. Early axonal pathology in the left optic nerve and right optic tract was evidenced as the swelling and bulb formation typical of axons with disrupted microtubules,90,91 in our case visualized in EYFP-reporter mice and after SMI-32 immunolabeling.
Axonal bulbs were first evident at 3 days, more numerous by 7 days, and progressed to overt degeneration by 3–4 weeks after blast. Axonal bulbs are a classic pathology that axons exhibit when they are injured by rapid stretch in tissue culture models and are routinely seen in animal models of TBI (see below). The biomechanical forces of the insult cause breakage of microtubules, which interrupts axonal transport and leads to swelling of the axon proximal to the microtubule break.90,91 The axonal swelling, independently or in concert with additional changes in the axolemma, cytoskeleton, and mitochondria, can ultimately result in degeneration of the axon.92
Axonal injury is likely to be a major basis for the motor deficits observed in our studies. For example, rotarod deficits and decreases in speed, distance traveled, and stamina in the open field may all relate to the observed damage to the pyramidal tract and corticospinal tract. Deficits in circuits that we did not examine might also have contributed to these motor deficits. For example, vestibular or cerebellar function can contribute to performance on rotarod, and extrapyramidal (e.g., basal ganglia) and/or motivational circuitry (e.g., nucleus accumbens) are likely to influence motor behavior in an open field arena.
We also observed visual deficits after 50–60 psi blasts. The decreased visual acuity and contrast sensitivity for the left eye is likely to have resulted from injury to axons in the left optic nerve and right optic tract. Interestingly, the loss of contrast sensitivity was greater than the acuity deficit for the left eye. Acuity and contrast sensitivity reflect different aspects of visual functioning, and contrast sensitivity deficits at low spatial frequency have been reported without comparable deficits in spatial acuity measured at high contrast—for example, in humans with aging, diabetes, or glaucoma.93–95
Moreover, contrast sensitivity loss without commensurate high contrast spatial acuity loss is often an early sign of optic nerve injury and ganglion cell loss.96–98 This may also explain why we did not detect left eye acuity deficits in 30–40 psi blast mice, although many degenerating axons were present in the left optic nerve, especially in 40-psi mice. The basis of the visual deficits in the right eye is less certain. In mice, about 90% of optic nerve axons cross to the contralateral side of the brain and only 10% are uncrossed.74 Blasts delivered to the left hemisphere may have thus injured visual areas of the left side of the brain critical to right eye visual performance. Alternatively, the observed thickening of the right inner retina, possibly from edema, may have contributed to the visual deficit.
Displacement of the head by the blast may have compressed the right eye into the foam, thereby producing ocular trauma, which can yield retinal edema.99 We, however, did not notice any obvious corneal edema, which typically accompanies blunt ocular trauma.40,99 Another possibility is that the small number of retinal ganglion cells that reportedly project to the contralateral retina100 act to propagate an inflammatory response from the left retina to the right retina.
Although we did not detect overt contusive injury or neuron loss in the brain shortly after TBI, a low level of cortical neuron loss (12.3%) was revealed by stereology 45 days after 50–60 psi blasts. This loss may be a delayed consequence of the injury to cortical output axons, such as that observed in the pyramidal and corticospinal tracts. Similarly, the degeneration of axons in the left optic nerve appeared to be associated with some ganglion cell loss in the left eye.
Moreover, the heightened fear retention exhibited by the mice in our model is likely to be attributable to the reduction in Thy1+ neurons in the basolateral amygdala, as we previously have reported,43 given that that these neurons mediate fear suppression in fear learning paradigms.101 Whether this reflects true loss of the Thy1+ basolateral amygdala neurons or a dysfunction manifesting as diminished Thy1 expression is uncertain. Reflective of possible neuronal dysfunction that could additionally contribute to behavioral deficits, the size of the forebrain was increased by ∼10% at 2–6 weeks after 50–60 psi blast, suggestive of edema, although neither vascular damage nor leukocyte infiltration was evident in the cresyl violet or H&E stained brain sections.
The axonal pathology we observed after 50–60 psi blasts was accompanied by microglial activation in the damaged tracts and in their associated terminal fields over the first week after blast, as has also been seen in other animal models of TBI.102–104 The observed microglial activation is likely to have occurred via their Toll-like 4 receptors in response to small soluble factors (e.g., glutamate, ATP) and/or debris (e.g., cytoskeletal elements, proteolytic breakdown products, and lipid) released by or associated with damaged axons, their terminals, and the associated myelin.105,106 Many authors have suggested that persistent microglial activation initiates an inflammatory cascade that worsens the outcome after TBI.107–109
It is possible, thus, that microglial activation aggravates the degenerative processes initiated by the concussive event in our model and thereby represents a possible therapeutic target. We have, in fact, shown that targeting microglia via their type-2 cannabinoid receptors (CB2) with a CB2 receptor inverse agonist can reduce the motor, visual, and behavioral deficits and the brain, spinal cord, and retinal injury seen after 50-psi blast injury.110
Comparison with open-skull rodent models
Many studies have used lateral fluid percussion, weight drop, or controlled piston impact to the exposed dura in rats or mice, which causes necrotic brain destruction at the site of impact, thereby modeling severe TBI.8,10,11,13–18 In addition to the neuron loss at the impact site, these approaches commonly yield subdural hemorrhage, brain vascular damage, microglial activation, and axonal injury.8,14,18,111–118 Moreover, lateral fluid percussion can have a high mortality rate, and variation in the surgical preparation has yielded variable results between research groups.8 Similar issues arise with penetrating brain injury caused by high-energy projectiles.18
Given the extensive brain damage typically associated with these open-skull models, it is not surprising that rodents subjected to lateral fluid percussion or controlled cortical impact TBI often exhibit a variety of learning, cognitive, and motor deficits.10,11,13–17,111,115–117,119–121 These deficits, as reviewed in Osier and colleagues122 and Thompson and coworkers,123 can exceed those seen in our model, match them, or be more transient, depending on the severity of the impact.10,11,124 For example, one of the least severe of these approaches, mild midline fluid percussion 1.4 atmosphere impact to the dura, produces TBI with little or no contusive injury to the brain, but causes optic nerve damage, similar to that in our TBI model.125–127
Nonetheless, mild midline fluid percussion involves an open skull injury and thus does not mimic mild TBI in humans. In general, the advantage of the fluid percussion model is the robust injury it produces, and the extensive literature on its use, while controlled cortical impact has the advantage that the injury can be related precisely to the incident force. By comparison, the mild TBI created in our model occurs without contusive brain injury, subdural hemorrhage, brain vascular damage, or high mortality (as long as <70-psi is used), while still producing many of the same hallmarks as open-skull TBI approaches, most notably microglial activation, diffuse axonal injury, and behavioral deficits. As with controlled cortical impact, the injury in our model can be related precisely to the incident force.
Comparison with blast models in rodents
To produce blast TBI, most researchers have used shock tubes to deliver compressed air blasts to the entire animal or have shielded the animal's body to restrict the blast to the exposed head of the animal.19,20,22–26,28,30–33,128–133 These approaches avoid the severe focal contusive brain injury associated with open-skull TBI models, while a single exposure, depending on the blast pressure, can yield axonal injury, microglial activation, edema, and cognitive, emotional, and visual deficits,20,23,24,26,28,30,31,33,128–131,133,134 similar to those observed with our focal blast model. For example, significant rotarod motor deficits and axonal swellings have been reported for 2 weeks after a whole body 15-psi blast in mice,19,24 and hippocampal neuron loss has been reported in rats 2 weeks after whole body 18-psi blast.20 The behavioral deficits and brain pathology seen in various blast studies have been summarized in several recent reviews.34,75,76,122
Blast tube models, however, often produce a complex injury, because exposing the entire animal can cause lung damage, leading to hypoxic brain injury, and compression of the heart and aorta, which in turn produces blood pressure surges that damage blood vessels. These additional variables complicate interpretation of the relationship of the primary blast itself to the brain injury.8,18,24,26,129
In this regard, it is of note that shock tube experiments typically use lower pressures than we deliver, because subjecting the entire mouse body to a 25-psi blast yields about 50% mortality.19 Even when the body is shielded, acceleratory head movement22 can introduce additional variables. Moreover, the direct exposure of the eye makes it difficult to distinguish between visual system injury caused by blast effects on the brain and cranial nerves from visual system injury caused by the direct effects of blast on the eye.
By targeting only a small region of the cranium overlying the forebrain, our work shows that the pressure wave traversing the braincase produces mild TBI, with significant accompanying optic nerve and retinal injury. Thus, use of goggles (by members of the military, for example) would not prevent blast pressure waves from damaging the optic nerve and retina and causing visual deficits.
Comparison with closed-skull weight-drop or impactor models in rodents
Closed-skull weight-drop and impactor models simulate the mild TBI that often occurs in humans from a blow to the head.12,20,29,35–39,135–139 These models avoid the severe brain injury of open-skull models and the contributions of injury to other parts of the head or body that occur in a whole head or whole body blast model. The severity of the TBI with both the weight-drop and impactor approaches can be adjusted by changing the height of the weight drop or the impactor force, and the concussive impact can be delivered to different parts of the cranium to explore regional differences in TBI effects. Higher impact forces can, however, yield skull fractures, subdural hemorrhage, brain vascular damage, contusive brain injury, and high mortality,8,12,35,37,39,137,140 and need to be avoided to model mild TBI.
Similar to our focal blast model, a single “hit” with either weight drop or impactor yields widespread axonal injury, minimal focal neuronal damage (as long as the impact force is not too high), brain edema, microglial activation, and motor, cognitive, emotional, and visual deficits.35,37–39,133–136,138,139,141–148 For example, rotarod deficits and axon injury have been reported after weight-drop TBI.141,149 A more detailed review of functional deficits and brain pathology after TBI created by impact or weight drop on a closed skull has been provided by others.8,122,150
While having several advantages over the open skull and whole animal blast models discussed above, in most weight-drop and impactor models, head acceleration also makes a considerable contribution to the injury, as discussed below. Moreover, in contrast to typical weight-drop and impactor models, the skin remains intact in our model, which may make the action of the concussive forces more true to those causing TBI in humans, and also mitigate the possibility of skull fracture.
Role of head acceleration in TBI
In animal models of TBI involving impact to the head by a weight or piston, or exposure to blast in a shock tube, the head, and in some cases, the entire animal,35 is typically not restrained and can be displaced by the concussive force. Thus, rapid head movement is likely to contribute to the brain injury in many blast and impact models.22,26,28,32,35–38,132 In fact, in several models using animals larger than rodents, head acceleration alone is used to produce TBI.8,151–153 Movement of the head, however, is rarely monitored precisely enough in most rodent models to calculate the magnitude and duration of acceleration and thus estimate its relative contribution to injury.
Although blow or blast impact to the head together with head acceleration mimics many real world concussive events, their combined contribution makes it more difficult to relate the biomechanics of injury to a specific brain region to a specific pathology or behavioral impairment in animal models. Moreover, the multidimensional movement of an unrestrained head may add variability to the outcome, which complicates use of that approach for therapy development.36 Although impact models involving a piston blow to the head in an animal secured in a stereotaxic device can avoid the complication of head acceleration,135,136,139 there is risk of auditory system damage as the rim of the auditory meatus is pushed downward into the ear bars during the concussive impact.
In our model, by stabilizing the head during the concussive blast and shielding eyes and ears, the resulting injury is largely from the neural tissue deformation caused by the shockwave transmitted through the braincase, with minimal evident contribution from sudden head acceleration-deceleration. Note that Tzekov and colleagues139 have also reported optic nerve injury in their closed head multihit impactor model of mild TBI with a stabilized head, in their case in a stereotaxic holder, further confirming that a pressure wave passing through the skull can by itself damage the optic nerve.
Conclusions
Our model recapitulates the sensory, motor, and emotional deficits seen after mild TBI in humans134,154–156 and in other animal models,8,122 in conjunction with the initial injury being largely limited to axon tracts.6,8 The device we use is relatively inexpensive to fabricate and thus potentially available to many researchers. Blasts of 50–55 psi magnitude reliably produce deficits with low mortality. Our model may aid in studying the relationships between concussive forces and the specific brain injuries that give rise to specific deficits, without the complicating factors of bodily involvement or head acceleration-deceleration in the injury.
Our model can also be used to study the short-term effects of multiple blasts, as well as long-term degenerative changes after either single or multiple blast, such as occur in chronic traumatic encephalopathy.27 It may also be valuable for testing therapies that abate these deficits by lessening the magnitude of the neural injuries caused by blast, by stabilizing damaged axons, hastening regenerative processes, or diminishing secondary destructive processes such as neuroinflammation. For example, we recently described the benefits of reducing neuroinflammation in our TBI model.110
Finally, the injury produced with our focal blast model can be compared with that resulting from focal mechanical impact to the same head location. The forces associated with blast and with mechanical impact are similar in duration and could readily be adjusted to be similar in magnitude and in the minimal amount of head movement that occurs. In this way, the unresolved issue of whether concussion caused by blast involves different cellular processes and thus different pathological and functional outcomes than concussion caused by mechanical impact could be addressed.
Acknowledgments
The technical assistance of Danielle Howell, Marion Joni, and Rhonda Williams is gratefully acknowledged. The advice of Drs. Patrick Guley, John Varriano (Christian Brothers University, Memphis, TN), and Firouzeh Sabri (University of Memphis) on blast physics is gratefully acknowledged. The design specifications for our blast system will be provided on request to interested investigators. Supported by The University of Tennessee Neuroscience Institute (AR, AJE), The Office of the Dean of the College of Medicine at The University of Tennessee Health Science Center (AR), The Methodist Hospitals Endowed Professorship in Neuroscience (AR), NIH grant NS-081370 (AR), NIH grant EY-005298 (AR), NIH grant EY-022349 (TSR), DoD grant W81XWH-10-1-0528 (TSR), Research to Prevent Blindness Career Development Award (TSR), and Research to Prevent Blindness Unrestricted Funds (Drs. C. Fleming and P. Sternberg).
Author Disclosure Statement
No competing financial interests exist.
References
- 1.Faul M., Xu L., Wald M.M., and Coronado V.G. (2010). Traumatic brain injury in the United States: emergency department visits, hospitalizations, and deaths, 2002–2006. Centers for Disease Control and Prevention, National Center for Injury Prevention and Control: Atlanta, GA [Google Scholar]
- 2.Weinberger S. (2011). Bombs' hidden impact: The brain war. Nature 477, 390–393 [DOI] [PubMed] [Google Scholar]
- 3.Miller G. (2011). The invisible wounds of war. Healing the brain, healing the mind. Science 333, 514–517 [DOI] [PubMed] [Google Scholar]
- 4.Miller G. (2011). Neuropathology: A battle no soldier wants to fight. Science 333, 517–519 [DOI] [PubMed] [Google Scholar]
- 5.Risdall J.E., and Menon D.K. (2011). Traumatic brain injury. Philos. Trans. R. Soc. Lond. B. Biol. Soc. 366, 241–250 [DOI] [PMC free article] [PubMed] [Google Scholar]
- 6.Bazarian J.J., Donnelly K., Peterson D.R., Warner G.C., Zhu T., and Zhong J. (2013). The relation between posttraumatic stress disorder and mild traumatic brain injury acquired during Operations Enduring Freedom and Iraqi Freedom. J. Head Trauma Rehabil. 28, 1–12 [DOI] [PubMed] [Google Scholar]
- 7.Johnson V.E., Stewart W., and Smith D.H. (2013). Axonal pathology in traumatic brain injury. Exp. Neurol. 246, 35–43 [DOI] [PMC free article] [PubMed] [Google Scholar]
- 8.Namjoshi D.R., Good C., Cheng W.H., Panenka W., Richards D., Cripton P.A., and Wellington C.L. (2013). Towards clinical management of traumatic brain injury: a review of models and mechanisms from a biomechanical perspective. Dis. Model Mech. 6, 1325–1338 [DOI] [PMC free article] [PubMed] [Google Scholar]
- 9.Marmarou C.R., Walker S.A., Davis C.L., and Povlishock J.T. (2005). Quantitative analysis of the relationship between intra- axonal neurofilament compaction and impaired axonal transport following diffuse traumatic brain injury. J. Neurotrauma 22, 1066–1080 [DOI] [PubMed] [Google Scholar]
- 10.Brody D.L., MacDonald C., Kessens C.C., Yuede C., Parsadanian M., Spinner M., Kim E., Schwetye K.E., Holtzman D.M., and Bayly P.V. (2007). Electromagnetic controlled cortical impact device for precise, graded experimental traumatic brain injury. J. Neurotrauma 24, 657–673 [DOI] [PMC free article] [PubMed] [Google Scholar]
- 11.Chauhan N.B., Gatto R., and Chauhan M.B. (2010). Neuroanatomical correlation of behavioral deficits in the CCI model of TBI. J. Neurosci. Methods 190, 1–9 [DOI] [PubMed] [Google Scholar]
- 12.Creed J.A., DiLeonardi A.M., Fox D.P., Tessler A.R., and Raghupathi R. (2011). Concussive brain trauma in the mouse results in acute cognitive deficits and sustained impairment of axonal function. J. Neurotrauma 28, 547–563 [DOI] [PMC free article] [PubMed] [Google Scholar]
- 13.Feeney D.M., Boyeson M.G., Linn R.T., Murray H.M., and Dail W.G. (1981). Responses to cortical injury: I. Methodology and local effects of contusions in the rat. Brain Res. 211, 67–77 [DOI] [PubMed] [Google Scholar]
- 14.Hylin M.J., Orsi S.A., Zhao J., Bockhorst K., Perez A., Moore A.N., and Dash P.K. (2013). Behavioral and histopathological alterations resulting from mild fluid percussion injury. J. Neurotrauma 30, 702–715 [DOI] [PMC free article] [PubMed] [Google Scholar]
- 15.Onyszchuk G., Al-Hafez B., He Y.Y., Bilgen M., Berman N.E., and Brooks W.M. (2007). A mouse model of sensorimotor controlled cortical impact: characterization using longitudinal magnetic resonance imaging, behavioral assessments and histology. J. Neurosci. Methods 160, 187–196 [DOI] [PMC free article] [PubMed] [Google Scholar]
- 16.Smith D.H., Soares H.D., Pierce J.S., Perlman K.G., Saatman K.E., Meaney D.F., Dixon C.E., and McIntosh T.K. (1995). A model of parasagittal controlled cortical impact in the mouse: cognitive and histopathologic effects. J. Neurotrauma 12, 169–178 [DOI] [PubMed] [Google Scholar]
- 17.Wu A., Ying Z., and Gomez-Pinilla F. (2007). Omega-3 fatty acids supplementation restores mechanisms that maintain brain homeostasis in traumatic brain injury. J. Neurotrauma 24, 1587–1595 [DOI] [PubMed] [Google Scholar]
- 18.Xiong Y., Mahmood A., and Chopp M. (2013). Animal models of traumatic brain injury. Nat. Rev. Neurosci. 14, 128–142 [DOI] [PMC free article] [PubMed] [Google Scholar]
- 19.Cernak I., Merkle A.C., Koliatsos V.E., Bilik J.M., Luong Q.T., Mahota T.M., Xu L., Slack N., Windle D., and Ahmed F.A. (2011). The pathobiology of blast injuries and blast-induced neurotrauma as identified using a new experimental model of injury in mice. Neurobiol. Dis. 41, 538–55.1 [DOI] [PubMed] [Google Scholar]
- 20.Cho H.J., Sajja V.S., Vandevord P.J., and Lee Y.W. (2013). Blast induces oxidative stress, inflammation, neuronal loss and subsequent short-term memory impairment in rats. Neuroscience 253, 9–20 [DOI] [PubMed] [Google Scholar]
- 21.De Gasperi R., Gama Sosa M.A., Kim S.H., Steele J.W., Shaughness M.C., Maudlin-Jeronimo E., Hall A.A., Dekosky S.T., McCarron R.M., Nambiar M.P., Gandy S., Ahlers S.T., and Elder G.A. (2012). Acute blast injury reduces brain abeta in two rodent species. Front. Neurol. 3, 177. [DOI] [PMC free article] [PubMed] [Google Scholar]
- 22.Goldstein L.E., Fisher A.M., Tagge C.A., Zhang X.L., Velisek L., Sullivan J.A., Upreti C., Kracht J.M., Ericsson M., Wojnarowicz M.W., Goletiani C.J., Maglakelidze G.M., Casey N., Moncaster J.A., Minaeva O., Moir R.D., Nowinski C.J., Stern R.A., Cantu R.C., Geiling J., Blusztajn J.K., Wolozin B.L., Ikezu T., Stein T.D., Budson A.E., Kowall N.W., Chargin D., Sharon A., Saman S., Hall G.F., Moss W.C., Cleveland R.O., Tanzi R.E., Stanton P.K., and McKee A.C. (2012). Chronic traumatic encephalopathy in blast-exposed military veterans and a blast neurotrauma mouse model. Sci. Transl. Med. 4, 134ra60. [DOI] [PMC free article] [PubMed] [Google Scholar]
- 23.Kamnaksh A., Kovesdi E., Kwon S.K., Wingo D., Ahmed F., Grunberg N.E., Long J., and Agoston D.V. (2011). Factors affecting blast traumatic brain injury. J. Neurotrauma 28, 2145–2153 [DOI] [PubMed] [Google Scholar]
- 24.Koliatsos V.E., Cernak I., Xu L., Song Y., Savonenko A., Crain B.J., Eberhart C.G., Frangakis C.E., Melnikova T., Kim H., and Lee D. (2011). A mouse model of blast injury to brain: Initial pathological, neuropathological, and behavioral characterization. J. Neuropathol. Exp. Neurol. 70, 399–416 [DOI] [PubMed] [Google Scholar]
- 25.Kuehn R., Simard P.F., Driscoll I., Keledjian K., Ivanova S., Tosun C., Williams A., Bochicchio G., Gerzanich V., and Simard J.M. (2011). Rodent model of direct cranial blast injury. J. Neurotrauma 28, 2155–2169 [DOI] [PubMed] [Google Scholar]
- 26.Long J.B., Bentley T.L., Wessner K.A., Cerone C., Sweeney S., and Bauman R.A. (2009). Blast overpressure in rats: recreating a battlefield injury in the laboratory. J. Neurotrauma 26, 827–840 [DOI] [PubMed] [Google Scholar]
- 27.McKee A.C., Stern R.A., Nowinski C.J., Stein T.D., Alvarez V.E., Daneshvar D.H., Lee H.S., Wojtowicz S.M., Hall G., Baugh C.M., Riley D.O., Kubilus C.A., Cormier K.A., Jacobs M.A., Martin B.R., Abraham C.R., Ikezu T., Reichard R.R., Wolozin B.L., Budson A.E., Goldstein L.E., Kowall N.W., and Cantu R.C. (2013). The spectrum of disease in chronic traumatic encephalopathy. Brain 136, 43–64 [DOI] [PMC free article] [PubMed] [Google Scholar]
- 28.Mohan K., Kecova H., Hernandez-Merino E., Kardon R.H., and Harper M.M. (2013). Retinal ganglion cell damage in an experimental rodent model of blast-mediated traumatic brain injury. Invest. Ophthalmol. Vis. Sci. 54, 3440–3450 [DOI] [PMC free article] [PubMed] [Google Scholar]
- 29.Park E., Gottlieb J.J., Cheung B., Shek P.N., and Baker A.J. (2011). A model of low-level primary blast brain trauma results in cytoskeletal proteolysis and chronic functional impairment in the absence of lung barotrauma. J. Neurotrauma 28, 343–357 [DOI] [PubMed] [Google Scholar]
- 30.Petras J., Bauman R., and Elsayed N. (1997). Visual system degeneration induced by blast overpressure. Toxicology 121, 41–49 [DOI] [PubMed] [Google Scholar]
- 31.Rubovitch V., Ten-Bosch M., Zohar O., Harrison C.R., Tempel-Brami C., Stein E., Hoffer B.J., Balaban C.D., Schreiber S., Chiu W.T., and Pick C.G. (2011). A mouse model of blast-induced mild traumatic brain injury. Exp. Neurol. 232, 280–289 [DOI] [PMC free article] [PubMed] [Google Scholar]
- 32.Svetlov S.I., Prima V., Kirk D.R., Gutierrez H., Curley K.C., Hayes R.L., and Wang K.K. (2010). Morphologic and biochemical characterization of brain injury in a model of controlled blast overpressure exposure. J. Trauma 69, 795–804 [DOI] [PubMed] [Google Scholar]
- 33.Svetlov S.I., Prima V., Glushakova O., Svetlov A., Kirk D.R., Gutierrez H., Serebruany V.L., Curley K.C., Wang K.K., and Hayes R.L. (2012). Neuro-glial and systemic mechanisms of pathological responses in rat models of primary blast overpressure compared to “composite” blast. Front. Neurol. 3, 15. [DOI] [PMC free article] [PubMed] [Google Scholar]
- 34.Elder G.A., Mitsis E.M., Ahlers S.T., and Cristian A. (2010). Blast-induced mild traumatic brain injury. Psychiatr. Clin. North Am. 33, 757–781 [DOI] [PubMed] [Google Scholar]
- 35.Kane M.J., Angoa-Pérez M., Briggs D.I., Viano D.C., Kreipke C.W., and Kuhn D.M. (2012). A mouse model of human repetitive mild traumatic brain injury. J. Neurosci. Methods 203, 41–49 [DOI] [PMC free article] [PubMed] [Google Scholar]
- 36.Li Y., Zhang L., Kallakuri S., Zhou R., and Cavanaugh J.M. (2011). Quantitative relationship between axonal injury and mechanical response in a rodent head impact acceleration model. J. Neurotrauma 28, 1767–1782 [DOI] [PMC free article] [PubMed] [Google Scholar]
- 37.Marmarou A., Foda M.A., van den Brink W., Campbell J., Kita H., and Demetriadou K. (1994). A new model of diffuse brain injury in rats: Part I: Pathophysiology and biomechanics. J. Neurosurg. 80, 291–300 [DOI] [PubMed] [Google Scholar]
- 38.Viano D.C., Hamberger A., Bolouri H., and Säljö A. (2009). Concussion in professional football: animal model of brain injury—part 15. Neurosurgery 64, 1162–1173 [DOI] [PubMed] [Google Scholar]
- 39.Yang S.H., Gustafson J., Gangidine M., Stepien D., Schuster R., Pritts T.A., Goodman M.D., Remick D.G., and Lentsch A.B. (2013). A murine model of mild traumatic brain injury exhibiting cognitive and motor deficits. J. Surg. Res. 184, 981–988 [DOI] [PMC free article] [PubMed] [Google Scholar]
- 40.Hines-Beard J., Marchetta J., Gordon S., Chaum E., Geisert E.E., and Rex T.S. (2012). A mouse model of ocular blast injury that induces closed globe anterior and posterior pole damage. Exp. Eye Res. 99, 63–70 [DOI] [PMC free article] [PubMed] [Google Scholar]
- 41.Bareyre F.M., Kerschensteiner M., Misgeld T., and Sanes J.R. (2005). Transgenic labeling of the corticospinal tract for monitoring axonal responses to spinal cord injury. Nat. Med. 11, 1355–1360 [DOI] [PubMed] [Google Scholar]
- 42.Gorski J.A., Talley T., Qiu M., Puelles L., Rubenstein J.L.R., and Jones K.R. (2002). Cortical excitatory neurons and glia, but not GABAergic neurons, are produced in the emx1-expressing lineage. J. Neurosci. 22, 6309–6314 [DOI] [PMC free article] [PubMed] [Google Scholar]
- 43.Heldt S.A., Elberger A.J., Deng Y., Guley N.H., Del Mar N., Rogers J., Choi G.W., Ferrell J., Rex T.S., Honig M.G., and Reiner A. (2014). A novel closed-head model of mild traumatic brain injury caused by primary overpressure blast to the cranium produces sustained emotional deficits in mice. Front. Neurol. 5, 2. [DOI] [PMC free article] [PubMed] [Google Scholar]
- 44.de la Cuadra P., Vergez C., and Fabre B. (2007). Visualization and analysis of jet oscillation under transverse acoustic perturbation. J. Flow Visualization Image Process. 14, 355–374 [Google Scholar]
- 45.Drai D., and Golani I. (2001). SEE: a tool for the visualization and analysis of rodent exploratory behavior. Neurosci. Biobehav. Rev. 25, 409–426 [DOI] [PubMed] [Google Scholar]
- 46.Drai D., Benjamini Y., and Golani I. (2000). Statistical discrimination of natural modes of motion in rat exploratory behavior. J. Neurosci. Methods 96, 119–131 [DOI] [PubMed] [Google Scholar]
- 47.Kafkafi N., Mayo C., Drai D., Golani I., and Elmer G. (2001). Natural segmentation of the locomotor behavior of drug-induced rats in a photobeam cage. J. Neurosci. Methods 109, 111–121 [DOI] [PubMed] [Google Scholar]
- 48.Kafkafi N., Lipkind D., Benjamini Y., Mayo C.L., Elmer G.I., and Golani I. (2003). SEE locomotor behavior test discriminates C57BL/6J and DBA/2J mouse inbred strains across laboratories and protocol conditions. Behav. Neurosci. 117, 464–477 [DOI] [PubMed] [Google Scholar]
- 49.Lipkind D., Sakov A., Kafkafi N., Elmer G.I., Benjamini Y., and Golani I. (2004). New replicable anxiety-related measures of wall vs center behavior of mice in the open field. J. Appl. Physiol. 97, 347–359 [DOI] [PubMed] [Google Scholar]
- 50.Reiner A., Lafferty D.C., Wang H.B., Del Mar N., and Deng Y.P. (2012). The group-2 metabotropic glutamate receptor agonist LY379268 rescues neuronal, neurochemical and motor abnormalities in R6/2 Huntington's disease mice. Neurobiol. Dis. 47, 75–91 [DOI] [PMC free article] [PubMed] [Google Scholar]
- 51.Prusky G.T., Alam N.M., Beekman S., and Douglas R.M. (2004). Rapid quantification of adult and developing mouse spatial vision using a virtual optomotor system. Invest. Ophthalmol. Vis. Sci. 45, 4611–4616 [DOI] [PubMed] [Google Scholar]
- 52.Bricker-Anthony C., Hines-Beard J., D'Surney L., and Rex T.S. (2014). Exacerbation of blast-induced ocular trauma by an immune response. J. Neuroinflammation 11, 192. [DOI] [PMC free article] [PubMed] [Google Scholar]
- 53.Bricker-Anthony C., Hines-Beard J., and Rex T.S. (2014). Molecular changes and vision loss in a mouse model of closed-globe blast trauma. Invest. Ophthalmol. Vis. Sci. 55, 4853–4862 [DOI] [PMC free article] [PubMed] [Google Scholar]
- 54.Cuthbertson S., LeDoux M.S., Jones S., Jones J., Zhou Q., Gong S., Ryan P., and Reiner A. (2003). Localization of preganglionic neurons that innervate choroidal neurons of pterygopalatine ganglion. Invest. Ophthalmol. Vis. Sci. 44, 3713–3724 [DOI] [PubMed] [Google Scholar]
- 55.Meade C.A., Figueredo-Cardenas G., Fusco F.R., Nowak T.S., Jr., Pulsinelli W., and Reiner A. (2000). Transient global ischemia in rats yields striatal projection neuron and interneuron loss resembling that in Huntington's disease. Exp. Neurol. 166, 307–323 [DOI] [PubMed] [Google Scholar]
- 56.Mullen R.J., Buck C.R., and Smith A.M. (1992). NeuN, a neuronal specific nuclear protein in vertebrates. Development 116, 201–211 [DOI] [PubMed] [Google Scholar]
- 57.Spillantini M.G., Crowther R.A., Jakes R., Hasegawa M., and Goedert M. (1998). Alpha-Synuclein in filamentous inclusions of Lewy bodies from Parkinson's disease and dementia with lewy bodies. Proc. Natl. Acad. Sci. U.S.A. 95, 6469–6473 [DOI] [PMC free article] [PubMed] [Google Scholar]
- 58.Kim K.K., Adelstein R.S., and Kawamoto S. (2009). Identification of neuronal nuclei (NeuN) as Fox-3, a new member of the Fox-1 gene family of splicing factors. J. Biol. Chem. 284, 31052–31061 [DOI] [PMC free article] [PubMed] [Google Scholar]
- 59.Cao T., Thomas T.C., Ziebell J.M., Pauly J.R., and Lifshitz J. (2012). Morphological and genetic activation of microglia after diffuse traumatic brain injury in the rat. Neuroscience 225, 65–75 [DOI] [PMC free article] [PubMed] [Google Scholar]
- 60.Redell J.B., and Dash P.K. (2007). Traumatic brain injury stimulates hippocampal catechol-O-methyl transferase expression in microglia. Neurosci. Lett. 413, 36–41 [DOI] [PMC free article] [PubMed] [Google Scholar]
- 61.Shitaka Y., Tran H.T., Bennett R.E., Sanchez L., Levy M.A., Dikranian K., and Brody D.L. (2011). Repetitive closed-skull traumatic brain injury in mice causes persistent multifocal axonal injury and microglial reactivity. J. Neuropathol. Exp. Neurol. 70, 551–567 [DOI] [PMC free article] [PubMed] [Google Scholar]
- 62.Ashton J.C., and Glass M. (2007). The cannabinoid CB2 receptor as a target for inflammation-dependent neurodegeneration. Curr. Neuropharmacol. 5, 73–80 [DOI] [PMC free article] [PubMed] [Google Scholar]
- 63.Ebneter A., Casson R.J., Wood J.P., and Chidlow G. (2010). Microglial activation in the visual pathway in experimental glaucoma: spatiotemporal characterization and correlation with axonal injury. Invest. Ophthalmol. Vis. Sci. 51, 6448–6460 [DOI] [PubMed] [Google Scholar]
- 64.Kreutzberg G.W. (1996). Microglia: a sensor for pathological events in the CNS. Trends Neurosci. 19, 312–318 [DOI] [PubMed] [Google Scholar]
- 65.Acosta S.A., Tajiri N., Shinozuka K., Ishikawa H., Grimmig B., Diamond D.M., Sanberg P.R., Bickford P.C., Kaneko Y., and Borlongan C.V. (2013). Long-term upregulation of inflammation and suppression of cell proliferation in the brain of adult rats exposed to traumatic brain injury using the controlled cortical impact model. PLoS One 8, e53376. [DOI] [PMC free article] [PubMed] [Google Scholar]
- 66.Sternberger L.A., and Sternberger N.H. (1983). Monoclonal antibodies distinguish phosphorylated and non-phosphorylated forms of neurofilaments in situ. Proc. Natl. Acad. Sci. U.S.A. 80, 6126–6130 [DOI] [PMC free article] [PubMed] [Google Scholar]
- 67.King C.E., Jacobs I., Dickson T.C., and Vickers J.C. (1997). Physical damage to rat cortical axons mimics early Alzheimer's neuronal pathology. Neuroreport 8, 1663–1665 [PubMed] [Google Scholar]
- 68.Bradbury E.J., Moon L.D., Popat R.J., King V.R., Bennett G.S., Patel P.N., Fawcett J.W., and McMahon S.B. (2002). Chondroitinase ABC promotes functional recovery after spinal cord injury. Nature 416, 636–640 [DOI] [PubMed] [Google Scholar]
- 69.Lieu A., Tenorio G., and Kerr B.J. (2013). Protein kinase C gamma (PKCγ) as a novel marker to assess the functional status of the corticospinal tract in experimental autoimmune encephalomyelitis (EAE). J. Neuroimmunol. 256, 43–48 [DOI] [PubMed] [Google Scholar]
- 70.Saito N., and Shirai Y. (2002). Protein kinase C gamma (PKC gamma): function of neuron specific isotype. J. Biochem. 132, 683–687 [DOI] [PubMed] [Google Scholar]
- 71.Deng Y.P., Wong T., Bricker-Anthony C., Deng B., and Reiner A. (2013). Loss of corticostriatal and thalamostriatal synaptic terminals precedes striatal projection neuron pathology in heterozygous Q140 Huntington's disease mice. Neurobiol. Dis. 60, 89–107 [DOI] [PMC free article] [PubMed] [Google Scholar]
- 72.Franklin K.B., and Paxinos G. (2012). The Mouse Brain in Stereotaxic Coordinates. 4th ed. Academic Press: San Diego, CA [Google Scholar]
- 73.Reiner A., Del Mar N., Deng Y.P., Meade C.A., Sun Z., and Goldowitz D. (2007). R6/2 neurons with intranuclear inclusions survive for prolonged periods in the brains of chimeric mice. J. Comp. Neurol. 505, 603–629 [DOI] [PubMed] [Google Scholar]
- 74.Dräger U.C., and Olsen J.F. (1980). Origins of crossed and uncrossed retinal projections in pigmented and albino mice. J. Comp. Neurol. 191, 383–412 [DOI] [PubMed] [Google Scholar]
- 75.Elder G.A., Stone J.R., and Ahlers S.T. (2014). Effects of low-level blast exposure on the nervous system: Is there really a controversy? Front. Neurol. 5, 269. [DOI] [PMC free article] [PubMed] [Google Scholar]
- 76.Kobeissy F., Mondello S., Tümer N., Toklu H.Z., Whidden M.A., Kirichenko N., Zhang Z., Prima V., Yassin W., Anagli J., Chandra N., Svetlov S., and Wang K.K. (2013). Assessing neuro-systemic & behavioral components in the pathophysiology of blast-related brain injury. Front. Neurol. 4, 186. [DOI] [PMC free article] [PubMed] [Google Scholar]
- 77.Reneer DV, Hisel RD, Hoffman JM, Kryscio RJ, Lusk BT, and Geddes JW. (2011). A multi-mode shock tube for investigation of blast-induced traumatic brain injury. J. Neurotrauma 28, 95–104 [DOI] [PMC free article] [PubMed] [Google Scholar]
- 78.Taylor PA, Ludwigsen JS, and Ford CC. (2014). Investigation of blast-induced traumatic brain injury. Brain Inj. 28, 879–895 [DOI] [PMC free article] [PubMed] [Google Scholar]
- 79.Bass C.R., Panzer M.B., Rafaels K.A., Wood G., Shridharani J., and Capehart B. (2012). Brain injuries from blast. Ann. Biomed. Eng. 40, 185–202 [DOI] [PubMed] [Google Scholar]
- 80.Alley M.D., Schimizze B.R., and Son S.F. (2011). Experimental modeling of explosive blast-related traumatic brain injuries. Neuroimage 54, Suppl 1, S45–S54 [DOI] [PubMed] [Google Scholar]
- 81.Chavko M., Koller W.A., Prusaczyk W.K., and McCarron R.M. (2007). Measurement of blast wave by a miniature fiber optic pressure transducer in the rat brain. J. Neurosci. Methods 159, 277–281 [DOI] [PubMed] [Google Scholar]
- 82.Risling M, and Davidsson J. (2012). Experimental animal models for studies on the mechanisms of blast-induced neurotrauma. Front. Neurol. 3, 30. [DOI] [PMC free article] [PubMed] [Google Scholar]
- 83.Hua Y., Akula P., Gu L., Berg J., and Nelson C.A. (2014). Experimental and numerical investigation of the mechanism of blast wave transmission through a surrogate head. J. Comput. Nonlin. Dyn. 10.1115/1.4026156 [Google Scholar]
- 84.Gurdjian E.S., Roberts V.L., and Thomas L.M. (1966). Tolerance curves of acceleration and intracranial pressure and protective index in experimental head injury. J. Trauma 6, 600–604 [DOI] [PubMed] [Google Scholar]
- 85.Ono I., Kikuchi A., Nakamura M., Kobayashi H., and Nakamura N. (1980). Human head tolerance to sagittal impact reliable estimation deduced from experimental head injury using subhuman primates and cadaver skulls. 24th Stapp Car Crash Conference, SAE International, Troy, MI [Google Scholar]
- 86.Shewchenko N., Withnall C., Keown M., Gittens R., and Dvorak J. (2005). Heading in football. Part 1: development of biomechanical methods to investigate head response. Br. J. Sports Med. 39, Suppl 1, i10–25 [DOI] [PMC free article] [PubMed] [Google Scholar]
- 87.Taylor P.A., and Ford C.C. (2009). Simulation of blast-induced early-time intracranial wave physics leading to traumatic brain injury. J. Biomed. Eng. 131, 061007. [DOI] [PubMed] [Google Scholar]
- 88.Laksari K., Sadeghipour K., and Darvish K. (2014). Mechanical response of brain tissue under blast loading. J. Mech. Behav. Biomed. Mater. 32, 132–144 [DOI] [PubMed] [Google Scholar]
- 89.Cernak I. (2010). The importance of systemic response in the pathobiology of blast-induced neurotrauma. Front. Neur. 1, 151. [DOI] [PMC free article] [PubMed] [Google Scholar]
- 90.Tang-Schomer M.D., Johnson V.E., Baas P.W., Stewart W., and Smith D.H. (2012). Partial interruption of axonal transport due to microtubule breakage accounts for the formation of periodic varicosities after traumatic axonal injury. Exp. Neurol. 233, 364–372 [DOI] [PMC free article] [PubMed] [Google Scholar]
- 91.Tang-Schomer M.D., Patel A.R., Baas P.W., and Smith D.H. (2010). Mechanical breaking of microtubules in axons during dynamic stretch injury underlies delayed elasticity, microtubule disassembly, and axon degeneration. FASEB J. 24, 1401–1410 [DOI] [PMC free article] [PubMed] [Google Scholar]
- 92.Farkas O., and Povlishock J.T. (2007). Cellular and subcellular change evoked by diffuse traumatic brain injury: a complex web of change extending far beyond focal damage. Prog. Brain Res. 161, 43–59 [DOI] [PubMed] [Google Scholar]
- 93.Abe H., Hasegawa S., Takagi M., Yoshizawa T., and Usui T. (1993). Contrast sensitivity for the stationary and drifting vertical stripe patterns in patients with optic nerve disorders. Ophthalmalogica 207, 100–105 [DOI] [PubMed] [Google Scholar]
- 94.Hashemi H., Khabazkhoob M., Jafarzadehpur E., Emamian M.H., Shariati M., and Fotouhi A. (2012). Contrast sensitivity evaluation in a population-based study in Shahroud, Iran. Ophthalmology 119, 541–546 [DOI] [PubMed] [Google Scholar]
- 95.Di Leo M.A., Caputo S., Falsini B., Porciatti V., Minnella A., Greco A.V., and Ghirlanda G. (1992). Nonselective loss of contrast sensitivity in visual system testing in early type I diabetes. Diabetes Care 15, 620–625 [DOI] [PubMed] [Google Scholar]
- 96.Akimov N.P., and Renteria R.C. (2012). Spatial frequency threshold and contrast sensitivity of an optomotor behavior are impaired in the Ins2Akita mouse model of diabetes. Behav. Brain Res. 226, 601–605 [DOI] [PMC free article] [PubMed] [Google Scholar]
- 97.Al-Hashmi A.M., Kramer D.J., and Mullen K.T. (2011). Human vision with a lesion of the parvocellular pathway: an optic neuritis model for selective contrast sensitivity deficits with severe loss of midget ganglion cell function. Exp. Brain Res. 215, 293–305 [DOI] [PubMed] [Google Scholar]
- 98.Marmor M.F. (1986). Contrast sensitivity versus visual acuity in retinal disease. Br. J. Ophthalmol. 70, 553–559 [DOI] [PMC free article] [PubMed] [Google Scholar]
- 99.Jovanović M., Bobić-Radovanović A., Vuković D., Knezević M., and Risović D. (2012). Ocular injuries caused by airsoft guns—ten-year experience. Acta Chir. Iugosl. 59, 73–76 [DOI] [PubMed] [Google Scholar]
- 100.Müller M., and Holländer H. (1988). A small population of retinal ganglion cells projecting to the retina of the other eye. An experimental study in the rat and the rabbit. Exp. Brain Res. 71, 611–617 [DOI] [PubMed] [Google Scholar]
- 101.Jasnow A.M., Ehrlich D.E., Choi D.C., Dabrowska J., Bowers M.E., McCullough K.M., Rainnie D.G., and Ressler K.J. (2013). Thy1-expressing neurons in the basolateral amygdala may mediate fear inhibition. J. Neurosci. 33, 10396–10404 [DOI] [PMC free article] [PubMed] [Google Scholar]
- 102.Ma M., Basso D.M., Walters P., Stokes B.T., and Jakeman L.B. (2001). Behavioral and histological outcomes following graded spinal cord contusion injury in the C57Bl/6 mouse. Exp. Neurol. 169, 239–254 [DOI] [PubMed] [Google Scholar]
- 103.Jacobowitz D.M., Cole J.T., McDaniel D.P., Pollard H.B., and Watson W.D. (2012). Microglia activation along the corticospinal tract following traumatic brain injury in the rat: a neuroanatomical study. Brain Res. 1465, 80–89 [DOI] [PubMed] [Google Scholar]
- 104.Kovacs S.K., Leonessa F., and Ling G.S. (2014). Blast TBI models, neuropathology, and implications for seizure risk. Front. Neurol. 5, 47. [DOI] [PMC free article] [PubMed] [Google Scholar]
- 105.Blumbergs P., Reilly P., and Vink R. (2008). Trauma, in: Love S., Louis D.N., and Ellison DW D.W. (eds). Greenfield's Neuropathology. 8th ed. Edward Arnold Publishers Ltd: London, pps. 733–832 [Google Scholar]
- 106.Smith J., Das A., Ray S., and Banik N. (2012). Role of pro-inflammatory cytokines released from microglia in neurodegenerative diseases. Brain Res. Bull. 87, 10–20 [DOI] [PMC free article] [PubMed] [Google Scholar]
- 107.Kelley B.J., Lifshitz J., and Povlishock J.T. (2007). Neuroinflammatory responses after experimental diffuse traumatic brain injury. J. Neuropathol. Exp. Neurol. 66, 989–1001 [DOI] [PubMed] [Google Scholar]
- 108.Kumar A., and Loane D.J. (2012). Neuroinflammation after traumatic brain injury: opportunities for therapeutic intervention. Brain Behav. Immun. 26, 1191–1201 [DOI] [PubMed] [Google Scholar]
- 109.Smith C. (2013). Review: the long-term consequences of microglial activation following acute traumatic brain injury. Neuropathol. Appl. Neurobiol. 39, 35–44 [DOI] [PubMed] [Google Scholar]
- 110.Reiner A., Heldt S.A., Presley C.S., Guley N.H., Elberger A.J., Deng Y., D'Surney L., Rogers J.T., Ferrell J., Bu W., Del Mar N., Honig M.G., Gurley S.N., and Moore B.M. (2014). Motor, visual and emotional deficits in mice after closed-head mild traumatic brain injury are alleviated by the novel CB2 inverse agonist SMM-189. Int. J. Mol. Sci. 16, 758–787 [DOI] [PMC free article] [PubMed] [Google Scholar]
- 111.Alder J., Fujioka W., Lifshitz J., Crockett D.P., and Thakker-Varia S. (2011). Lateral fluid percussion: model of traumatic brain injury in mice. J. Vis. Exp. 54, pii, [DOI] [PMC free article] [PubMed] [Google Scholar]
- 112.Amenta P.S., Jallo J.I., Tuma R.F., and Elliott M.B. (2012). A cannabinoid type 2 receptor agonist attenuates blood-brain barrier damage and neurodegeneration in a murine model of traumatic brain injury. J. Neurosci. Res. 90, 2293–2305 [DOI] [PubMed] [Google Scholar]
- 113.Elliott M.B., Tuma R.F., Amenta P.S., Barbe M.F., and Jallo J.I. (2011). Acute effects of a selective cannabinoid-2 receptor agonist on neuroinflammation in a model of traumatic brain injury. J. Neurotrauma 28, 973–981 [DOI] [PubMed] [Google Scholar]
- 114.Jacobowitz D.M., Cole J.T., McDaniel D.P., Pollard H.B., and Watson W.D. (2012). Microglia activation along the corticospinal tract following traumatic brain injury in the rat: a neuroanatomical study. Brain Res. 1465, 80–89 [DOI] [PubMed] [Google Scholar]
- 115.Kimbler D.E., Shields J., Yanasak N., Vender J.R., and Dhandapani K.M. (2012). Activation of P2X7 promotes cerebral edema and neurological injury after traumatic brain injury in mice. PLoS One 7, e41229. [DOI] [PMC free article] [PubMed] [Google Scholar]
- 116.Romine J., Gao X., and Chen J. (2014). Controlled cortical impact model for traumatic brain injury. J. Vis. Exp. 90, e51781. [DOI] [PMC free article] [PubMed] [Google Scholar]
- 117.Swan A.A., Chandrashekar R., Beare J., and Hoane M.R. (2011). Preclinical efficacy testing in middle-aged rats: nicotinamide, a novel neuroprotectant, demonstrates diminished preclinical efficacy after controlled cortical impact. J. Neurotrauma 28, 431–440 [DOI] [PMC free article] [PubMed] [Google Scholar]
- 118.Turtzo L.C., Lescher J., Janes L., Dean D.D., Budde M.D., and Frank J.A. (2014). Macrophagic and microglial responses after focal traumatic brain injury in the female rat. . Neuroinflammation 11, 82. [DOI] [PMC free article] [PubMed] [Google Scholar]
- 119.Shultz S.R., MacFabe D.F., Foley K.A., Taylor R., and Cain D.P. (2011). A single mild fluid percussion injury induces short-term behavioral and neuropathological changes in the Long-Evans rat: support for an animal model of concussion. Behav. Brain Res. 224, 326–335 [DOI] [PubMed] [Google Scholar]
- 120.Shultz S.R., Bao F., Omana V., Chiu C., Brown A., and Cain D.P. (2012). Repeated mild lateral fluid percussion brain injury in the rat causes cumulative long-term behavioral impairments, neuroinflammation, and cortical loss in an animal model of repeated concussion. J. Neurotrauma 29, 281–294 [DOI] [PubMed] [Google Scholar]
- 121.Washington P.M., Forcelli P.A., Wilkins T., Zapple D.N., Parsadanian M., and Burns M.P. (2012). The effect of injury severity on behavior: a phenotypic study of cognitive and emotional deficits after mild, moderate, and severe controlled cortical impact injury in mice. J. Neurotrauma 29, 2283–2296 [DOI] [PMC free article] [PubMed] [Google Scholar]
- 122.Osier N.D., Carlson S.W., DeSana A., and Dixon C.E. (2015). Chronic histopathological and behavioral outcomes of experimental traumatic brain injury in adult male animals. J. Neurotrauma. Epub ahead of print [DOI] [PMC free article] [PubMed] [Google Scholar]
- 123.Thompson HJ, Lifshitz J, Marklund N, Grady MS, Graham DI, Hovda DA, and McIntosh TK. (2005). Lateral fluid percussion brain injury: a 15-year review and evaluation. J. Neurotrauma 22, 42–75 [DOI] [PubMed] [Google Scholar]
- 124.Yu F, Wang Z, Tchantchou F, Chiu CT, Zhang Y, and Chuang DM. (2012). Lithium ameliorates neurodegeneration, suppresses neuroinflammation, and improves behavioral performance in a mouse model of traumatic brain injury. J. Neurotrauma 29, 362–374 [DOI] [PMC free article] [PubMed] [Google Scholar]
- 125.Iwamoto Y., Yamaki T., Murakami N., Umeda M., Tanaka C., Higuchi T., Aoki I., Naruse S., and Ueda S. (1997). Investigation of morphological change of lateral and midline fluid percussion injury in rats, using magnetic resonance imaging. Neurosurgery 40, 163–167 [DOI] [PubMed] [Google Scholar]
- 126.Wang J., Fox M.A., and Povlishock J.T. (2013). Diffuse traumatic axonal injury in the optic nerve does not elicit retinal ganglion cell loss. J. Neuropathol. Exp. Neurol. 72, 768–781 [DOI] [PMC free article] [PubMed] [Google Scholar]
- 127.Wang J., Hamm R.J., and Povlishock J.T. (2011). Traumatic axonal injury in the optic nerve: evidence for axonal swelling, disconnection, dieback, and reorganization. J. Neurotrauma 28, 1185–1198 [DOI] [PMC free article] [PubMed] [Google Scholar]
- 128.Baalman K.L., Cotton R.J., Rasband S.N., and Rasband M.N. Blast wave exposure impairs memory and decreases axon initial segment length. (2013). J. Neurotrauma 30, 741–751 [DOI] [PMC free article] [PubMed] [Google Scholar]
- 129.Elder G.A., Dorr N.P., De Gasperi R., Gama Sosa M.A., Shaughness M.C., Maudlin-Jeronimo E., Hall A.A., McCarron R.M., and Ahlers S.T. (2012). Blast exposure induces post-traumatic stress disorder-related traits in a rat model of mild traumatic brain injury. J. Neurotrauma 29, 2564–2575 [DOI] [PMC free article] [PubMed] [Google Scholar]
- 130.Kamnaksh A., Kwon S.K., Kovesdi E., Ahmed F., Barry E.S., Grunberg N.E., Long J., and Agoston D. (2012). Neurobehavioral, cellular, and molecular consequences of single and multiple mild blast exposure. Electrophoresis 33, 3680–3692 [DOI] [PubMed] [Google Scholar]
- 131.Kwon S.K., Kovesdi E., Gyorgy A.B., Wingo D., Kamnaksh A., Walker J., Long J.B., and Agoston D.V. (2011). Stress and traumatic brain injury: a behavioral, proteomics, and histological study. Front. Neurol. 2, 12. [DOI] [PMC free article] [PubMed] [Google Scholar]
- 132.Svetlov S.I., Larner S.F., Kirk D.R., Atkinson J., Hayes R.L., and Wang K.K. (2009). Biomarkers of blast-induced neurotrauma: profiling molecular and cellular mechanisms of blast brain injury. J. Neurotrauma 26, 913–921 [DOI] [PMC free article] [PubMed] [Google Scholar]
- 133.Tweedie D., Rachmany L., Rubovitch V., Zhang Y., Becker K.G., Perez E., Hoffer B.J., Pick C.G., and Greig N.H. (2013). Changes in mouse cognition and hippocampal gene expression observed in a mild physical- and blast-traumatic brain injury. Neurobiol. Dis. 54, 1–11 [DOI] [PMC free article] [PubMed] [Google Scholar]
- 134.Malkesman O., Tucker L.B., Ozl J., and McCabe J.T. (2013). Traumatic brain injury—modeling neuropsychiatric symptoms in rodents. Front. Neurol. 4, 157. [DOI] [PMC free article] [PubMed] [Google Scholar]
- 135.Mouzon B., Chaytow H., Crynen G., Bachmeier C., Stewart J., Mullan M., Stewart W., and Crawford F. (2012). Repetitive mild traumatic brain injury in a mouse model produces learning and memory deficits accompanied by histological changes. J. Neurotrauma 29, 2761–2773 [DOI] [PubMed] [Google Scholar]
- 136.Mouzon B.C., Bachmeier C., Ferro A., Ojo J.O., Crynen G., Acker C.M., Davies P., Mullan M., Stewart W., and Crawford F. (2014). Chronic neuropathological and neurobehavioral changes in a repetitive mild traumatic brain injury model. Ann. Neurol. 75, 241–254 [DOI] [PubMed] [Google Scholar]
- 137.Shenaq M., Kassem H., Peng C., Schafer S., Ding J.Y., Fredrickson V., Guthikonda M., Kreipke C.W., Rafols J.A., and Ding Y. (2012). Neuronal damage and functional deficits are ameliorated by inhibition of aquaporin and HIF1α after traumatic brain injury (TBI). J. Neurol. Sci. 323, 134–140 [DOI] [PubMed] [Google Scholar]
- 138.Heffernan M.E., Huang W., Sicard K.M., Bratane B.T., Sikoglu E.M., Zhang N., Fisher M., and King J.A. (2013). Multi-modal approach for investigating brain and behavior changes in an animal model of traumatic brain injury. J. Neurotrauma 30, 1007–1012 [DOI] [PMC free article] [PubMed] [Google Scholar]
- 139.Tzekov R., Quezada A., Gautier M., Biggins D., Frances C., Mouzon B., Jamison J., Mullan M., and Crawford F. (2014). Repetitive mild traumatic brain injury causes optic nerve and retinal damage in a mouse model. J. Neuropathol. Exp. Neurol. 73, 345–361 [DOI] [PubMed] [Google Scholar]
- 140.Cernak I., Vink R., Zapple D.N., Cruz M.I., Ahmed F., Chang T., Fricke S.T., and Faden A.I. (2004). The pathobiology of moderate diffuse traumatic brain injury as identified using a new experimental model of injury in rats. Neurobiol. Dis. 17, 29–43 [DOI] [PubMed] [Google Scholar]
- 141.Bose P., Hou J., Nelson R., Nissim N., Parmer R., Keener J., Wacnik P.W., and Thompson F.J. (2013). Effects of acute intrathecal baclofen in an animal model of TBI-induced spasticity, cognitive, and balance disabilities. J. Neurotrauma 30, 1177–1191 [DOI] [PubMed] [Google Scholar]
- 142.Fromm L., Heath D.L., Vink R., and Nimmo A.J. (2004). Magnesium attenuates post-traumatic depression/anxiety following diffuse traumatic brain injury in rats. J. Am. Coll. Nutr. 23, 529S–533S [DOI] [PubMed] [Google Scholar]
- 143.Meyer D.L., Davies D.R., Barr J.L., Manzerra P., and Forster G.L. (2012). Mild traumatic brain injury in the rat alters neuronal number in the limbic system and increases conditioned fear and anxiety-like behaviors. Exp. Neurol. 235, 574–587 [DOI] [PubMed] [Google Scholar]
- 144.Milman A., Rosenberg A., Weizman R., and Pick C.G. (2005). Mild traumatic brain injury induces persistent cognitive deficits and behavioral disturbances in mice. J. Neurotrauma 22, 1003–1010 [DOI] [PubMed] [Google Scholar]
- 145.Pandey D.K., Yadav S.K., Mahesh R., and Rajkumar R. (2009). Depression-like and anxiety-like behavioural aftermaths of impact accelerated traumatic brain injury in rats: a model of comorbid depression and anxiety? Behav. Brain Res. 205, 436–442 [DOI] [PubMed] [Google Scholar]
- 146.Schwarzbold M.L., Rial D., De Bem T., Machado D.G., Cunha M.P., dos Santos A.A., dos Santos D.B., Figueiredo C.P., Farina M., Goldfeder E.M., Rodrigues A.L., Prediger R.D., and Walz R. (2010). Effects of traumatic brain injury of different severities on emotional, cognitive, and oxidative stress-related parameters in mice. J. Neurotrauma 27, 1883–1893 [DOI] [PubMed] [Google Scholar]
- 147.Tweedie D., Milman A., Holloway H.W., Li Y., Harvey B.K., Shen H., Pistell P.J., Lahiri D.K., Hoffer B.J., Wang Y., Pick C.G., and Greig N.H. (2007). Apoptotic and behavioral sequelae of mild brain trauma in mice. J. Neurosci. Res. 85, 805–815 [DOI] [PubMed] [Google Scholar]
- 148.Zakaria N., Kallakuri S., Bandaru S., and Cavanaugh J.M. (2012). Temporal assessment of traumatic axonal injury in the rat corpus callosum and optic chiasm. Brain Res. 1467, 81–90 [DOI] [PubMed] [Google Scholar]
- 149.O'Connor C., Heath D.L., Cernak I., Nimmo A.J., and Vink R. (2003). Effects of daily versus weekly testing and pre-training on the assessment of neurologic impairment following diffuse traumatic brain injury in rats. J. Neurotrauma 20, 985–993 [DOI] [PubMed] [Google Scholar]
- 150.Angoa-Pérez M., Kane M.J., Briggs D.I., Herrera-Mundo N., Viano D.C., and Kuhn D.M. (2014). Animal models of sports-related head injury: bridging the gap between pre-clinical research and clinical reality. J. Neurochem. 129, 916–931 [DOI] [PMC free article] [PubMed] [Google Scholar]
- 151.Lamy M., Baumgartner D., Willinger R., Yoganandan N., and Stemper B.D. (2011). Study of mild traumatic brain injuries using experiments and finite element modeling. Ann. Adv. Automot. Med. 55, 125–135 [PMC free article] [PubMed] [Google Scholar]
- 152.Smith D.H., Nonaka M., Miller R., Leoni M., Chen X.H., Alsop D., and Meaney D.F. (2000). Immediate coma following inertial brain injury dependent on axonal damage in the brainstem. J. Neurosurg. 93, 315–322 [DOI] [PubMed] [Google Scholar]
- 153.Sullivan S., Friess S.H., Ralston J., Smith C., Propert K.J., Rapp P.E., and Margulies S.S. (2013). Behavioral deficits and axonal injury persistence after rotational head injury are direction dependent. J. Neurotrauma 30, 538–545 [DOI] [PMC free article] [PubMed] [Google Scholar]
- 154.Bombardier C.H., Fann J.R., Temkin N.R., Esselman P.C., and Barber J. (2010). Rates of major depressive disorder and clinical outcomes following traumatic brain injury. JAMA 303, 1938–1945 [DOI] [PMC free article] [PubMed] [Google Scholar]
- 155.Bryant R.A., O'Donnell M.L., Creamer M., McFarlane A.C., Clark C.R., and Silove D. (2010). The psychiatric sequelae of traumatic injury. Am. J. Psychiatry 167, 312–320 [DOI] [PubMed] [Google Scholar]
- 156.Kennedy J.E., Jaffee M.S., Leskin G.A., Stokes J.W., Leal F.O., and Fitzpatrick P.J. (2007). Posttraumatic stress disorder and posttraumatic stress disorder-like symptoms and mild traumatic brain injury. J. Rehabil. Res. Dev. 44, 895–920 [DOI] [PubMed] [Google Scholar]