Abstract
Purpose
5α reductase inhibitors (5ARIs) are a main modality of treatment for men suffering from symptomatic benign prostatic hyperplasia (BPH). Over 30% of men do not respond to the therapeutic effects of 5ARIs. We have found that 1/3 of adult prostate samples do not express 5AR2 secondary to epigenetic modifications. We sought to evaluate whether 5AR2 expression in BPH specimens of symptomatic men was linked to methylation of the 5AR2 gene promoter and identify associations with age, obesity, cardiac risk factors, and prostate specific antigen (PSA).
Materials and Methods
Prostate samples from men undergoing transurethral prostate resection were used. 5AR2 protein expression and gene promoter methylation status were determined by common assays. Clinical variables included age, body mass index (BMI), hypertension, hyperlipidemia, diabetes, PSA, and prostate volume. Univariate and multivariate statistical analyses were performed, followed by stepwise logistic regression modeling.
Results
BMI and age were significantly correlated with methylation of the 5AR2 gene promoter (p<0.05), whereas prostate volume, PSA, or use of BPH medication were not. Methylation was highly correlated with 5AR protein expression (p<0.0001). In a predictive model, both increasing age and BMI significantly predicted methylation status and protein expression (p<0.01).
Conclusions
Increasing age and BMI correlate with increased 5AR2 gene promoter methylation and decreased protein expression in men with symptomatic BPH. These results highlight the interplay between age, obesity and gene regulation. Our findings suggest the presence of an individualized epigenetic signature for symptomatic BPH, which may be important for choosing appropriate personalized treatment options.
Keywords: 5-alpha reductase, Benign prostatic hyperplasia, Lower urinary tract symptoms, Obesity, Personalized medicine
1. INTRODUCTION
Symptomatic BPH and lower urinary tract symptoms (LUTS) affect over 80% of men in the US by age 70 and pose a burden on individual quality of life, generating annual healthcare costs of over $4 billion.1–3 Although an estimated 612 million men worldwide will develop LUTS due to BPH,4 no universal therapy exists to treat all men with BPH. Combination therapy with an α-blocker and 5ARI has significantly reduced the risk of clinical progression. However, at least 25–30% of patients do not respond to medical management as measured by International Prostate Symptom Score (IPSS) and a subset require surgical intervention, resulting in over 300,000 BPH surgeries annually in the US.3, 5
Sex steroid hormones are essential for driving prostate growth, but genetic predisposition and modifiable risk factors are also associated with the development of symptomatic BPH. Obesity and aging have been shown in multiple large studies to be associated with increased prostate volume, growth, and risk of symptomatic BPH.6–8 In 5,667 men participating in the Prostate Cancer Prevention Trial (PCPT) for up to 7 years, the risk of LUTS secondary to prostate growth increased by 4% with each additional year of age and by 10% for each 0.05 increase in the waist-to-hip ratio.9 In addition, a subanalysis of the PCPT found that a BMI of 30 or greater attenuates the therapeutic effect of 5ARIs on BPH.10 However, the mechanisms underlying this resistance to therapy remain undefined.
DNA methylation is one of the most common epigenetic mechanisms that affect gene expression. Addition of a methyl group to gene promoter regions rich in CpG dinucleotides alters the chromatin structure, recruits methylated DNA-binding proteins and prevents transcription factor binding, leading to gene silencing (Figure 1).11 Methylation of CpG islands has been associated with regulation of various genes during development, cancer initiation and metastasis.12 We have previously shown that the 5AR2 gene contains a CpG island in its promoter region, and methylation of 5AR2 promoter is correlated with a lack of 5AR2 protein expression in normal prostate tissues.13 We found that about 33% of benign human prostate tissues from surgical specimens contain methylated 5AR2 genes, an observation that can have implications for prostatic growth potential over time as well as sensitivity to 5ARIs. Mechanistically, we have shown that the inflammatory mediator TNF-alpha and DNA methyltransferase 1 (DNMT1) directly affect 5AR2 promoter methylation and protein expression, highlighting a mechanism for regulation of 5AR2 gene expression during adulthood.14 Since inflammatory mediators are upregulated in obese individuals, we hypothesized that 5AR2 gene expression varies among men with symptomatic BPH who are obese.
Figure 1.
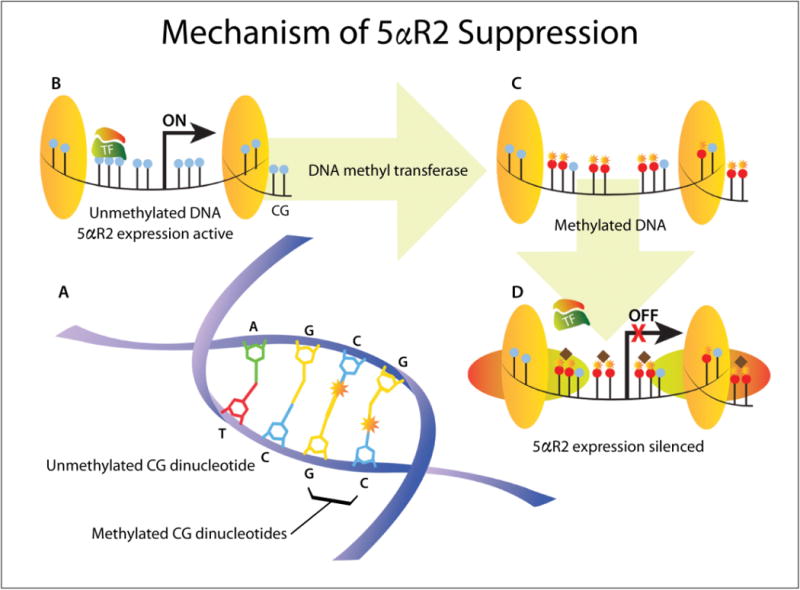
Mechanism of 5AR2 suppression by DNA methylation. (A) DNA methylation adds a methyl group (star) at the carbon-5 position of cytosine residues in CG dinucleotides. (B) In unmethylated DNA (blue CG dinucleotides), chromatin is uncondensed and transcription factors (TF) can bind the gene promoter region, enabling gene expression. (C–D) DNA methylation (red CG dinucleotides with stars) attracts methylated DNA-binding proteins and histone deacetylase complexes (horizontal ovals and diamonds) to form condensed, inactive chromatin that prevents TF binding and silences gene expression (from ref11).
In the present study, we sought to determine whether 5AR2 expression was linked to methylation of the 5AR2 gene promoter in BPH specimens from men with refractory LUTS. We assessed for associations between protein expression and age, obesity, cardiac comorbidities and prostate markers with an aim to explore why some patients may be resistant to 5ARI therapies.
2. MATERIALS AND METHODS
2.1. Patients and Clinical Data Collection
With institutional review board approval, prostate specimens were collected from 104 patients who underwent transurethral resection of the prostate (TURP) for symptomatic BPH at Massachusetts General Hospital between November 2011 and January 2013. Medical records were reviewed to retrospectively collect clinical and pathological data including medical comorbidities (Type II diabetes mellitus, hypertension, hyperlipidemia—dichotomous variables), age (continuous), and BMI (continuous). For some subset analyses, patients were categorized by BMI as normal (<25 kg/m2), overweight (25–29.9 kg/m2), and obese (≥30 kg/m2). Use and duration of α-blockers and/or 5ARIs was assessed. Total prostate volume was either assessed by direct measurement using transrectal ultrasound (TRUS) or calculated by the prolate ellipsoid equation ([length]×[width]×[height]×0.52) from a CT scan within 6 months of surgery. Serum PSA was recorded if a laboratory value was available within 12 months prior to surgery. Because 5ARI use causes a predictable decrease in PSA level, we calculated an adjusted PSA’s based on previously published correction factor15 such that PSA was multiplied by 2.0 for patients taking 5ARIs for less than 4 years or 2.3 for patients taking the medication greater than 4 years.
2.2. Tissue Processing, IHC, DNA Extraction and Methylation Detection
After pathological examination, all prostate samples were frozen and stored at −80°C. Some were fixed in formalin for paraffin embedding or OCT for immunohistochemistry (IHC).
Immunohistochemistry was performed as previously described.16 Briefly, 5uM tissue sections were incubated with the 5AR2 primary antibody (1:200, ab101869, ABCAM, Cambridge, MA), and secondary antibody was used at 1:300 dilution. Three representative areas at 40× magnification were selected for each sample, and 500 cells were manually counted from each representative section as recently published.14 The reactivity (proportion of prostate cells staining positive) was recorded (0% to 100%). We first scored the expression using a semiquantitative evaluation of the percentage of positive cells on a 4-tiered scale: <10%, 11–30%, 31–60%, and >60% based on our previous experience.13 We then treated the data as a continuous variable and fitted a mixture model of two Gaussian distributions to the histogram in order to determine the optimal cutoff point to stratify expression into 2 groups using the validated web-based application Cutoff Finder.17
For methylation analyses, DNA was extracted from prostate tissues with QIAmp DNA Kits (Qiagen Sciences, Germantown, MD). Methylation of CpG islands in the 5AR promoter was assessed using the MethylCollector Ultra Kit (Active Motif, Carlsbad, CA). The primers used for PCR of the 5AR2 gene (SRD5A2) were: 5′-AAGCGGGAGGTGAATGTAAA-3′ (forward) and 5′-CTTTATGGAGCGCCAGACG-3′ (reverse). The PCR program was: pre-denaturation at 95°C for 5 minutes; amplification ×40 cycles: denature at 95°C for 30 seconds, anneal at 55°C for 30 seconds, and extend at 72°C for 1 minute; final extension at 72°C for 10 minutes. Samples were grouped as methylation positive or negative.
2.3. Statistical Analysis
Descriptive statistics were presented as mean and standard deviation with median for continuous variables, or percentages for categorical variables. Patients were divided into two groups based on positive or negative methylation status, and descriptive analyses comparing clinical information were performed using t-tests (continuous variables), Wilcoxon rank sum tests (discrete variables), and chi-square (χ2) tests (dichotomous variables) where appropriate. Univariate logistic regression was performed to identify factors associated with methylation status. Multivariate analysis was undertaken by stepwise logistic regression modeling using all factors identified on univariate analysis (p<0.1) as well as any other factors for which clinical data was available, followed by backward elimination. We then performed a receiver operating characteristic (ROC) analysis to assess the ability of age and BMI to predict methylation. Statistical analyses were performed with JMP-Pro version 11 (SAS Institute Inc., Cary, NC) and R version 3.0.2 (R Foundation for Statistical Computing, Vienna, Austria). All tests were two-tailed, and p<0.05 was considered statistically significant.
3. RESULTS
3.1. Description of Cohort
We obtained prostate tissue from 104 patients who underwent TURP for symptomatic BPH. Eight patients were excluded for incomplete data, leaving 96 patients included in the analysis (Table 1). Ninety patients had total prostate volume measurement by TRUS or CT scan, and 67 patients had laboratory serum PSA information. In our cohort only 15% of men were of normal weight (BMI <25), 49% were overweight (BMI 25–29), and 36% were obese (BMI ≥30).
Table 1.
Demographic and clinical characteristics of the cohort.
| Variables | Total n=96 (100%) | Methylated n=47 (49%) | Unmethylated n=49 (51%) | p |
|---|---|---|---|---|
|
| ||||
| BMI (kg/m2) | Range: 18–44.6 Mean= 29.1 SD= 4.82 |
Range: 18–42.5 Mean= 30.2 SD= 4.56 |
Range: 19.1–44.6 Mean= 28.0 SD= 4.83 |
0.022 |
| Normal weight (BMI<25) | 14 (15%) | 4 (29%) | 10 (71%) | |
| Overweight (BMI 25–29.9) | 47 (49%) | 19 (40%) | 28 (60%) | |
| Obese (BMI≥30) | 35 (36%) | 24 (69%) | 11 (31%) | |
|
| ||||
| Age (yrs) | Range: 52–91 Mean= 70.8 SD= 8.72 |
Range: 52–91 Mean= 73.0 SD= 9.1 |
Range: 53–87 Mean= 68.7 SD= 7.7 |
0.017 |
| 50–59 | 12 | 4 | 8 | |
| 60–69 | 26 | 11 | 15 | |
| 70–79 | 45 | 22 | 23 | |
| ≥80 | 13 | 10 | 3 | |
|
| ||||
| Prostate volume (cc) n=90 | Mean= 82 SD= 40 Median= 78.5 Range: 22–199 |
Mean= 83 SD= 43 Median= 80 Range: 27–196 |
Mean= 81 SD= 38 Median= 78 Range: 22–199 |
0.82 |
| ≤40cc | 5 | 9 | ||
| >40cc | 40 | 36 | ||
|
| ||||
| Adjusted PSA (ng/ml) n=67 | Median= 3.40 Range: 0.21–15.90 |
Median= 4.10 Range: 0.21–15.89 |
Median= 3.21 Range: 0.52–14.40 |
0.22 |
|
| ||||
| Proscar only use | 8 (8%) | 3 | 5 | |
| Flomax only use | 34 (35%) | 17 | 17 | |
| Combined use | 35 (37%) | 18 | 17 | 1.0 |
| No medication or unable to tolerate | 19 (20%) | 9 | 10 | |
|
| ||||
| Median duration of therapy, Proscar, months (range) | 11 (1–94) | |||
|
| ||||
| Median duration of therapy, Flomax, months (range) | 17 (1–131) | |||
|
| ||||
| Comorbidities | ||||
|
| ||||
| Diabetes mellitus | 10 (10%) | 5 | 5 | 0.94 |
| Hyperlipidemia | 61 (64%) | 33 | 28 | 0.18 |
| Hypertension | 66 (69%) | 36 | 30 | 0.10 |
BMI: body mass index. SD: standard deviation. PSA: prostate specific antigen.
Finasteride therapy results in a significant decrease in PSA level, so for our analysis we applied a correction factor validated in the PCPT as described above.15 As expected, PSA values and prostate volumes correlated with age (p<0.05).
Overall, 47 (49%) of patients had a methylated 5AR2 promoter region. The prevalence of hyperlipidemia and hypertension in our cohort was 64% and 69%, respectively. BMI correlated with both hypertension and hyperlipidemia (p<0.01) but not with adjusted PSA or prostate volume. Eighty percent (80%) of patients were being treated with oral medication preoperatively, with 35% using an α-blocker, 8% using a 5ARI, and 37% using combination of both.
As an internal control, we performed a linear regression analysis and found a moderate correlation between prostate volume and adjusted serum PSA level (R2=0.31, p<0.01) (Figure S1). These findings are consistent with many published reports of the positive relationship between PSA and prostate volume and suggest that our cohort is a valid representation of a selected population of patients undergoing surgical intervention for BPH.
3.2. 5AR Promoter Methylation Status Correlates with Protein Expression in BPH Samples
In this study of BPH samples without any evidence of prostate cancer, we evaluated 96 samples for 5AR2 protein expression by IHC. The protein expression level by IHC reactivity was bimodal (Figure S2A), with an optimal cutoff point of 10.8%. We also performed a subgroup analysis of patients who did or did not use finasteride and arrived at a similar cutoff point (Figures S2B–C). Therefore, we considered 5AR2 expression to be positive if >10% of cells in the section stained positive for immunoreactivity, with ≤10% being considered negative for expression. We found a very strong correlation between methylation and 5AR2 protein expression (chi-square test, p<0.0001)(Figure 2 and Table 2).14
Figure 2.
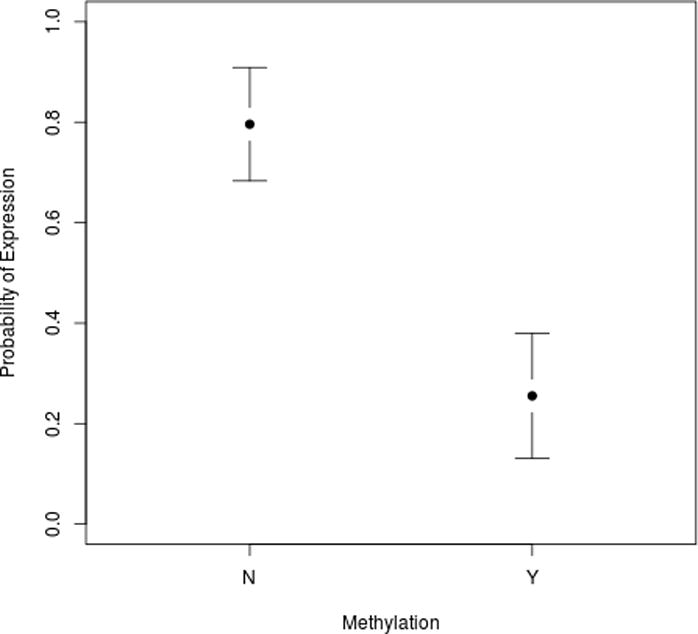
Methylation status of the 5AR2 promoter predicts protein expression. Plot shows probability of protein expression with 95% confidence intervals shown.
Table 2.
5AR2 protein expression by promoter methylation status.14
| 5AR2 Protein Expression | ||
|---|---|---|
| Expression | No expression | |
| Methylated n= 47 | 12 (26%) | 35 (74%) |
| Unmethylated n= 49 | 39 (90%) | 10 (10%) |
Chi-square test, p<0.0001
3.3. Age and BMI Predict Methylation Status and Protein Expression
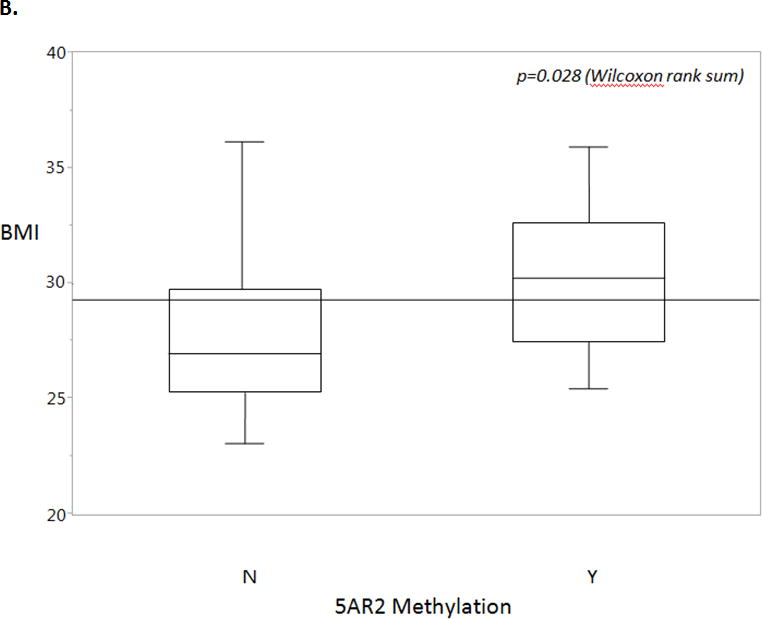
In a univariate analysis we found that age (p=0.020) and BMI (p=0.028) were significantly associated with 5AR2 promoter methylation status (Figure 3). Prostate volume, adjusted PSA, medication use, and cardiac comorbidities did not correlate with methylation status in our cohort (Table 1).
Figure 3.
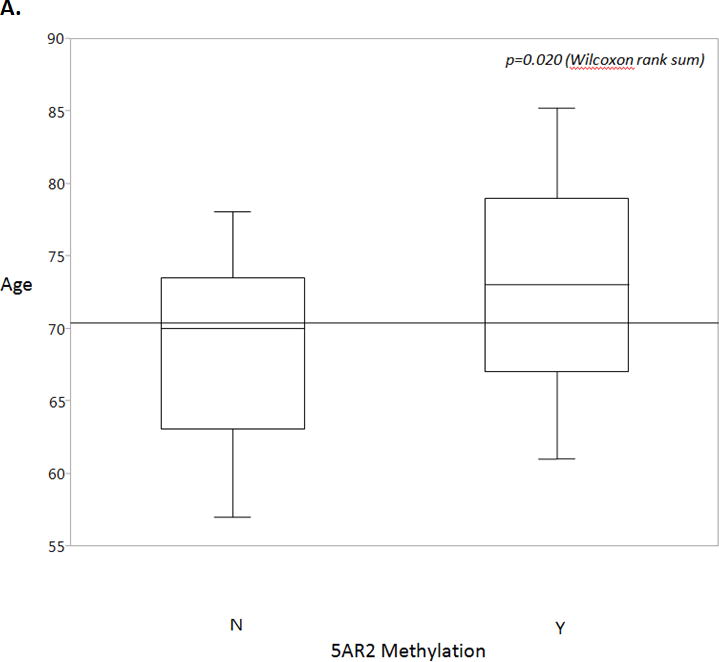
A. Age is a statistically significant predictor of methylation status, with positive methylation status correlating with increased age. Overall mean is shown by the horizontal line. Box plots show 25th to 75th interquartile range and median (horizontal line), whiskers show 10% and 90% quantiles. Wilcoxon rank sum, p=0.020.
B. Body mass index (BMI) is a statistically significant predictor of methylation status, with positive methylation status correlating with increased BMI. Overall mean is shown by the horizontal line. Box plots show 25th to 75th interquartile range and median (horizontal line), whiskers show 10% and 90% quantiles. Wilcoxon rank sum, p=0.028.
Multivariate logistic regression analysis was performed to identify whether all clinical variables, taken together, held a stronger predictive ability. After a stepwise removal process, only age and BMI remained in the model, and the combined model was a better fit, with an improved predictive utility from χ2 of 6.9 (age) or 6.2 (BMI) to 13.0 (Table 3). In addition, the significance of each variable was determined by measuring the deviance differences when either BMI (p=0.008) or age (p=0.006) was removed from the model, which indicated that both age and BMI contributed to the model in a significant way. ROC analysis yielded an area under the curve (AUC) of 0.72 (95% CI [0.62, 0.83]) for the combined model which was improved when compared against either model alone (Figure 4). By this model, increases in age or BMI are associated with an increased likelihood of 5AR2 promoter methylation.
Table 3.
Results of multiple logistic regression modeling to determine factors associated with 5AR2 methylation status.
| Factor | Odds Ratio | 95% CI | p value |
|---|---|---|---|
| Age | 1.07 | 1.02–1.13 | 0.009 |
| BMI | 1.13 | 1.03–1.26 | 0.013 |
Overall model chi-square= 13.0, p=0.002
Age and body mass index (BMI) as continuous variables.
Figure 4.
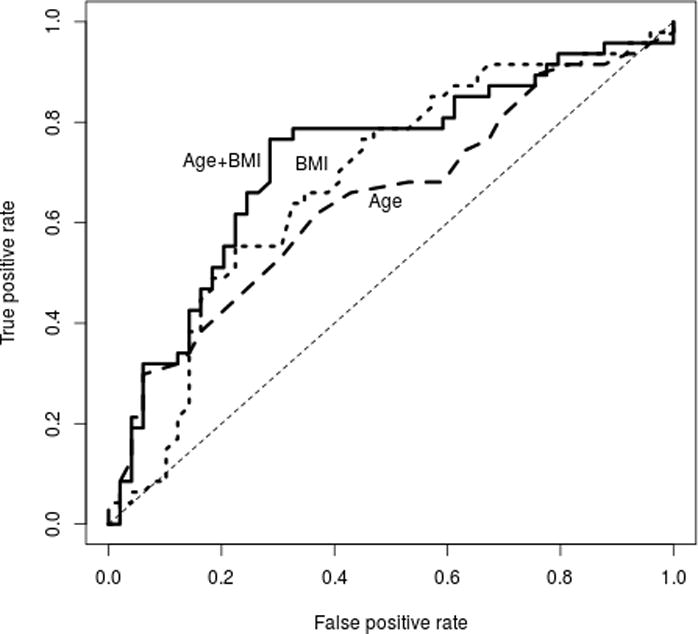
ROC curves for BMI, age, and both as predictors of 5AR2 methylation status. Age AUC 0.64 (95% CI [0.53, 0.76]); BMI AUC 0.68 ([0.57, 0.79]), Age + BMI AUC 0.72 ([0.62, 0.83]).
Given the strong correlation between methylation and lack of protein expression, we conducted a univariate analysis of associations with 5AR2 protein expression. Interestingly, age significantly predicted decreased 5AR2 protein expression (p=0.044), however BMI did not reach statistical significance (p=0.087). Using multivariate logistic regression, both age and BMI were significant predictors of protein expression, with age having the stronger effect in the model (Table 4).
Table 4.
Results of multiple logistic regression modeling to determine factors associated with 5AR2 protein expression.
| Factor | Odds Ratio | 95% CI | p value |
|---|---|---|---|
| Age | 0.94 | 0.90–0.99 | 0.025 |
| BMI | 0.91 | 0.83–0.99 | 0.049 |
Overall model chi-square= 8.5, p=0.014
Age and body mass index (BMI) as continuous variables.
4. DISCUSSION
We found that both BMI and age independently predict increased 5AR2 gene methylation as well as decreased 5AR2 protein expression in BPH specimens of symptomatic men. While 5AR2 has been previously thought to be ubiquitously expressed in order to drive prostatic growth similar to its function in embryologic development,18, 19 our work suggests that 5AR2 protein expression in the adult prostate is variable and may be intimately connected to widespread epigenetic changes that occur with obesity and aging. Furthermore, silenced expression of 5AR2 in some patients, resulting in lack of protein substrate for 5ARIs, may potentially explain why a subset of patients with BPH are resistant to 5ARI therapy.
DNA methylation plays a prominent role in regulating gene expression and influencing downstream functional outcomes that contribute to a disease phenotype. Hypermethylation of specific genes such as MDR1 and RASF1 has been identified in BPH but not in normal prostate tissues,20 and epigenetic changes in other genes have been linked to progression, risk status and even recurrence of tumors such as prostate cancer.21–23 Recent reports are defining an epigenetic signature for obesity by analyzing genome wide patterns of methylation. Increasing BMI is associated with increased global methylation of genes associated with obesity in subcutaneous and omental adipose tissue.24, 25 Interestingly, after undergoing gastric bypass and significant weight loss, patients experience a global decrease in gene methylation. A similar study found that weight loss after gastric bypass leads to hypomethylation of genes in skeletal muscle involved in metabolic processes and mitochondrial function, highlighting the dynamic nature of epigenetic modifications.26 These studies suggest that an individual’s own internal environment is influenced by changes in total body weight and its associated epigenetic signature.
Obesity has been shown to markedly increase the risk of symptomatic BPH (ie, BPH requiring medication or surgery)6–9, 27 and attenuate the clinical benefits associated with 5ARI therapies.10, 28 Our findings suggest that the hypermethylation and systemic inflammatory state associated with obesity and aging may serve as an epigenetic marker of a distinct BPH pathology. Interestingly, reversal of obesity through weight loss and its associated hypomethylation can improve symptomatic BPH. In a prospective multicenter study of 86 patients who underwent bariatric weight loss surgery, there was a significant overall reduction in LUTS at 6 weeks that was sustained at one year after surgery.29 Several other reports found that healthy dietary quality and increased physical exercise have a protective effect against LUTS.27, 30 Taken together, these findings suggest that dynamic changes in methylation status may be associated with lifestyle modifications that lead to BPH regression and improvements in LUTS.
This is the first study to our knowledge to correlate obesity and aging with gene methylation in benign prostatic diseases. Mechanistically, we have shown that inflammatory mediators and DNMT1 methylate 5AR2 and silence expression of the gene.14 Increased adiposity in obesity can lead to greater aromatization of circulating testosterone into estrogen, but the relationship between estrogen receptor status, testosterone levels and methylation remains unknown and is the subject of future work. In this study, all prostate specimens were derived from patients with symptomatic BPH who required surgical resection. Most (80%) had previously failed a trial of medical therapy, with 45% failing 5ARIs. Current prospective studies are ongoing at our institution to ascertain whether hypermethylation precedes symptomatic BPH, or whether it is a marker of the disease state. To that end, 5AR2 methylation status may help define an epigenetic signature to risk stratify patients with BPH and identify those likely to fail current medical therapy.
The limitations of our study deserve mention. Our sample cohort reflects a specific population of patients who underwent surgical intervention for symptomatic BPH at a tertiary referral center. Second, our study was not longitudinal, so we are only able to make observations at one point in time. Our analyses are exploratory and, combined with our recently published work that elucidates the mechanism of 5AR2 promoter methylation,14 invite future studies to explore utilization of 5AR2 methylation as a gene signature for personalized care for management of patients with prostatic diseases.
5. CONCLUSIONS
Age and BMI are correlated with methylation of 5AR2 gene promoter in BPH samples. Methylation of the 5AR2 promoter region is strongly correlated with absence of protein expression. These results highlight the interplay between metabolic risk factors and gene regulation and suggest an epigenetic signature, which may ultimately be utilized to tailor 5ARI therapies for management of BPH.
Supplementary Material
Figure S1. Prostate volume (cc) correlates with adjusted PSA value. Linear regression analysis: Adjusted PSA = −0.05 + 0.06 * volume, R2=0.31, p<0.0001.
Figure S2. Distribution based cutoff optimization, independent of outcome data. Histograms of 5AR2 protein expression levels for all patients in the cohort (A), patients taking finasteride before surgery (B), and patients with no history of finasteride use (C). A mixture model of two Gaussian distributions is fitted to each of the histograms (red lines). Vertical lines designate the optimal cutoffs derived from the mixture model using Cutoff Finder.17
Acknowledgments
This work was conducted with support from NIH Grant R01 DK091353.
This work was conducted with support from Harvard Catalyst | The Harvard Clinical and Translational Science Center (NCRR and NCATS, NIH Award UL1 TR001102) and financial contributions from Harvard University and its affiliated academic healthcare centers.
References
- 1.Berry SJ, Coffey DS, Walsh PC, et al. The development of human benign prostatic hyperplasia with age. J Urol. 1984;132:474. doi: 10.1016/s0022-5347(17)49698-4. [DOI] [PubMed] [Google Scholar]
- 2.Isaacs JT. Etiology of benign prostatic hyperplasia. Eur Urol. 1994;25(Suppl 1):6. doi: 10.1159/000475324. [DOI] [PubMed] [Google Scholar]
- 3.Saigal CS, Joyce G. Economic costs of benign prostatic hyperplasia in the private sector. J Urol. 2005;173:1309. doi: 10.1097/01.ju.0000152318.79184.6f. [DOI] [PubMed] [Google Scholar]
- 4.Irwin DE, Kopp ZS, Agatep B, et al. Worldwide prevalence estimates of lower urinary tract symptoms, overactive bladder, urinary incontinence and bladder outlet obstruction. BJU Int. 2011;108:1132. doi: 10.1111/j.1464-410X.2010.09993.x. [DOI] [PubMed] [Google Scholar]
- 5.McConnell JD, Bruskewitz R, Walsh P, et al. The effect of finasteride on the risk of acute urinary retention and the need for surgical treatment among men with benign prostatic hyperplasia. Finasteride Long-Term Efficacy and Safety Study Group. N Engl J Med. 1998;338:557. doi: 10.1056/NEJM199802263380901. [DOI] [PubMed] [Google Scholar]
- 6.Freedland SJ, Platz EA, Presti JC, Jr, et al. Obesity, serum prostate specific antigen and prostate size: implications for prostate cancer detection. J Urol. 2006;175:500. doi: 10.1016/S0022-5347(05)00162-X. [DOI] [PubMed] [Google Scholar]
- 7.Lee S, Min HG, Choi SH, et al. Central obesity as a risk factor for prostatic hyperplasia. Obesity (Silver Spring) 2006;14:172. doi: 10.1038/oby.2006.21. [DOI] [PubMed] [Google Scholar]
- 8.Parsons JK, Carter HB, Partin AW, et al. Metabolic factors associated with benign prostatic hyperplasia. J Clin Endocrinol Metab. 2006;91:2562. doi: 10.1210/jc.2005-2799. [DOI] [PMC free article] [PubMed] [Google Scholar]
- 9.Kristal AR, Arnold KB, Schenk JM, et al. Race/ethnicity, obesity, health related behaviors and the risk of symptomatic benign prostatic hyperplasia: results from the prostate cancer prevention trial. J Urol. 2007;177:1395. doi: 10.1016/j.juro.2006.11.065. [DOI] [PubMed] [Google Scholar]
- 10.Parsons JK, Schenk JM, Arnold KB, et al. Finasteride reduces the risk of incident clinical benign prostatic hyperplasia. Eur Urol. 2012;62:234. doi: 10.1016/j.eururo.2012.03.007. [DOI] [PMC free article] [PubMed] [Google Scholar]
- 11.Bechis SK, Otsetov AG, Ge R, et al. Personalized Medicine for Management of Benign Prostatic Hyperplasia. J Urol. 2014;192:16. doi: 10.1016/j.juro.2014.01.114. [DOI] [PMC free article] [PubMed] [Google Scholar]
- 12.Baylin SB, Jones PA. A decade of exploring the cancer epigenome – biological and translational implications. Nat Rev Cancer. 2011;11:726. doi: 10.1038/nrc3130. [DOI] [PMC free article] [PubMed] [Google Scholar]
- 13.Niu Y, Ge R, Hu L, et al. Reduced levels of 5-alpha reductase 2 in adult prostate tissue and implications for BPH therapy. Prostate. 2011;71:1317. doi: 10.1002/pros.21348. [DOI] [PubMed] [Google Scholar]
- 14.Ge R, Wang Z, Bechis SK, et al. DNA Methyl Transferase 1 Reduces Expression of SRD5A2 in the Aging Adult Prostate. Am J Pathol. 2015;185:870. doi: 10.1016/j.ajpath.2014.11.020. [DOI] [PMC free article] [PubMed] [Google Scholar]
- 15.Thompson IM, Goodman PJ, Tangen CM, et al. The influence of finasteride on the development of prostate cancer. N Engl J Med. 2003;349:215. doi: 10.1056/NEJMoa030660. [DOI] [PubMed] [Google Scholar]
- 16.Zhang X, Jin TG, Yang H, et al. Persistent c-FLIP(L) expression is necessary and sufficient to maintain resistance to tumor necrosis factor-related apoptosis-inducing ligand-mediated apoptosis in prostate cancer. Cancer Res. 2004;64:7086. doi: 10.1158/0008-5472.CAN-04-1498. [DOI] [PubMed] [Google Scholar]
- 17.Budczies J, Klauschen F, Sinn BV, et al. Cutoff Finder: a comprehensive and straightforward Web application enabling rapid biomarker cutoff optimization. PLoS One. 2012;7:e51862. doi: 10.1371/journal.pone.0051862. [DOI] [PMC free article] [PubMed] [Google Scholar]
- 18.Thomas LN, Douglas RC, Lazier CB, et al. Type 1 and type 2 5alpha-reductase expression in the development and progression of prostate cancer. Eur Urol. 2008;53:244. doi: 10.1016/j.eururo.2007.10.052. [DOI] [PubMed] [Google Scholar]
- 19.Zhu YS, Imperato-McGinley JL. 5alpha-reductase isozymes and androgen actions in the prostate. Ann N Y Acad Sci. 2009;1155:43. doi: 10.1111/j.1749-6632.2009.04115.x. [DOI] [PubMed] [Google Scholar]
- 20.Dobosy JR, Roberts JL, Fu VX, et al. The expanding role of epigenetics in the development, diagnosis and treatment of prostate cancer and benign prostatic hyperplasia. J Urol. 2007;177:822. doi: 10.1016/j.juro.2006.10.063. [DOI] [PubMed] [Google Scholar]
- 21.Audet-Walsh E, Bellemare J, Nadeau G, et al. SRD5A polymorphisms and biochemical failure after radical prostatectomy. Eur Urol. 2011;60:1226. doi: 10.1016/j.eururo.2011.06.020. [DOI] [PubMed] [Google Scholar]
- 22.Henrique R, Oliveira AI, Costa VL, et al. Epigenetic regulation of MDR1 gene through post-translational histone modifications in prostate cancer. BMC Genomics. 2013;14:898. doi: 10.1186/1471-2164-14-898. [DOI] [PMC free article] [PubMed] [Google Scholar]
- 23.Keil KP, Abler LL, Mehta V, et al. DNA methylation of E-cadherin is a priming mechanism for prostate development. Dev Biol. 2014 doi: 10.1016/j.ydbio.2014.01.020. [DOI] [PMC free article] [PubMed] [Google Scholar]
- 24.Benton MC, Johnstone A, Eccles D, et al. An analysis of DNA methylation in human adipose tissue reveals differential modification of obesity genes before and after gastric bypass and weight loss. Genome Biol. 2015;16:8. doi: 10.1186/s13059-014-0569-x. [DOI] [PMC free article] [PubMed] [Google Scholar]
- 25.Dick KJ, Nelson CP, Tsaprouni L, et al. DNA methylation and body-mass index: a genome-wide analysis. Lancet. 2014;383:1990. doi: 10.1016/S0140-6736(13)62674-4. [DOI] [PubMed] [Google Scholar]
- 26.Barres R, Kirchner H, Rasmussen M, et al. Weight loss after gastric bypass surgery in human obesity remodels promoter methylation. Cell Rep. 2013;3:1020. doi: 10.1016/j.celrep.2013.03.018. [DOI] [PubMed] [Google Scholar]
- 27.Parsons JK, Sarma AV, McVary K, et al. Obesity and benign prostatic hyperplasia: clinical connections, emerging etiological paradigms and future directions. J Urol. 2013;189:S102. doi: 10.1016/j.juro.2012.11.029. [DOI] [PubMed] [Google Scholar]
- 28.Muller RL, Gerber L, Moreira DM, et al. Obesity is associated with increased prostate growth and attenuated prostate volume reduction by dutasteride. Eur Urol. 2013;63:1115. doi: 10.1016/j.eururo.2013.02.038. [DOI] [PubMed] [Google Scholar]
- 29.Luke S, Addison B, Broughton K, et al. Effects of bariatric surgery on untreated lower urinary tract symptoms: a prospective multicentre cohort study. BJU Int. 2015;115:466. doi: 10.1111/bju.12943. [DOI] [PubMed] [Google Scholar]
- 30.Erickson BA, Vaughan-Sarrazin M, Liu X, et al. Lower urinary tract symptoms and diet quality: findings from the 2000–2001 National Health and Nutrition Examination Survey. Urology. 2012;79:1262. doi: 10.1016/j.urology.2012.03.004. [DOI] [PMC free article] [PubMed] [Google Scholar]
Associated Data
This section collects any data citations, data availability statements, or supplementary materials included in this article.
Supplementary Materials
Figure S1. Prostate volume (cc) correlates with adjusted PSA value. Linear regression analysis: Adjusted PSA = −0.05 + 0.06 * volume, R2=0.31, p<0.0001.
Figure S2. Distribution based cutoff optimization, independent of outcome data. Histograms of 5AR2 protein expression levels for all patients in the cohort (A), patients taking finasteride before surgery (B), and patients with no history of finasteride use (C). A mixture model of two Gaussian distributions is fitted to each of the histograms (red lines). Vertical lines designate the optimal cutoffs derived from the mixture model using Cutoff Finder.17


