Abstract
Herein, we present a novel acid-less synthetic approach for in-situ polymerization of aniline synchronized with reduction of graphene oxide to graphene. This method provides uniform deposition of ordered polyaniline nanotubes over the surface of graphene nanosheets. The synthesized graphene-polyaniline nanocomposite has the ability of complete removal of harmful dyes commonly used in industry: such as methyl orange, methylene blue, and rhoadmine B from the waste water under the exposure to natural sunlight. The system can be used as an efficient solar energy operated photocatalyst due to effective suppression of recombination of the charge carriers. The unique spatial structure of the graphene-polyaniline nanocomposite has high chemical stability, can be recycled after photolysis, and allows using in multiple cycles without reduction in its photocatalytic activity. In addition, the graphene-polyaniline nanocomposite exhibits strong near-infrared (NIR) absorption, good photothermal stability, as well as shows substantial thermal energy generation under exposure to 808 or 980 nm NIR lasers. The electrical conductivity of polyaniline nanotubes is improved as a result of their conjugation with graphene nanosheets in the nanocomposite. Owing to its outstanding photocatalytic activity and chemical stability, the reported graphene-polyaniline nanocomposite has a great potential in purification of industrially generated waste water.
Keywords: Graphene, Polyaniline, Photocatalyst, Photothermal effect, Electrical conductivity
Graphical Abstract
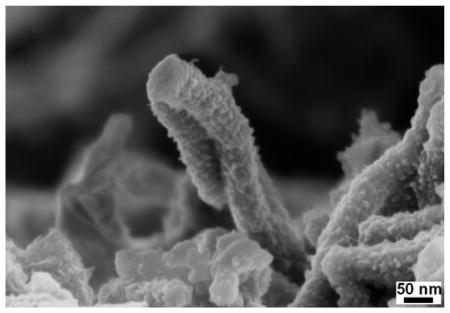
A novel acid-less synthetic approach has been reported for in-situ polymerization of aniline and synchronized reduction of graphene oxide to graphene. This method provides uniform deposition of ordered polyaniline nanotubes over the surface of graphene nanosheets. Thus generated graphene-polyaniline nanocomposite has the ability of complete removal of industrially popularly-used harmful dyes such as methyl orange, methylene blue and rhoadmine B from waste water under the exposure to natural sunlight.
1. Introduction
In the recent years, lot of research has been devoted to address the issues of energy shortage and environmental pollution. A promising way of overcoming the existing barriers in the field is an efficient utilization of the solar energy [6,7]. In this context several new promising photocatalysts were suggested and tested recently for their catalytic activity [1–5]. Sunlight driven photocatalysis, in general, has a prominent ability in utilization of the solar energy conversion and environmental remediation. Yet now, the overall photocatalytic efficiency of the existing photocatalysts is too low for commercial applications. In addition, current photocatalysts suffer from a slow electron transfer rate and relatively fast charge recombination process. It is highly desired to explore and develop new photocatalysts with a higher quantum yield. Among the so far investigated photocatalytic materials, polyaniline (PANI) is an important compound owing to its good stability, corrosion protection property and low toxicity [8]. Furthermore, PANI with an extended π-conjugated electron system exhibits great potential in the field due to its high absorption coefficient in the visible range of light and high mobility of charge carriers [9,10]. In addition, PANI is simultaneously a good electron donor and excellent hole acceptor material under photo illumination [11].
However, apart from above mentioned benefits, the catalytic activity of PANI has hindered from fast recombination of charge carriers generated during photolysis. In order to inhibit the recombination of photo-generated electron-hole pairs, various approaches can be considered. Among those, possible conjugation of PANI with graphene (GR) has received special attention due to the superior electron mobility (2×105 cm2/V s) and high specific surface area (2600 m2/g) of the latter [12]. Owing to its high electron mobility, GR quickly accumulates photo-generated electrons from the PANI thus reducing the probability of the electron-hole pair recombination. At the same time, high surface area of GR facilitates better adsorption of pollutants at the surface of the photocatalyst. Moreover, the presence of the GR phase promotes better dispersion of PANI in the composite thus increasing its photocatalytic efficiency. It can be identified that the GR acts as an electron acceptor in the nanocomposite because of its two-dimensional π-π conjugation, which reduces the recombination rate of charge carriers and ultimately enhances the performance of the photocatalyst [13]. In consideration of the synergistic effect between GR and PANI Ameen et al. have studied degradation of bengal rose dye using a PANI/GR photocatalyst. They have found that about 56% of the dye has been degraded during three hours of photoillumination [14]. Zhang et al. have prepared the hierarchical nanocomposites of PANI nanorods and graphitic carbon nitride sheets and used them to trigger degradation of methylene blue and methyl orange [10]. As reported the complete degradation of methyl orange occurred within the first 25 minutes and about 79% of methylene blue has been degraded within 30 minutes of illumination. So far reported synthetic approaches for preparation of graphene-polyaniline (GR-PANI) nanocomposites required usage of some acids, which is in contradiction with modern “green chemistry” approaches. In our paper, we report on an alternative benign synthetic way for the GR-PANI nanocomposites preparation.
As discussed in previous publications possible means for the enhancement in the photocatalytic activity of GR based composites include: 1) increase of the material’s ability for sorption of pollutants, 2) broadening of the light absorption range, and 3) optimization of the trapping and shuttling of the photogenerated electrons [15–20]. In addition, the GR component was reported to possess a strong photothermal effect (PTE), which may also be a key factor in the enhancement of the photocatalytic activity of GR based composites. However, till now this possibility has not been explored.
Recently, the photothermal therapy (PTT) method has been introduced as a valuable and increasingly recognized alternative in medical cancer treatments [21–24]. The method uses near-infrared (NIR) laser light to generated heat and destroy tumor cells in vivo. Compared to traditional therapeutic treatments, the PTT shows a minimal invasive nature and improved selectivity since only the lesion that is exposed to the light is treated, while other tissues (which are not exposed to laser radiation) are not affected. In the PTT treatment, the applied photothermal agent should be able to generate a sufficient heat or thermal energy under the laser light exposure in order to destroy cancerous cells and so the success of the treatment depends entirely on the PTE property of the material being used. The GR component of the photocatalyst should be able to generate enough thermal energy for thermal degradation of pollutants in a steady state regime under continuous photo-illumination when the temperature of the reaction mixture remains nearly constant. This effect restricts also recombination of the photogenerated charge carriers and significantly enhances the photocatalytic activity of the catalyst.
In this work, we suggest a novel, acid-less method for the preparation of GR-PANI nanocomposites with enhanced photocatalytic activity. This process provides the route for in-situ reduction of graphene oxide (GO) to GR coupled with synchronous polymerization of aniline. The latter process results in a uniform deposition of ordered PANI nanotubes over the surface of GR nanosheets. Thus constructed GR-PANI nanocomposites have been studied using various experimental techniques including testing their electrical, spectroscopic properties, photocatalytic activity, and PTE. The catalytic activity of GR-PANI nanocomposite has been evaluated by the process of degradation of several industrially versatile and harmful dyes viz., methyl orange (MO), methylene blue (MB) and rhodamine B (RhB) by exposing them to a natural sun light. Furthermore, we report on the PTE effect in GR-PANI nanocomposites, which has been explored when aqueous dispersions of the GR-PANI material were exposed to 808 or 980 nm NIR laser light.
2. Experimental
2.1. Materials
All the reagents were purchased from Aldrich and used without further purification unless otherwise noted and aniline was distilled under reduced pressure prior usage. Aqueous solutions were prepared using ultra-pure water obtained from Milli-Q Plus system (Millipore).
2.2. Preparation of GO
GO was prepared from graphite powder according to the Hummers and Offeman method with slight modifications [25]. In a typical procedure, 1 g of graphite powder (<20 μm, Aldrich) was added to 40 mL concentrated H2SO4 and stirred for 1 h under ice-cooling condition. Then, 15 mL fuming HNO3 was slowly added and stirred the mixture for 30 min. To this, 5 g of KMnO4 was gradually added with stirring and cooling and the resulting mixture was stirred at room temperature for 12 h followed by addition of 150 mL DI water. After stirring the mixture for 30 mins, 30 mL of H2O2 (30%) was slowly added, which turned the color of the reaction mixture to bright yellow. The resulted mixture was centrifuged and washed with 1:10 HCl in water solution in order to remove metal ions. Further, the mixture was washed with DI water until complete removal of the acids and thus obtained dark-yellow colored GO was dried under vacuum at 40 °C for 12 h. The drying process of GO was carried out at lower temperature in order to avoid its deoxygenation.
2.2. Preparation of GR-PANI nanocomposite
In a typical synthesis, 50mg of GO was dispersed in 25 mL DI water by ultrasonication for 10 mins and 7 mmol of aniline was added to it. The resulted mixture was stirred at room temperature for 10 min and further stirred for 30 min under the temperature of 0–5 °C. Then, 7 mmol aqueous solution of ammonium persulfate was added to the mixture in one portion. The resulting solution was stirred for another half a minute to ensure complete mixing, and the reaction was allowed to proceed under static condition for 12 h by maintaining the temperature between 0–5 °C. Thus prepared GR-PANI nanocomposite was washed with DI water and dried under vacuum at 50 °C for 12 h. The overall procedure for the preparation of GR-PANI nanocomposite is schematically depicted in Fig. 1.
Fig. 1.
Schematic illustration of preparation of GR-PANI nanocomposite.
2.3. Synthesis of PANI nanotubes
The PANI nanotubes were synthesized according to the procedure depicted above for the preparation of GR-PANI nanocomposite without use of GO.
2.4. Photocatalytic activity
The photocatalytic activity of GR-PANI nanocomposite was evaluated by the degradation efficiency of MO, MB and RhB under exposure to natural sunlight. All the photocatalytic experiments were performed under exposure to direct sunlight during June between 1 pm and 4 pm. During the photolysis, the average intensity of sunlight was measured using Light Meter (LX1010B), which was found to be 700–800 W/m2. The photocatalytic process was performed in natural atmosphere, without any external source of aeration. In each experiment, 10 mg of catalyst was suspended in 100 mL aqueous solution of MO, MB or RhB (10 mg/L). This suspension was magnetically stirred in dark for 30 min in order to establish adsorption/desorption equilibrium of MO, MB and RhB molecules on the surface of the catalyst. Then, it was transferred to a double walled quartz photocatalytic reactor with water circulation facility to maintain the reaction mixture at room temperature. The suspension was then exposed to natural sunlight under constant stirring. At a given interval of time, 5 mL of suspension was taken out, centrifuged and the concentration of MO, MB and RhB was analyzed by measuring its absorbance using UV–vis spectrophotometer. Further, the normalized concentration of MO, MB and RhB after photolysis was calculated as C/C0, where C0 is the initial concentration of MO, MB and RhB and C is the concentration of MO, MB and RhB measured after exposure at a particular interval of time.
2.5. Photothermal effect
To investigate the PTE of GR-PANI nanocomposite, 808 and 980 nm NIR diode laser systems (Armlaser Inc. USA) with the output power of 2 W/cm2 were employed. In each experiment, 1 mL aqueous dispersions of GR-PANI nanocomposite was transferred into 1 × 1 × 4 cm3 quartz cuvette and illuminated using NIR laser. Variation of the temperature mediated by the exposure to the laser light was recorded using Hanna precision digital thermometer (Model: HI93510) having a thermocouple immersed in the aqueous dispersions during the experiment.
2.6. Electrical measurements
Electrical measurements were performed with a two-electrode scheme using the Keithley 2400 multimeter. For the two-electrode scheme, a pair of silver electrodes with a gap of 200 μm between them was deposited on a glass substrate by vacuum thermal evaporation [26,27]. A 5 wt% aqueous dispersions of GR, PANI and GR-PANI nanocomposite prepared by sonication were cast on top of the electrode structure and dried before proceeding for measurements. Variation of the current (I) was then measured as a function of the applied voltage (V) and the electrical conductivity (σ) of the samples was calculated from the slope of the I–V curves using the relation:
where L is the distance between the silver electrodes and A is the cross-sectional area of the sample (width of the electrodes multiplied by the film thickness). The thickness and width of the films were measured using AFM technique in accordance with a method reported earlier [28, 29].
2.6. Characterization
The ATR-IR spectra were recorded using Smiths ChemID diamond attenuated total reflection (DATR) spectrometer and TGA were performed with a Perkin Elmer Diamond TG/DTA instrument at a heating rate of 10 °C/min. Powder XRD patterns were recorded on Scintag X-ray diffractometer (PAD X), equipped with Cu Kα photon source (45 kV, 40 mA) at scanning rate of 3°/min. SEM measurements were carried out on a JEOL JXA-8900 microscope and Raman spectra were recorded with Renishaw R-3000QE system in the backscattering configuration using an Argon ion laser with wavelength 785 nm. The UV-vis absorption spectra were recorded on a Varian Carry 50 Bio UV-vis spectrophotometer and the photoluminescence (PL) spectra were measured using PerkinElmer LS-45 luminescence spectrometer. The pH of solutions was measured using Sargent-Welch (pH 8001) pH meter. The N2 adsorption-desorption isotherms were measured by ASAP2020 (Micrometrics, USA) surface area analyzer at 77 K.
3. Results and discussion
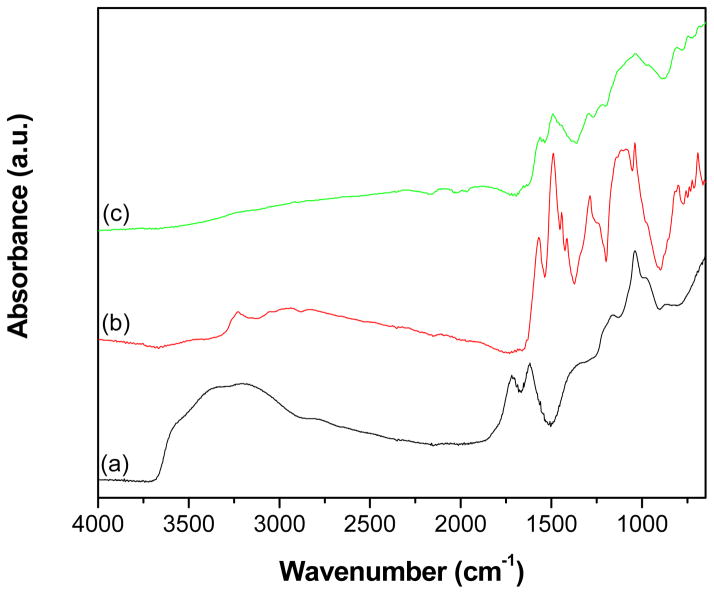
The ATR-IR spectra of GO, PANI and GR-PANI nanocomposite are shown in Fig. 2. The spectrum of GO (Fig. 2a) displays a broad band at 3395 cm−1 corresponding to -OH stretching vibrations and a band at 1719 cm−1 owing to C=O stretching vibrations in carboxylic acid and carbonyl moieties. The bands exhibited at 1619 and 1377 cm−1 are ascribed to skeletal vibrations of unoxidized graphitic domains and O-H deformations of the C-OH groups, respectively. The band corresponding to stretching vibrations of alkoxy C-O groups is observed at 1039 cm−1. While the broad band which appears at 3227 cm−1 (Fig. 2b) can be attributed to the N–H stretching mode, the bands located at 1570 and 1487 cm−1 are ascribed to the C=C stretching deformation of quinoid and benzenoid rings, respectively [28,30]. The bands displayed at 1286 and 1113 cm−1 correspond to C–N stretching vibrations of the secondary aromatic amine and aromatic C–H in-plane bending, respectively [31,32]. The bands at 801 and 694 cm−1 are due to aromatic C–H bending and aromatic ring bending. All the characteristic bands, which appear for the PANI sample (Fig. 2b), also can be seen in the spectrum of the GR-PANI composite (Fig. 2c) that confirms formation of the PANI in the nanocomposite. The characteristic band observed at 1570 cm−1 (Fig. 2c) is attributed to the skeletal vibration of GR, which is overlapping with the C=C stretching of quinoid rings of the PANI. However, the characteristic absorption bands of GO are absent in the spectrum of GR-PANI nanocomposite indicating its successful reduction to GR. Owing to strong interaction existing between PANI and GR nanosheets, the characteristic bands of PANI have an obvious red shift in the spectrum of the GR-PANI nanocomposite. The spectral red-shift phenomena observed in the spectrum of GR-PANI nanocomposite resulted from π-π interaction and hydrogen bonding between GR nanosheets and the PANI backbone [33].
Fig. 2.
ATR-IR spectra of (a) GO, (b) PANI and (c) GR-PANI nanocomposite.
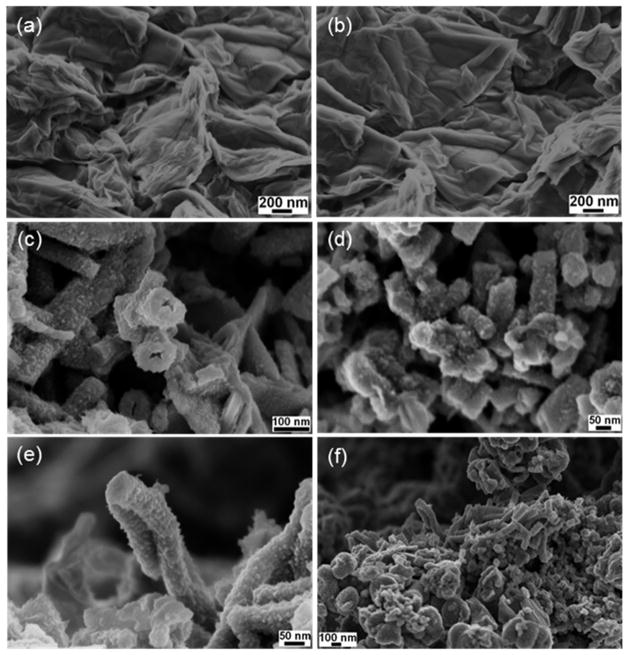
Fig. 3 shows the FESEM images of GO, PANI and GR-PANI nanocomposites. GO surface displays the typical layered sheet morphology with an average sheet thickness of several hundred nanometers (Figs. 3a and b). Also, Figs. 3a and b demonstrate effective exfoliation of the GO nanosheets and their porous structure generated by opening of planar carbon networks wedged at the edge surface of the crystallite by the oxidation process. The surface morphology of the deposited PANI layer appears to be uneven with characteristic tube-like structures about 100 nm in diameter and an average thickness of about 40 nm (Figs. 3c and d). The GR-PANI nanocomposite exhibits a homogeneous deposition of PANI nanotubes over the surface of GR nanosheets, which indicates that the aniline monomer has been polymerized on the both surfaces of GR nanosheets to form sandwich like structures (Figs. 3e and f). The morphology of PANI nanotubes found in PANI (Figs. 3c and d) and GR-PANI nanocomposites (Figs. 3e and f) is identical. Similarly to the fullerene (C60) and single-walled carbon nanotubes, GR is a good electron acceptor, while the aniline is a good electron donor [34]. When the aniline monomer is added to the dispersion of GR it absorbs spontaneously onto the surface of the GR nanosheets owing to the electrostatic attraction. Following addition of aqueous solution of ammonium persulfate to the dispersion leads to initiation of the aniline polymerization (“grafting-from” growth from the absorbed sites) on the surface of the GR nanosheets. In the process of in-situ polymerization of aniline, GR nanosheets are acting as a supporting material, which can supply a large number of active sites for the nucleation of PANI, thus inducing a complete and uniform deposition of PANI nanotubes over the GR nanosheets. The resulting deposition of ordered PANI nanotubes over the surface of crumpled GR nanosheets can be obviously seen in Figs. 3e and f. The homogenous deposition of PANI nanotubes over the GR nanosheets suggests the occurrence of strong interaction between them. Moreover, existence of single layered GR nanosheets in GR-PANI nanocomposites is clearly visible.
Fig. 3.
FESEM images of (a and b) GO, (c and d) PANI and (e and f) GR-PANI nanocomposite.
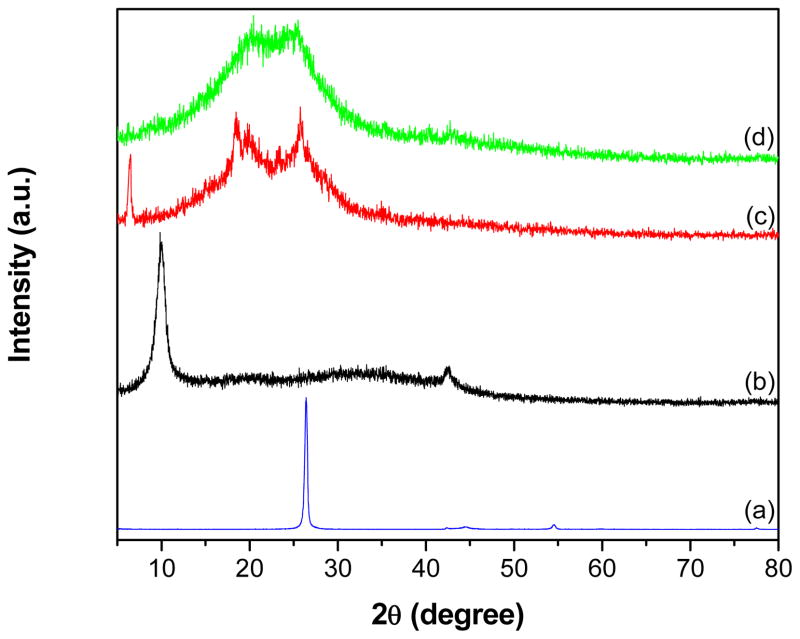
Fig. 4 shows the XRD patterns of graphite, GO, PANI and GR-PANI nanocomposite. The inter-planar crystal d-spacing calculated by Bragg’s equation for graphite (Fig. 4a) is found to be 0.337 nm, while it is larger for the GO sample (0.896 nm) (Fig. 4b). The observed increment in the d-spacing of GO can be attributed to the existence of various functional groups such as -OH, -COOH and -CO on the surface of GO nanosheets produced during the process of their oxidation. Furthermore, the GO displays a diffraction peak at 9.9° which corresponds to the (0 0 1) crystalline plane. Pure PANI exhibites a sharp peak at 6.5° (Fig. 4c) accompanied by other peaks at 18.5°, 19.8° and 25.8° corresponding to (0 0 1), (0 1 1), (0 2 0), and (2 0 0) diffraction planes of the crystalline phase of PANI, respectively [35]. In the pattern of GR-PANI nanocomposite (Fig. 4d), all the characteristic peaks of PANI are observed, while the characteristic peak at 25° corresponding to the GR is overlapping with the diffractions from PANI. The broad nature of the diffraction peaks in GR-PANI nanocomposite indicates poor ordering of GR nanosheets along the stacking direction, which implies that the GR-PANI nanocomposite is composed mostly of single or few layer of GR nanosheets. In addition, the diffraction peak at 9.9° related to GO has not been observed in GR-PANI nanocomposite showing its successful conversion into GR in presence of the aniline.
Fig. 4.
XRD patterns of (a) graphite, (b) GO, (c) PANI and (d) GR-PANI nanocomposite.
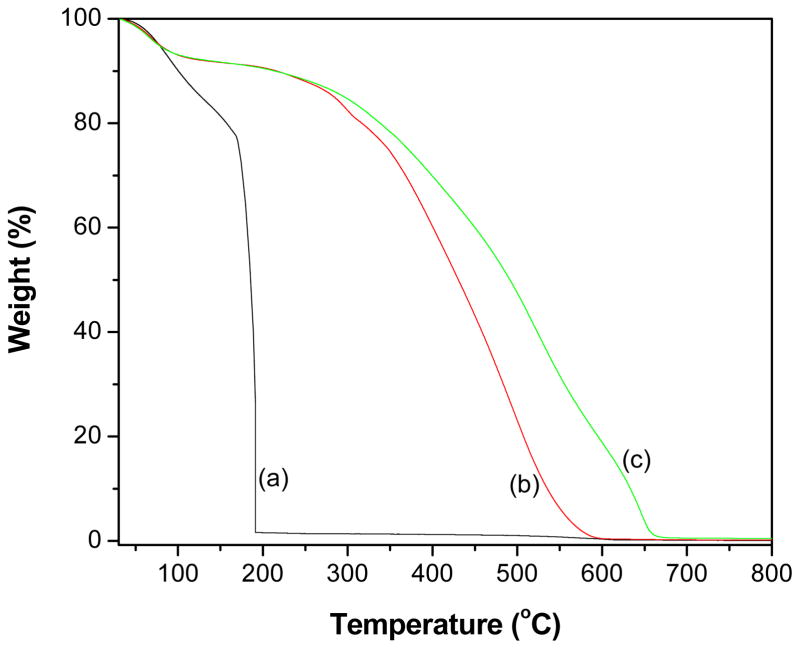
The results of the thermal stability study by TGA technique for GO, PANI, and GR-PANI nanocomposite are presented in Fig. 5. All the samples exhibited a minute weight loss below 100 °C due to loss of intercalated water molecules. The GO (Fig. 5a) showed a dramatic weight loss in the range of 160–200 °C owing to decomposition of oxygen-containing functional groups. Further, the PANI (Fig. 5b) demonstrated a weight loss in the range of 100–300 °C due to removal of lower oligomers of PANI. When the heating continued thermo-oxidative decomposition of PANI could be observed between 350 and 600 °C. The GR-PANI nanocomposite (Fig. 5c) did not show any significant weight loss below 200 °C indicating absence of oxygen-containing functional groups and successful conversion of GO to GR in presence of aniline. Moreover, the thermal stability of GR-PANI nanocomposite was found to be higher than for the pristine PANI, which is due to the presence of GR nanosheets and different structural organization of the PANI phase. The latter has a globular structure in the pristine form of PANI and some elongated conformation in the GR-PANI nanocomposite.
Fig. 5.
TGA profiles of (a) GO, (b) PANI and (c) GR-PANI nanocomposite.
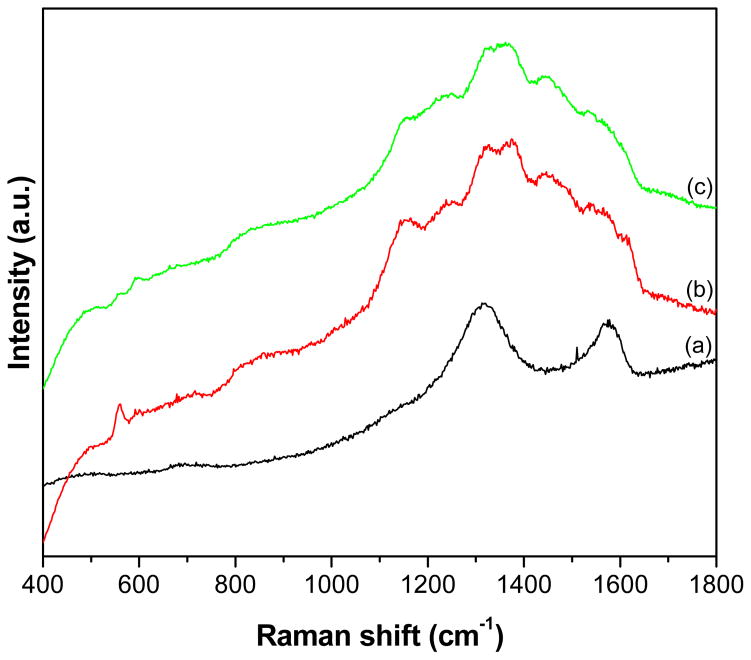
The Raman spectra of the GR, PANI and GR-PANI nanocomposite are shown in Fig. 6. The spectrum of GR (the GR was obtained by the reduction of GO using ethylene diamine through the method explained in Ref. 36) exhibit two bands located at 1318 and 1577 cm−1. They can be are ascribed to so-called D-band (or K-point phonons in the A1g symmetry) and G-band presenting the vibration of sp2 hybridized carbon atoms (the E2g phonons), respectively [14,37]. PANI Raman spectrum possesses the bands centered at 587, 1159, 1261, 1370, 1475, and 1597 cm−1 corresponding to out-of plane of C-N-C torsion, C–H bending of quinoid ring, in-plane ring deformation, C–N stretching of the bipolaron structure, C-C stretching vibration of the benzenoid ring, and N–H bending of the bipolaronic structure, respectively [38]. The spectrum of GR-PANI nanocomposite exhibits all the characteristic bands displayed in the spectra of GR and PANI. In general, the spectrum of GR-PANI nanocomposite is nearly a superposition of the spectra of the individual GR and PANI phases, which indicates presence of both the nanocomposite. In fact, the vibration bands associated with PANI are strongly modified in the spectrum of GR-PANI nanocomposite due to the presence of GR. This indicates the occurrence of a strong interaction between the GR and PANI components. In particular, the band of PANI at 1168 cm−1 is red shifted to 1160 cm−1 owing to the presence of GR. Such shift is usually associated with an increase of the bi-polaron segments contribution within the PANI chains [39]. Additionally, the band at 1255 cm−1 is red shifted to 1218 cm−1, which also proves the existence of a strong interaction between PANI fragments and the GR nanosheets.
Fig. 6.
Raman spectra of GR, PANI and GR-PANI nanocomposite.
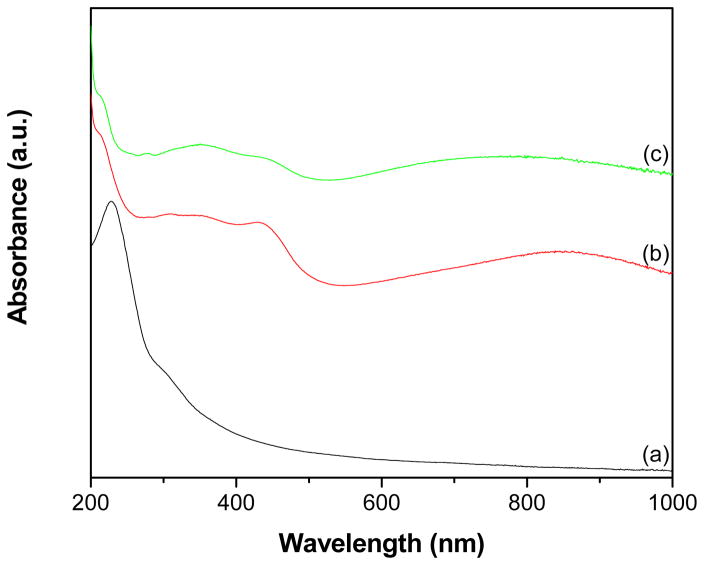
The UV-vis spectrum of GO (Fig. 7a) displays an absorption peak at 229 nm owing to π–π* transitions of the aromatic C-C bonds and a shoulder around 300 nm due to n–π* transitions of the C=O bonds [13]. PANI spectrum (Fig. 7b) shows characteristic peaks at 355, 435 and 870 nm, which correspond to π–π*, π* band to polaron band, and π-band to polaron band transitions of PANI (emeraldine salt), respectively [40–42]. The GR-PANI nanocomposite (Fig. 7c) has all the above bands of the PANI component present in the UV-vis spectrum (Fig. 7b). In addition, a weak peak at 277 nm corresponding to π–π* transitions of the aromatic C-C bonds in GR can be clearly seen. The absorption peak of GO at 229 nm (Fig. 7a) is red shifted to 277 nm in the GR-PANI nanocomposite (Fig. 7c). This observation is consistent with the absorption of aqueous dispersion of stable GR nanosheets and suggests that the electronic conjugation within the GR nanosheets has been restored after reduction from GO to GR in the GR-PANI nanocomposite [13,43].
Fig. 7.
UV-vis absorption spectra of (a) GO, (b) PANI and (c) GR-PANI nanocomposite.
Photoluminescence spectroscopy can be used to evaluate the separation efficiency of the photogenerated electron-hole pairs. The PL emission spectra of GR, PANI and GR-PANI nanocomposite have been obtained with the excitation at 350 nm and are shown in Fig. S1. The PANI displays the emission band at 417 nm in a blue region due to benzenoid/amine groups of the oxidized/reduced PANI [14]. This characteristic band of PANI is exhibited also in the GR-PANI nanocomposite at 419 nm. Further, it is observed that the PL intensity of GR-PANI nanocomposite is lower than that of PANI and GR. The reduction in the PL intensity indicates a high separation rate for the photogenerated electron-hole pairs in this material. This observation demonstrates that the GR-PANI nanocomposite is capable to suppress the recombination process of photogenerated charge carriers in an effective manner.
The specific surface area of the samples under study was characterized with N2 adsorption-desorption isotherms (Fig. S2). The isotherms belong to so-called type IV ones according to the IUPAC classification [44]. The observed hysteresis in the adsorption-desorption curves demonstrates that GR-PANI nanocomposite possess a mesoporous structure.
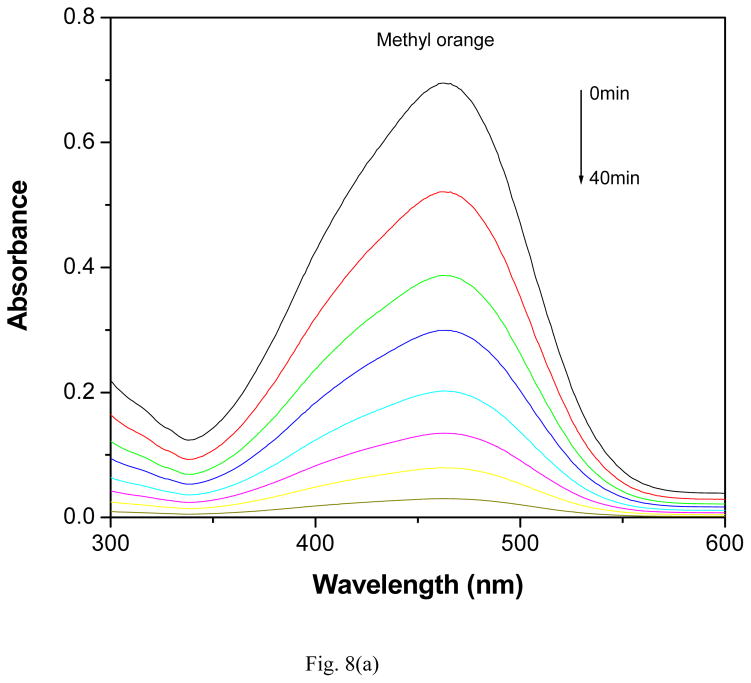
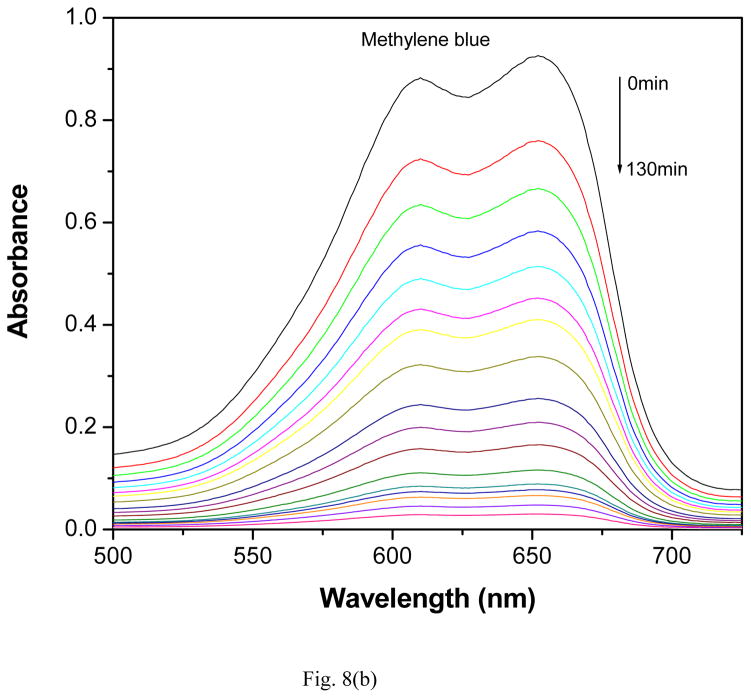
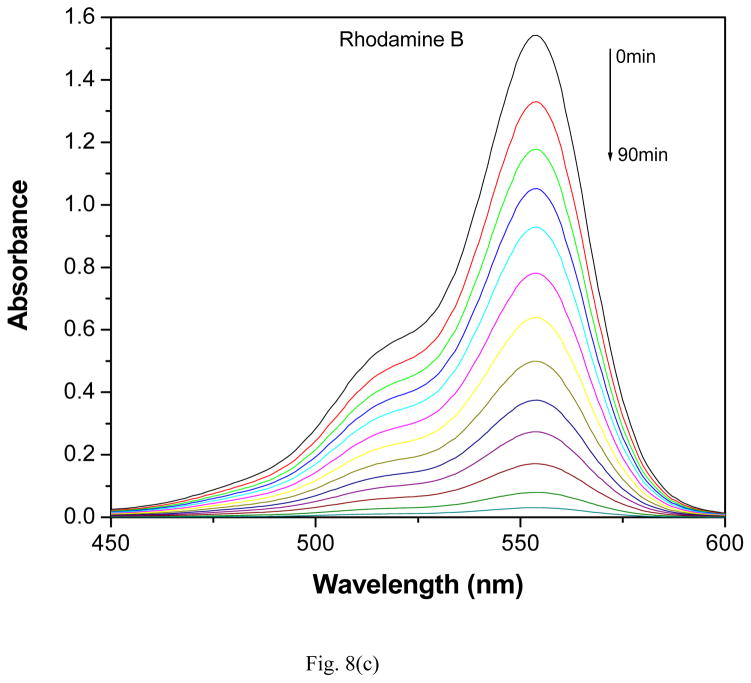
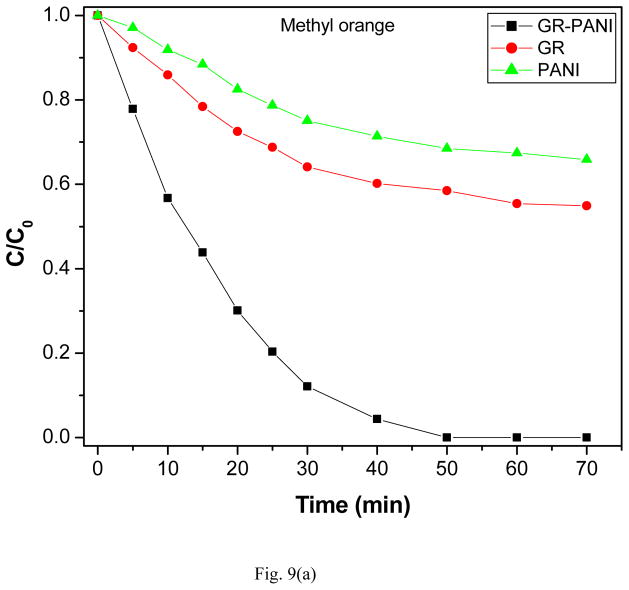
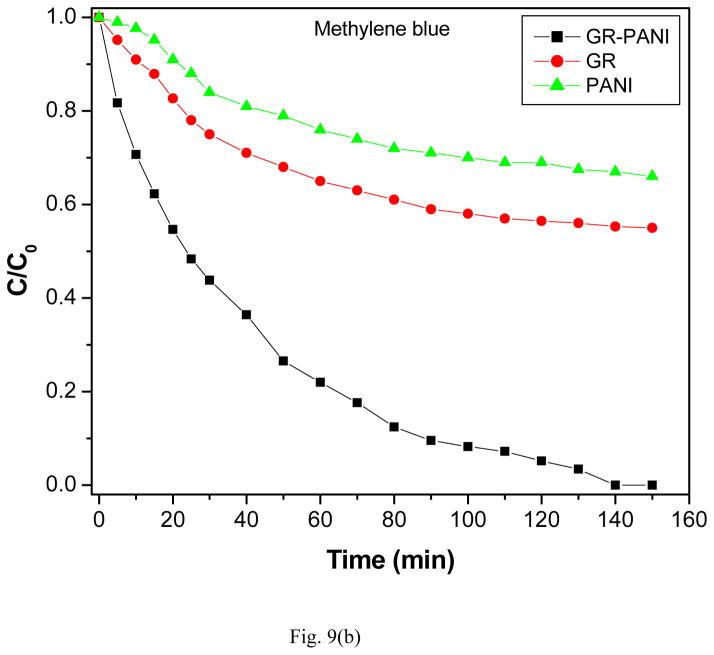
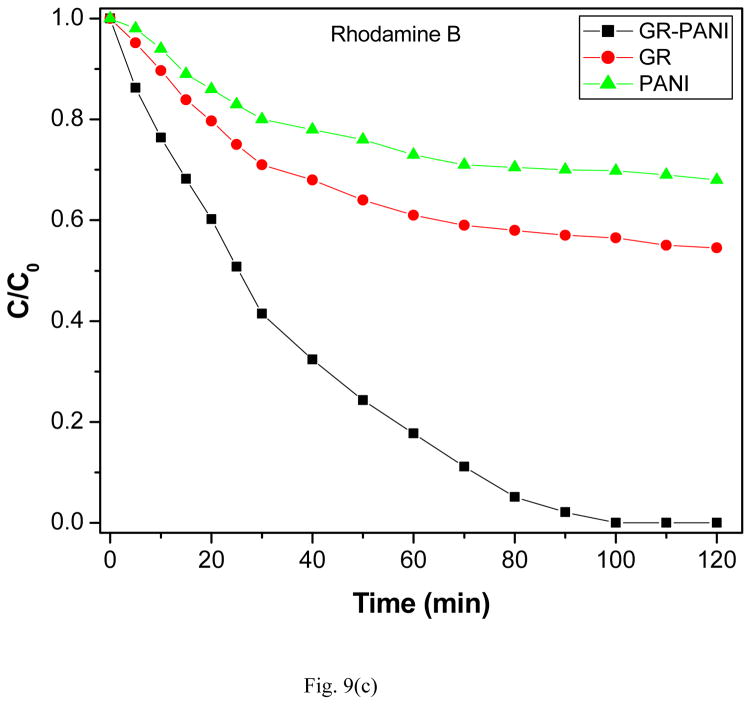
The photocatalytic activity of GR-PANI nanocomposite has been evaluated by the degradation of MO, MB and RhB dyes in water under illumination with natural sunlight. The degradation efficiency of GR-PANI nanocomposite was further compared with the activity of GR and PANI. Figs. 8(a), (b) and (c) show the absorption spectra of the dyes after their partial sunlight decomposition in presence of the GR-PANI nanocomposite. The quantity of dye degraded in presence of GR-PANI nanocomposite has been measured by the relative intensity of a characteristic absorbance maximum in their UV-vis spectra. The reduction in the optical absorption observed in Figs. 8(a)–(c) reveals an effective degradation of MO, MB and RhB over the surface of GR-PANI nanocomposite. Disappearance of the characteristic absorption peaks demonstrates complete degradation of these dyes owing to a significant photocatalytic activity of the GR-PANI nanocomposite. Nowadays the treatment of the azo dyes present in the wastewater remaines a serious technical problem. In consideration of this critical need, we have evaluated the degradation rate of MO, MB and RhB over the surface of the GR-PANI nanocomposite. The temporal evolution of MO, MB and RhB concentration in presence of GR, PANI and GR-PANI nanocomposite is shown in Figs. 9(a)–(c). The degradation of all dyes was negligible in case of the absence of any photocatalyst or when the system with the catalyst was not exposed to light. On the other hand, a complete degradation of MO, MB and RhB dyes occurred in their water solutions in presence of GR-PANI nanocomposite by their exposure to the sunlight for 40, 140 and 100 mins, respectively. Comparative degradation profiles shown in Figs. 9(a)–(c) reveal that the photocatalytic proficiency of GR can be significantly improved by its coupling with PANI. The pH of MO, MB and RhB solutions containing GR-PANI nanocomposite was found to be 7.8, 6.5 and 7.2, respectively after completion of the photolysis. Possible photodegradation reactions of dyes over the surface of the GR-PANI nanocomposite under the sunlight exposure can be expressed as:
Fig. 8.
Reduction in the optical absorption of (a) methyl orange, (b) methylene blue and (c) rhodamine B over the surface of GR-PANI nanocomposite at a different time of the exposure to sunlight.
Fig. 9.
Photocatalytic degradation of (a) methyl orange, (b) methylene blue and (c) rhodamine B over the surface of PANI, GR and GR-PANI nanocomposite.
For better understanding of the photocatalytic activity of the GR-PANI nanocomposite, the kinetics of the degradation process of MO, MB and RhB dyes was analyzed using Langmuir-Hinshelwood (L-H) model, which can be expressed as [45,46],
| (1) |
where (−dC/dt) and C are the degradation rate and concentration of dyes, respectively, t is the reaction or exposure time, kr is the rate constant for the reaction, and Ka is the adsorption coefficient of the reactant. The initial concentration of dyes used in the reported experiments was sufficiently low (C0 = 10 mg/L), so that the KaC term became negligible and the equation (1) could be described with the first-order kinetics. Then, the equation (1) could be modified using the initial conditions of the photocatalytic procedure, viz., t = 0, C = C0 as:
| (2) |
where C0 is the initial concentration of dye, kapp is an apparent rate constant of the reaction and t is the time of the sunlight.
Based on the equation (2), the L-H plots could be constructed for the photodegradation process in the systems, which provided a linear relationship between the dye concentration and irradiation time (Figs. S3–S5). The linearity of the L-H plots revealed that the photodegradation of MO, MB and RhB followed a pseudo-first-order reaction kinetics. Consequently, the apparent rate constants (kapp) evaluated for PANI, GR and GR-PANI nanocomposite are presented in Table 1. For the GR-PANI nanocomposite, the kapp values calculated for MO, MB and RhB have been found to be 0.0259, 0.0717 and 0.0352 min−1, respectively. Overall, a substantial photocatalytic activity enhancement was found in the GR-PANI nanocomposite compared to pristine PANI and GR. The excellent photocatalytic activity observed for GR-PANI nanocomposites has been accounted to a heterojunction formed by strongly interacting GR and PANI phases. This strong conjugation between the components radically enhances the rate of photodegradation for the pollutants adsorbed on the surface of the GR-PANI nanocomposite.
Table 1.
Apparent rate constants calculated by Langmuir-Hinshelwood (L-H) plots.
| Apparent rate constant, kapp (min−1) | |||
|---|---|---|---|
| Methylene blue | Methyl orange | Rhodamine-B | |
|
| |||
| GR-PANI nanocomposite | 0.0259 | 0.0717 | 0.0352 |
| GR | 0.0051 | 0.0107 | 0.0064 |
| PANI | 0.0033 | 0.0072 | 0.0041 |
When considering the degradation process in MO, MB and RhB dyes, a considerable catalytic activity of the catalyst was found in case of MO in comparison to other dye molecules. MO is an anionic dye and, hence, there is a strong electrostatic attraction between negatively charged MO molecules and positively charged moieties of the PANI. This electrostatic interaction is acting as a driving force promoting adsorption of the molecules at the surface of the GR-PANI nanocomposite [10,47]. In contrast, an electrostatic repulsion between the cationic dyes (MB and RhB) and positively charged sites of the PANI can be expected, which restricts the adsorption of these dye molecules on the catalyst surface. Intense characteristic colors of the MO, MB and RhB dyes originate from their conjugated structures constituted with aromatic, carbonyl, and azo groups. Hence, degradation of these dyes occurs through a successful breakage of their conjugation system in a presence of the GR-PANI nanocomposite.
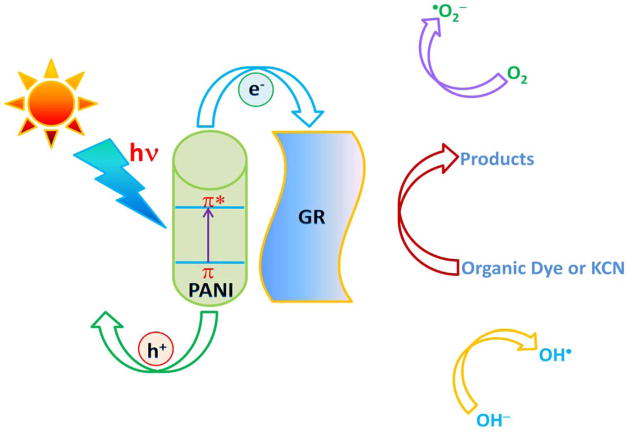
It is known that the GR behaves as an electron acceptor and transporter owing to its two-dimensional π-conjugation structure [48,49]. In the GR-PANI nanocomposite photoexcited electrons can be transferred from the LUMO level of PANI to the conductive band of the GR. In this way the GR serves as an acceptor of the photoexcited electrons from PANI and the charge carriers can be rapidly transferred to the two dimensional planar structure of GR. Thus transferred electrons can participate in the redox reaction or can be accumulated within the C–C network of GR without need of any additional electron acceptor [50]. In this fashion, the recombination of photogenerated electrons and holes is effectively suppressed leaving more charge carriers to form reactive species, which promotes the degradation of dyes [13,51]. Based on the above consideration, we can suggest possible mechanism for the synergistic effect between the GR and PANI phases in the GR-PANI nanocomposite leading to efficient degradation of pollutants under the sunlight exposure (Fig. 10).
Fig. 10.
The proposed mechanism for photocatalytic degradation of pollutants over the surface of GR-PANI nanocomposite under illumination with the sunlight.
As we know, while evaluating the practical application of a photocatalyst and developing the heterogeneous photocatalyst for wastewater treatment, its stability and recycling options are also important. In general, the separation and recovery of suspended photocatalysts is difficult, while the synthesized GR-PANI nanocomposite could be successfully recovered after photolysis via a simple centrifugation process. Before its reuse, each time GR-PANI nanocomposite was washed twice with DI water and dried under vacuum. The recycled GR-PANI nanocomposite was able to completely degrade the MO dye during five cycles of test. To identify the stability of the GR-PANI nanocomposite after using it in the photolysis for five cycles, its XRD pattern was recorded and compared with the one obtained before the photolysis (Fig. S6). No significant changes in the XRD pattern have been revealed. Therefore, one can conclude that the structure of the nanocomposite is stable and does not alter during the process of the photolysis. In general, presence of GR in the GR-PANI nanocomposite facilitates the absorption of visible light intensity, significantly enhances the number of surface active sites, and improves its chemical stability.
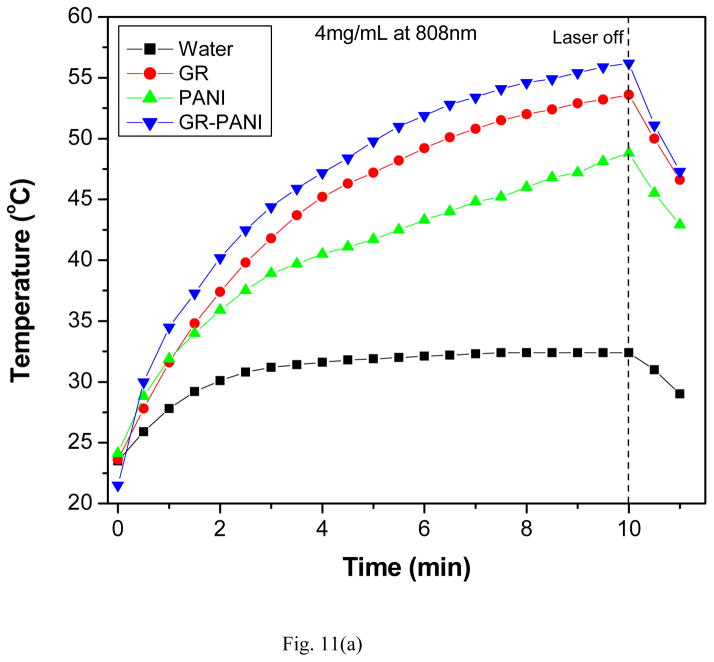
In order to identify the ability of the nanocomposite to absorb infrared radiation and convert it into thermal energy aqueous dispersions of the GR-PANI nanocomposite were exposed to NIR laser source at 808 and 980 nm for 10 and 7 minute, respectively. Temperature variation in the dispersions was monitored for several concentrations (1, 2 and 4 mg/mL) as a function of the illumination time. Further, the PTE response for the GR-PANI nanocomposite was compared with that of GR and PANI. Fig. 11(a) demonstrates temperature variation profiles for 4 mg/mL dispersions of GR, PANI and GR-PANI under 808 nm light exposure. The GR sample showed temperature rise from 23.6 to 53.6 °C, while this change for the PANI sample was a bit smaller (from 24.1 to 48.8 °C) after 10 minutes of an exposure. Under identical conditions, the GR-PANI nanocomposite exhibited temperature rise from 21.5 to 56.2 degrees. Variation of the temperature for a reference DI water sample was significantly lower (from 23.5 to 32.4 °C). Therefore, the absolute temperature rise constituted 30.0, 24.7 and 34.7 °C for GR, PANI and GR-PANI dispersions, respectively, while in pure water it was only 8.9 °C under the same conditions. Similar behavior was observed at lower concentrations of the nanoparticles in water viz., 1 and 2 mg/mL (Figs. S7 and S8).
Fig. 11.
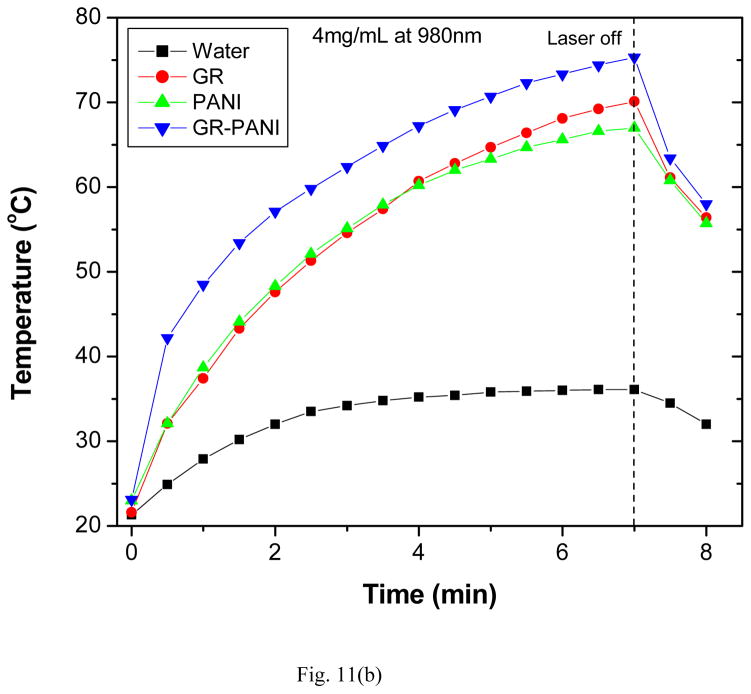
Temperature variation of aqueous dispersions (4 mg/mL) as a function of irradiation time with (a) 808 nm and (b) 980 nm NIR lasers.
In addition, the PTE behavior of GR, PANI and GR-PANI nanocomposites was evaluated by exposing them to 980 nm laser radiation for 7 minutes (Fig. 11b). At the same concentration of 4 mg/mL, the GR dispersion demonstrated temperature rise from 21.6 to 70.1°C, while it was from 23.0 to 67.0 degrees and from 23.1 to 75.3 degrees, for the PANI and GR-PANI dispersions, respectively. Hence, the maximal temperature rise of 52.2 °C was observed for the GR-PANI nanocomposite followed by 48.5 and 44.0 degrees temperature variation in GR and PANI dispersions, respectively. Under the same conditions only 14.8°C elevation of the pure water temperature was recorded. Similar behavior was observed at lower nanoparticle concentrations in the system (1 and 2 mg/mL) (Figs. S9 and S10).
The reported here PTE results demonstrate a perfect anchoring between the GR and PANI phases, which enables notable enhancement in the photothermal efficiency in the GR-PANI nanocomposite. Interestingly, more prominent PTE effect has been observed under the 980 nm laser radiation in comparison to a higher energy 808 nm laser beam (Fig. S11). These results indicated that the GR-PANI nanocomposite could absorb and convert NIR light to a substantial amount of heat energy in a concentration dependent manner (Figs. S12 and S13). To explore photostability of the GR-PANI nanocomposite, we measured its absorption spectrum before and after the exposure to 980 nm laser. No significant changes in the spectra were observed (Fig. S14) indicating an excellent photostabiltiy of the material.
In order to understand the underlying mechanism of the observed catalytic activity and of the PTE phenomenon in the system, we have tested in plane of the film electrical conductivity of the nanocomposites using a two-electrode scheme [52]. The I–V curves recorded for GR, PANI and GR-PANI nanocomposite are shown in Fig. S15. A linear (GR) and quasi-linear (PANI and GR-PANI nanocomposite) current response to the applied voltage has been observed. As estimated from the I–V curves, PANI has a relatively low DC conductivity of 6×10⁻⁵ S cm−1, which is similar to the value reported in the literature [27,53]. GR exhibits much higher conductivity value of 2×10⁻³ S cm−1. This value is however lower than reported in literature for GR [54] and pristine graphite [55], which might be due to a particulate nature of GR and high contact resistance between nanoparticles in solution cast films used for electrical measurements. GR-PANI nanocomposites are characterized with the electrical conductivity of 1×10⁻⁴ S cm−1, which lies in between the values of PANI and GR. The measured conductivity for GR-PANI nanocomposite demonstrates that the conductivity of PANI has been increased about 2 times by its conjugation with the GR nanosheets. It can be speculated that the enhanced electrical conductivity of the PANI shell is a result of either chemical doping with processing reagents or electrical doping due the vicinity of the GR-PANI interface.
4. Conclusions
In summary, a novel acid-less method has been developed for the preparation of PANI nanotubes and their uniform deposition over the surface of GR nanosheets. This procedure enables in-situ reduction of GO to GR in addition to a synchronized polymerization of the aniline. The introduction of a PANI shell on the surface of GR nanosheets resulted in the GR-PANI nanocomposite, which is a promising solar energy driven photocatalyst for degradation of industrially versatile harmful dyes, such as MO, MB and RhB. The synergistic effect between PANI nanotubes and GR nanosheets results in a suppression of the photogenerated electron-hole pairs recombination and enables more efficient photocatalytic action. Combination of the PANI nanotubes with GR nanosheets facilitates the absorption of solar light intensity in a broader range, dramatically increases the number of surface active sites, and improves chemical stability of the GR-PANI nanocomposites. Overall, the reported GR-PANI nanocomposite is an efficient reusable photocatalyst suitable for the removal of harmful pollutants from industrially generated waste water. Moreover, the developed GR-PANI nanocomposite has a strong absorption ability and can produce a substantial amount of heat under NIR laser irradiation, which makes it a promising candidate for some medical applications like photothermal therapy and photoacoustic imaging.
Supplementary Material
Research Highlights.
Novel acid-less approach for preparation of GR-PANI nanocomposite.
GR-PANI nanocomposite is an efficient sunlight driven photocatalyst.
GR-PANI nanocomposite has removed the harmful dyes completely.
It is a recyclable photocatalyst and able to use for multiple times.
GR-PANI nanocomposite is an excellent candidate of PTE.
Acknowledgments
G.M. Neelgund and A. Oki acknowledge the support from NIH-NIGMS grant #1SC3GM086245 and the Welch foundation.
Footnotes
Publisher's Disclaimer: This is a PDF file of an unedited manuscript that has been accepted for publication. As a service to our customers we are providing this early version of the manuscript. The manuscript will undergo copyediting, typesetting, and review of the resulting proof before it is published in its final citable form. Please note that during the production process errors may be discovered which could affect the content, and all legal disclaimers that apply to the journal pertain.
References
- 1.Zhao D, Sheng G, Chen C, Wang X. Enhanced photocatalytic degradation of methylene blue under visible irradiation on graphene@TiO2 dyade structure. Appl Catal B: Environ. 2012;111–112:303–308. [Google Scholar]
- 2.Zhang S, Li J, Zeng M, Zhao G, Xu J, Hu W, Wang X. In Situ Synthesis of water-soluble magnetic graphitic carbon nitride photocatalyst and its synergistic catalytic performance. ACS Appl Mater Interfaces. 2013;5:12735–12743. doi: 10.1021/am404123z. [DOI] [PubMed] [Google Scholar]
- 3.Zhang S, Li J, Wang X, Huang Y, Zeng M, Xu J. In situ ion exchange synthesis of strongly coupled Ag@AgCl/g-C3N4 porous nanosheets as plasmonic photocatalyst for highly efficient visible-light photocatalysis. ACS Appl Mater Interfaces. 2014;6:22116–22125. doi: 10.1021/am505528c. [DOI] [PubMed] [Google Scholar]
- 4.Zhang S, Li J, Zeng M, Li J, Xu J, Wang X. Bandgap engineering and mechanism study of nonmetal and metal ion codoped carbon nitride: C+Fe as an example. Chem Eur J. 2014;20:9805–9812. doi: 10.1002/chem.201400060. [DOI] [PubMed] [Google Scholar]
- 5.Zhang S, Li J, Wang X, Huang Y, Zeng M, Xu J. Rationally designed 1D Ag@AgVO3 nanowire/graphene/protonated g-C3N4 nanosheet heterojunctions for enhanced photocatalysis via electrostatic self-assembly and photochemical reduction methods. J Mater Chem A. 2015;3:10119–10126. [Google Scholar]
- 6.Abe R. Recent Progress on Photocatalytic and Photoelectrochemical Water Splitting Under Visible Light Irradiation. J Photochem Photobiol C. 2010;11:179–209. [Google Scholar]
- 7.Bu Y, Chen Z. Role of Polyaniline on the Photocatalytic Degradation and Stability Performance of the Polyaniline/Silver/Silver Phosphate Composite under Visible Light. ACS Appl Mater Interfaces. 2014;6:17589–17598. doi: 10.1021/am503578s. [DOI] [PubMed] [Google Scholar]
- 8.Radoiici M, Saponji Z, Jankovi IA, Ciric-Marjanovi G, Ahrenkiel SP, Comor MI. Improvements to the Photocatalytic Efficiency of Polyaniline Modified TiO2 Nanoparticles. Appl Catal B: Environ. 2013;136:133–139. [Google Scholar]
- 9.Shaheen SE, Brabec CJ, Sariciftci NS, Padinger F, Fromherz T, Hummelen JC. 2.5% Efficient Organic Plastic Solar Cells. Appl Phys Lett. 2001;78:841–843. [Google Scholar]
- 10.Zhang S, Zhao L, Zeng M, Li J, Xu J, Wang X. Hierarchical Nanocomposites of Polyaniline Nanorods Arrays on Graphitic Carbon Nitride Sheets with Synergistic Effect for Photocatalysis. Catal Today. 2014;224:114–121. [Google Scholar]
- 11.Shirota Y, Kageyama H. Charge Carrier Transporting Molecular Materials and Their Applications in Devices. Chem Rev. 2007;107:953–1010. doi: 10.1021/cr050143+. [DOI] [PubMed] [Google Scholar]
- 12.Qian W, Alex Greaney P, Fowler S, Chiu S, Goforth AM, Jiao JJ. Low-Temperature Nitrogen Doping in Ammonia Solution for Production of N-Doped TiO2-Hybridized Graphene as a Highly Efficient Photocatalyst for Water Treatment. ACS Sustainable Chem Eng. 2014;2:1802–1810. [Google Scholar]
- 13.Neelgund GM, Oki A, Luo Z. ZnO and Cobalt Phthalocyanine Hybridized Graphene: Efficient Photocatalysts for Degradation of Rhodamine B. J Colloid Interface Sci. 2014;430:257–264. doi: 10.1016/j.jcis.2014.04.053. [DOI] [PMC free article] [PubMed] [Google Scholar]
- 14.Ameen S, Seo H, Akhtar MS, Shin HS. Novel Graphene/Polyaniline Nanocomposites and Its Photocatalytic Activity Toward the Degradation of Rose Bengal Dye. Chem Eng J. 2012;210:220–228. [Google Scholar]
- 15.Kamat PV. Graphene-Based Nanoassemblies for Energy Conversion. J Phys Chem Lett. 2011;2:242–251. [Google Scholar]
- 16.Lightcap IV, Kosel TH, Kamat PV. Anchoring Semiconductor and Metal Nanoparticles on a Two-Dimensional Catalyst Mat. Storing and Shuttling Electrons with Reduced Graphene Oxide. Nano Lett. 2010;10:577–583. doi: 10.1021/nl9035109. [DOI] [PubMed] [Google Scholar]
- 17.Bell NJ, Ng YH, Du AJ, Coster H, Smith SC, Amal R. Understanding the Enhancement in Photoelectrochemical Properties of Photocatalytically Prepared TiO2-Reduced Graphene Oxide Composite. J Phys Chem C. 2011;115:6004–6009. [Google Scholar]
- 18.Du J, Lai XY, Yang NL, Zhai J, Kisailus D, Su FB, Wang D, Jiang L. Hierarchically Ordered Macro-Mesoporous TiO2-Graphene Composite Films: Improved Mass Transfer, Reduced Charge Recombination, and Their Enhanced Photocatalytic Activities. ACS Nano. 2011;5:590–596. doi: 10.1021/nn102767d. [DOI] [PubMed] [Google Scholar]
- 19.Zhang H, Lv XJ, Li YM, Wang Y, Li JH. P25-Graphene Composite as a High Performance Photocatalyst. ACS Nano. 2010;4:380–386. doi: 10.1021/nn901221k. [DOI] [PubMed] [Google Scholar]
- 20.Zhang YH, Tang ZR, Fu XZ, Xu YJ. TiO2-Graphene Nanocomposites for Gas-Phase Photocatalytic Degradation of Volatile Aromatic Pollutant: Is TiO2-Graphene Truly Different from Other TiO2-Carbon Composite Materials? ACS Nano. 2010;4:7303–7314. doi: 10.1021/nn1024219. [DOI] [PubMed] [Google Scholar]
- 21.Sharker SM, Lee JE, Kim SH, Jeong JH, In I, Lee H, Park SY. pH Triggered in vivo Photothermal Therapy and Fluorescence Nanoplatform of Cancer Based on Responsive Polymer-Indocyanine Green Integrated Reduced Graphene Oxide. Biomaterials. 2015;61:229–238. doi: 10.1016/j.biomaterials.2015.05.040. [DOI] [PubMed] [Google Scholar]
- 22.Kim YK, Na HK, Kim S, Jang H, Chang SJ, Mi DH. One-Pot Synthesis of Multifunctional Au@Graphene Oxide Nanocolloid Core@Shell Nanoparticles for Raman Bioimaging, Photothermal, and Photodynamic Therapy. Small. 2015;11:2527–2535. doi: 10.1002/smll.201402269. [DOI] [PubMed] [Google Scholar]
- 23.Chang G, Wang Y, Gong B, Xiao Y, Chen Y, Wang S, Li S, Huang F, Shen Y, Xie A. Reduced Graphene Oxide/Amaranth Extract/AuNPs Composite Hydrogel on Tumor Cells as Integrated Platform for Localized and Multiple Synergistic Therapy. ACS Appl Mater Interfaces. 2015;7:11246–11256. doi: 10.1021/acsami.5b03907. [DOI] [PubMed] [Google Scholar]
- 24.Yang L, Tseng YT, Suo G, Chen L, Yu J, Chiu WJ, Huang CC, Lin CH. Photothermal Therapeutic Response of Cancer Cells to Aptamer-Gold Nanoparticle-Hybridized Graphene Oxide under NIR Illumination. ACS Appl Mater Interfaces. 2015;7:5097–5106. doi: 10.1021/am508117e. [DOI] [PubMed] [Google Scholar]
- 25.Hummers WS, Offeman RE. Preparation of Graphitic Oxide. J Am Chem Soc. 1958;80:1339. [Google Scholar]
- 26.Neelgund GM, Bliznyuk VN, Pud AA, Fatyeyeva KY, Hrehorova E, Joyce M. Formation of Nanostructured Composites With Environmentally-Dependent Electrical Properties Based on Poly(vinylidene fluoride)-Polyaniline Core-Shell Latex System. Polymer. 2010;51:2000–2006. [Google Scholar]
- 27.Bliznyuk VN, Baig A, Singamaneni S, Pud AA, Fatyeyeva KY, Shapoval GS. Effects of Surface and Volume Modification of Poly(vinylidene fluoride) By Polyaniline On the Structure and Electrical Properties of Their Composites. Polymer. 2005;46:11728–11736. [Google Scholar]
- 28.Neelgund GM, Oki A. A Facile Method for the Synthesis of Polyaniline Nanospheres and the Effect of Doping on Their Electrical Conductivity. Polym Int. 2011;60:1291–1295. doi: 10.1002/pi.3068. [DOI] [PMC free article] [PubMed] [Google Scholar]
- 29.Neelgund GM, Hrehorova E, Joyce M, Bliznyuk V. Synthesis and Characterization of Polyaniline Derivative and Silver Nanoparticle Composites. Polym Int. 2008;57:1083–1089. [Google Scholar]
- 30.Li Y, Peng H, Li G, Chen K. Synthesis and Electrochemical Performance of Sandwich-Like Polyaniline/Graphene Composite Nanosheets. Eur Polym J. 2012;48:1406–1412. [Google Scholar]
- 31.Li G, Jiang L, Peng H. One-Dimensional Polyaniline Nanostructures with Controllable Surfaces and Diameters Using Vanadic Acid as the Oxidant. Macromolecules. 2007;40:7890–7894. [Google Scholar]
- 32.Yan Y, Deng K, Yu Z, Wei Z. Tuning the Supramolecular Chirality of Polyaniline by Methyl Substitution. Angew Chem Int Ed. 2009;48:2003–2006. doi: 10.1002/anie.200805824. [DOI] [PubMed] [Google Scholar]
- 33.Goswami S, Maiti UN, Maiti S, Nandy S, Mitra MK, Chattopadhyay KK. Preparation of Graphene-Polyaniline Composites by Simple Chemical Procedure and Its Improved Field Emission Properties. Carbon. 2011;49:2245–2252. [Google Scholar]
- 34.Wang G, Zhuo S, Xing W. Graphene/Polyaniline Nanocomposite as Counter Electrode of Dye-Sensitized Solar Cells. Mater Lett. 2012;69:27–29. [Google Scholar]
- 35.Liu L, Yang J, Jiang Y, Huang Y, Meng Q. The Structure Characteristic and Electrochemical Performance of Graphene/Polyaniline Composites. Synth Met. 2013;170:57–62. [Google Scholar]
- 36.Neelgund GM, Oki A, Luo Z. In situ Deposition of Hydroxyapatite on Graphene Nanosheets. Mater Res Bull. 2013;48:175–179. doi: 10.1016/j.materresbull.2012.08.077. [DOI] [PMC free article] [PubMed] [Google Scholar]
- 37.Cancado LG, Pimenta MA, Neves BRA, Dantas MSS, Jorio A. Influence of the Atomic Structure on the Raman Spectra of Graphite Edges. Phys Rev Lett. 2004;93:247401–247405. doi: 10.1103/PhysRevLett.93.247401. [DOI] [PubMed] [Google Scholar]
- 38.Luo J, Jiang S, Wu Y, Chen M, Liu X. Synthesis of Stable Aqueous Dispersion of Graphene/Polyaniline Composite Mediated by Polystyrene Sulfonic Acid. J Polym Sci Part A: Polym Chem. 2012;50:4888–4894. [Google Scholar]
- 39.Domingues SH, Salvatierra RV, Oliveira MM, Zarbin AJ. Transparent and Conductive Thin Films of Graphene/Polyaniline Nanocomposites Prepared Through Interfacial Polymerization. Chem Commun. 2011;47:2592–2594. doi: 10.1039/c0cc04304d. [DOI] [PubMed] [Google Scholar]
- 40.Xia Y, Wiesinger JM, MacDiarmid AG, Epstein AJ. Camphor sulfonic Acid Fully Doped Polyaniline Emeraldine Salt: Conformations in Different Solvents Studied by an Ultraviolet/Visible/Near-Infrared Spectroscopic Method. Chem Mater. 1995;7:443–445. [Google Scholar]
- 41.Ruokolainen J, Eerikainen H, Torkkeli M, Serimaa R, Jussila M, Ikkala O. Comb-Shaped Supramolecules of Emeraldine Base Form of Polyaniline Due to Coordination with Zinc Dodecyl Benzenesulfonate and Their Plasticized Self-Organized Structures. Macromolecules. 2000;33:9272–9276. [Google Scholar]
- 42.Chatterjee S, Layek RK, Nandi AK. Changing the Morphology of Polyaniline from a Nanotube to a Flat Rectangular Nanopipe by Polymerizing in the Presence of Amino-Functionalized Reduced Graphene Oxide and Its Resulting Increase in Photocurrent. Carbon. 2013;52:509–519. [Google Scholar]
- 43.Li D, Mueller MB, Gilje S, Kaner RB, Wallace GG. Processable Aqueous Dispersions of Graphene Nanosheets. Nat Nanotechnol. 2008;3:101–105. doi: 10.1038/nnano.2007.451. [DOI] [PubMed] [Google Scholar]
- 44.Guo N, Liang Y, Lan S, Liu L, Zhang J, Ji G, Gan S. Microscale hierarchical three-dimensional flowerlike TiO2/PANI composite: synthesis, characterization, and its remarkable photocatalytic activity on organic dyes under UV-light and sunlight irradiation. J Phys Chem C. 2014;118:18343–18355. [Google Scholar]
- 45.Uddin MT, Nicolas Y, Olivier C, Toupance T, Servant L, Müller MM, Kleebe HJ, Ziegler J, Jaegermann W. Nanostructured SnO2–ZnO Heterojunction Photocatalysts Showing Enhanced Photocatalytic Activity for the Degradation of Organic Dyes. Inorg Chem. 2012;51:7764–7773. doi: 10.1021/ic300794j. [DOI] [PubMed] [Google Scholar]
- 46.Neelgund GM, Oki A. Photocatalytic activity of CdS and Ag2S quantumdots deposited on poly(amidoamine) functionalized carbon nanotubes. Appl Catal B: Environ. 2011;110:99–107. doi: 10.1016/j.apcatb.2011.08.031. [DOI] [PMC free article] [PubMed] [Google Scholar]
- 47.Mahanta D, Madras G, Radhakrishnan S, Patil S. Adsorption and Desorption Kinetics of Anionic Dyes on Doped Polyaniline. J Phys Chem B. 2009;113:2293–2299. doi: 10.1021/jp809796e. [DOI] [PubMed] [Google Scholar]
- 48.Wang J, Tsuzuki T, Tang B, Hou X, Sun L, Wang X. Reduced Graphene Oxide/ZnO Composite: Reusable Adsorbent for Pollutant Management. ACS Appl Mater Interf. 2012;4:3084–3090. doi: 10.1021/am300445f. [DOI] [PubMed] [Google Scholar]
- 49.Zhu C, Guo S, Wang P, Xing L, Fang Y, Zhai Y, Dong S. Water-Phase Approach to High-Quality Graphene/TiO2 Composite Nanosheets. Chem Commun. 2010;46:7148–7150. doi: 10.1039/c0cc01459a. [DOI] [PubMed] [Google Scholar]
- 50.Zhang H, Guo L, Wang D, Zhao L, Wan B. Light-Induced Efficient Molecular Oxygen Activation on a Cu(II)-Grafted TiO2/Graphene Photocatalyst for Phenol Degradation. ACS Appl Mater Interfaces. 2015;7:1816–1823. doi: 10.1021/am507483q. [DOI] [PubMed] [Google Scholar]
- 51.Zhang H, Lv X, Li Y, Wang Y, Li J. P25-Graphene Composite as a High Performance Photocatalyst. ACS Nano. 2010;4:380–386. doi: 10.1021/nn901221k. [DOI] [PubMed] [Google Scholar]
- 52.Nabok A. Organic and Inorganic Nanostructures. Artech House; Norwood, MA: 2005. p. 133. [Google Scholar]
- 53.Wojkiewicz JL, Bliznyuk VN, Carquigny S, Elkamchi N, Redon N, Lasri T, Pud AA, Reynaud S. Nanostructured Polyaniline-Based Composites for ppb Range Ammonia Sensing. Sens Act B: Chem. 2011;160:1394–1403. [Google Scholar]
- 54.Zhang K, Zhang LL, Zhao XS, Wu J. Graphene/Polyaniline Nanofiber Composites as Supercapacitor Electrodes. Chem Mater. 2010;22:1392–1401. [Google Scholar]
- 55.Stoller MD, Park S, Zhu Y, An J, Ruoff RS. Graphene-Based Ultracapacitors. Nano Lett. 2008;8:3498–3502. doi: 10.1021/nl802558y. [DOI] [PubMed] [Google Scholar]
Associated Data
This section collects any data citations, data availability statements, or supplementary materials included in this article.


