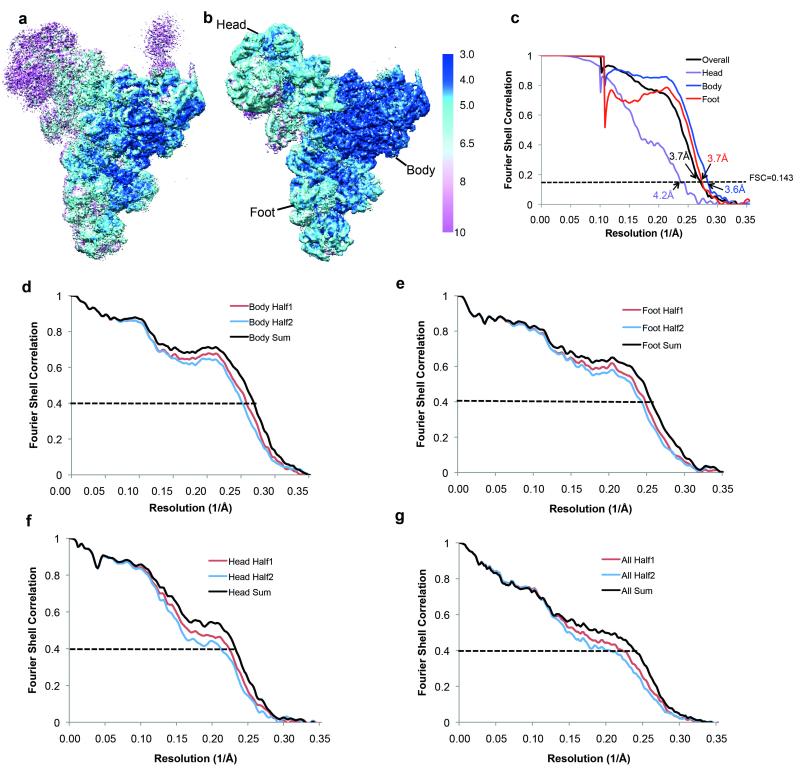
Extended Data Figure 2. Local and overall resolutions of tri-snRNP maps.
Local resolution estimation by Resmap55 of a, the overall 3.7 Å map and b, maps of thehead, body and foot domains obtained from masked refinements with signal subtraction23. c, Gold-standard FSC curves for the overall map and the maps of the head, body and foot domains obtained from masked refinements. Their resolutions are estimated at FSC=0.143. d, e, f and g FSC curves of model versus map and cross-validation of model refinement by half-maps for the Body, Foot, Head and Overall maps, respectively. The red curves show FSC between the atomic model and the half-map it was refined against (half1) and the blue curves show FSC between the atomic model and the other half-map (half2) it was not refined against. The black curves show FSC between the atomic model and the sum map which the model was refined against.

