

Abstract
Alzheimer's disease (AD) is characterized by plaques of amyloid–beta (Aβ) peptide, cleaved from amyloid–β precursor protein (AβPP). Our hypothesis is that lifespan profiles of AD-associated mRNA and protein levels in monkeys would differ from mice, and that differential lifespan expression profiles would be useful to understand human AD pathogenesis. We compared profiles of AβPP mRNA, AβPP protein, and Aβ levels in rodents and primates. We also tracked a transcriptional regulator of the AβPP gene, specificity protein 1 (SP1), and the β amyloid precursor cleaving enzyme (BACE1). In mice, AβPP and Sp1 mRNA and their protein products were elevated late in life; Aβ levels declined in old age. In monkeys, Sp1, AβPP, and BACE1 mRNA declined in old age, while protein products and Aβ levels rose. Proteolytic processing in both species did not match production of Aβ. In primates, AβPP and Sp1 mRNA levels coordinate, but an inverse relationship exists with corresponding protein products, as well as Aβ levels. Comparison of human DNA and mRNA sequences to monkey and mouse counterparts revealed structural features that may explain differences in transcriptional and translational processing. These findings are important for selecting appropriate models for AD and other age–related diseases.
Keywords: AβPP, amyloidogenesis, BACE1, development, primates, rodents, SP1, transcription
Introduction
Alzheimer's disease (AD) is a progressive, irreversible neurodegenerative disorder resulting in memory loss, dementia, and death. It is characterized by senile plaques composed of aggregated amyloid–beta (Aβ), neurofibrillary tangles, and synaptic loss in the brain [1-6]. Autosomally inherited AD can be caused by mutations in the amyloid–β precursor protein (AβPP) and presenilin 1 (PSEN1) genes. However, this accounts for no more than 10% of cases [6]. In over 90% of cases, patients have “sporadic” AD not characterized by autosomal inheritance. The APOE ε4 allele [7, 8] the only confirmed genetic risk factor for sporadic AD, accounts for a minority of the disorder [9], and the etiology of most sporadic AD cases remains unknown.
The accumulation of amyloidogenic Aβ peptides from cleavage of AβPP has been studied extensively. Human AβPP and/or PS–1 transgenic rodent animal models [10-14] are widely used to study molecular and biological processes underlying AD pathogenesis. While these animal models demonstrate AD–like pathologies and behavioral changes compared to wild–type animals, they carry mutant forms of AD–related genes, driven by promoters other than those of the respective genes. Thus, AβPP is over-expressed and processed to speed up AD pathogenesis in a manner that may not be clinically relevant. Transgenic human AβPP in these rodents is cleaved by intrinsic β–secretase (BACE1) to produce Aβ. The preferred cleavage site by rodent BACE1 in human AβPP is different from that by which human BACE1 cleaves AβPP.
Although rodents and primates share more than 95% amino acid sequence homology in their respective AβPP proteins [15], the amyloid products from the two differ. Murid rodents do not aggregate Aβ peptides and, therefore, are non plaque–forming, but primates are human–like in their ability for Aβ aggregation to form senile plaques. The Aβ peptide sequence from primates and murid rodents differ in three amino acids at residues 5 (R→G), 10 (Y→F) and 13 (H→R). However, the primary sequence difference may not explain plaque–forming or non plaque–forming nature of the peptides, since in vitro experiments [16, 17] indicate that either peptide could aggregate. A difference has been noted in the 5′–untranslated region of the mRNA of non–plaque–forming vs. plaque–forming mammalian species, specifically, the absence of a “CAGA” box in non–plaque–forming species mRNA [18]. However, differences in processing of AβPP or Aβ metabolism in vivo may, likewise, determine amyloidogenesis. This is especially true if physiologic manifestations of aging are considered, and this paper seeks to address this issue.
The 5′-flanking regulatory region of the AβPP gene is rich in GC box elements and contains consensus sites that are recognized by several transcription factors, including specificity protein 1 (SP1) [19, 20]. SP1 binds to both the human and rat AβPP promoters and accelerates the production of AβPP mRNA [21-23], which can be further spliced to generate several cell-specific species. SP1 belongs to a family of zinc finger protein (ZFP) transcription factors that includes other members such as Sp2, Sp3, and Sp4 [24, 25]. Sp1 is a transcription factor involved in the pathology of AD [26, 27]. Furthermore, SP1 regulates the expression of BACE1 [28], the main form of β-secretase that cleaves AβPP to generate Aβ [29]. Likewise, silencing Sp1 gene dramatically reduces AβPP promoter activity [26]. In addition, SP1 regulates the expression of the microtubule associated protein tau (MAPT) gene [30]. The buildup of hyper-phosphorylated tau protein results in the formation of the pathogenic tangles found in AD and some other neurodegenerative disorders like Pick's disease [27].
AD incidence increases exponentially after 65 years of age, making age the greatest risk factor for AD [31]. It is well known that the most common animal model species for AD (mouse) does not develop any similar conditions, requiring the use of transgenics or drug–induced defects. Monkeys, on the other hand, have shown the spontaneous presence of β–amyloid plaque [32]. and many genes known to be involved in human neurological disorders have been shown to be present and regulated in cynomolgus monkeys [33]. Likewise, administration of a modified version of the Cambridge Automated Neuropsychological Test Battery has determined that aged monkeys reveal patterns of age-related cognitive impairment that mirror in quality and severity those of aged humans [34].
We hypothesize that profiles of gene expression and protein levels of the AD–critical SP1, AβPP, and BACE1 genes, in mice would differ over the lifespan in a non–trivial fashion from those of a species closer to human, specifically cynomolgus monkey. These differences would be qualitative and appear at transcriptional, translational, and protein processing levels of gene expression. Therefore, we examined the pathways of AβPP production, processing, and accumulation of its Aβ cleavage product as a function of age. We compared differences in AD–related gene expression between rodents and primates. Our results suggest fundamental differences between rodents and primates in expression and processing of important AD–related genes and proteins. These differences occur at transcriptional, translational, and post–translation levels, potentially affecting applicability of animal model studies at several stages of understanding AD.
Materials and Methods
Animals and tissues
The C57Bl/6 mice were bred in house at University of Rhode Island. Male pups from different dams were pulled and selected randomly at the time of sacrifice. Brains were dissected at different ages, specifically three mice at each post–natal day (PND) 5, 20, 365, and 630, and brain frontal cortex tissues were stored at −80°C until use. The Cynomolgus monkey brain cortex tissues were obtained from National Institutes of Health (NIH), and were control monkeys from two separate studies [35]. They were kept at the NIH facility until termination at 3–6, 12, and 23 years of age, three animals at each of three timepoints. All animal procedures were conducted under the supervision of a licensed veterinarian according to a National Institute on Environmental Health Sciences–NIH–approved animal protocol. The tissues were kept frozen until use in our study.
Total RNA isolation, synthesis of cDNA, and Real Time PCR
RNA from the brain tissue was isolated according to the TRIzol method (Invitrogen, Carlsbad, CA). The RNA was reverse transcribed to obtain cDNAs, catalyzed by SuperScript III (Invitrogen) reverse transcriptase (RT). The RNA/primer mixture containing 500 ng of total RNA, 1μl of 10mM dNTP mixture, and 1μl Oligo(dT) were incubated at 65°C for 5 min. A reaction mixture containing 2 μl of 10× RT buffer [200 mM Tris–HCl (pH 8.4), 500 mM KCl], 4 μl of 25 mM MgCl2, 2 μl of 0.1 M DTT and 1 μl of RNaseOUT (Invitrogen) recombinant RNase inhibitor (40 U/μl) was added. One microliter of SuperScript III RT (200 U/μl) was then added and incubated at 50°C for 50 min. The reaction was terminated at 85°C for 5 min. One microliter of RNase H was added and the reaction was incubated for 20 min at 37°C. The resulting cDNA was stored at −20°C and used in the real time PCR step. The primer pairs used for mouse AβPP, SP1, and β–actin are described in Table 1. Each real time PCR reaction mix contained 1 μl of cDNA, 1 μl of primer mix (final concentration 200 nM), 10.5 μl of nuclease free water and 12.5 μl SYBR® GREEN PCR Master Mix (Applied Biosystems, CA). Each sample was done in triplicate. Real Time PCR was conducted for all above genes with respective primer pairs in a 7500 Real–Time PCR System following standard protocol. The initial step was 50 °C for 2 min followed by 95 °C for 10 min, then 40 cycles of 95 °C for 15 sec and 60 °C for 1min. Real time PCR products were checked with agarose gel to confirm no non–specific products formed. Results were analyzed with 7500 system software with relative quantification method using β–actin or GAPDH as endogenous controls.
Table 1.
Oligomers for real–time PCR of mouse and monkey mRNA.
| Gene | Organism | Orientation | Sequence | Reference | Location |
|---|---|---|---|---|---|
| AβPP | mouse | sense | 5′–TGC AGC AGA ACG GAT ATG AG–3′ | NM_007471.2 | 2175–2194 |
| AβPP | mouse | antisense | 5′–ACA CCG ATG GGT AGT GAA GC–3′ | NM_007471.2 | 2285–2304 |
| SP1 | mouse | sense | 5′–CCT GAA TGG GAA CAT CAC CT–3′ | NM_013672.2 | 874–893 |
| SP1 | mouse | antisense | 5′–ACC AAG CTG GCA GAA CTG AT–3′ | NM_013672.2 | 1010–1029 |
| β–actin | mouse | sense | 5′–TGT TAC CAA CTG GGA CGA CA–3′ | NM_007393.3 | 304–323 |
| β–actin | mouse | antisense | 5′–TCT CAG CTG TGG TGG TGA AG–3′ | NM_007393.3 | 676–695 |
| AβPP | monkey | sense | 5′–GCT GGC TGA ACC CCA GAT–3′ | M58727.1 | 227–244 |
| AβPP | monkey | antisense | 5′–CCC ACT TCC CAT TCT GGA CAT–3′ | M58727.1 | 280–300 |
| BACE1 | monkey | sense | 5′–TTT GTG GAG ATG GTG GAC AA–3′ | XM_001093566.1a | 624–643 |
| BACE1 | monkey | antisense | 5′–CAG CAC CCA CTG CAA AGT TA–3′ | XM_001093566.1a | 737–756 |
| Sp1 | monkey | sense | 5′–CAA GCC CAA ACA ATC ACC TT–3′ | XM_001104877.1a | 1575–1594b |
| Sp1 | monkey | antisense | 5′–CAA TGG GTG TGA GAG TGG TG–3′ | XM_001104877.1a | 1640–1659b |
| GAPDH | monkey | sense | 5′–TGA AGC AGG CGT CGG AGG G–3′ | DQ464111.1 | 115–133 |
| GAPDH | monkey | antisense | 5′–CGA AGG TGG AAG AGT GGG TG–3′ | DQ464111.1 | 197–216 |
Sequence from rhesus monkey.
A single–base mismatch exists (underlined) between rhesus sequence and oligomer.
Western Blot
Brain tissues were homogenized in RIPA buffer containing protease inhibitor cocktail (Promega), incubated on ice for one hour then centrifuged at 3500 × g for 20 min [26]. The supernatant was collected and used for western blot. Protein concentration was determined by BCA kit (Pierce Biotechnology, Inc. Rockford, IL). A 10 μg of total protein from each sample was applied for western blot. Protein samples were denatured and resolved in 8% SDS–PAGE then transferred to PVDF membrane. The membrane was blocked with 5% non–fat milk in Tris buffered saline (TBS, pH 7.4) for one hour, then 22C11 AβPP N–terminal specific antibody (1:1000) was incubated with 5% milk in TBS overnight at 4°C. For SP1, the membrane was incubated with SP1 (H-225) polyclonal antibody (1:200). The membrane was washed with TBST (TBS + 0.5% Tween–20) 4 times before adding horseradish peroxidase conjugated goat anti–rabbit IgG (1:1000, Pierce). Each membrane was incubated at room temperature for 60 min followed by sequential wash with TBST 4 times and TBS 4 times then developed by Amersham ECL Plus Western Blotting Detection System and exposed with Typhoon 9410 MultiMode Scanner. Signals were normalized to GAPDH or Actin signal of same lanes.
Beta amyloid (Aβ) 1–40 assay
The levels of Aβ were measured with human Aβ 1–40 assay kits (Immuno–Biological Laboratories, Gunma Japan). These kits were designed as solid phase sandwich ELISA with highly specific antibody. The assay conditions were followed according to the method described previously, [36] with slight modifications. Brain tissue was homogenized in Tris–Saline (TS) [50 mM Tris–HCl buffer, pH 7.4; 150 mM NaCl; 1 μg/mL TLCK (N–Alpha–p–tosyl–L–Lysine chloromethyl ketone); 1 μg/mL antipain; 0.5 mM DIFP (Diisopropyl fluorophosphates); 1 mM PMSF; 1 mM NaF; 0.25% sodium deoxycholate; 0.5% SDS; 0.1% Protease Inhibitor cocktail], incubated on ice for one hour, then centrifuged at 3500 g for 20 min at 4°C. The resultant supernatant was collected and diluted by EIA buffer (supplied with the kit) to 1 μg/μl (100 μg of protein in 100 μl EIA buffer) and assay standards were added to a 96 well plate (pre–coated with anti–human Aβ (35–40) (1A10) Mouse IgG monoclonal antibody) and incubated overnight at 4°C. The wells were washed 7 times with EIA buffer. Then 100 μl of labeled antibody was added to each well containing sample or standard and incubated at 4°C for 1 hour. The wells were washed 9 times with EIA buffer followed by the addition of 100 μl of TMB buffer and incubated in the dark for 30 min at room temperature. The reaction was stopped by adding 100 μl of 1N H2SO4 and the colorimetric absorption was taken at 450 nm. The levels of Aβ in the test samples were calculated relative to the standard curve generated on each plate.
BACE1 activity assay
β–secretase activity was conducted with BACE1 activity kit (R&D Systems, Inc. Minneapolis, MN) following manufacturer's protocol with small modifications. The enzymatic reaction for secretase activity was carried out in the black uncoated microplate provided, with controls provided in the kit. Total protein from brain tissue homogenate was diluted to 1 μg/μl with 1X Cell Extraction Buffer. Then 50 μl of protein sample was added to each well. Each sample was run in duplicates for greater accuracy. Next, to each well, 50 μl of 2X Reaction Buffer was added to each well plus 5 μl of substrate at room temperature to each well. Negative controls run were a) no protein sample and b) no substrate. The plate was covered by provided film, tapped gently to mix, and incubated at 37° C for 2 hours in the dark. The plate was read on a fluorescent microplate reader using light filters that allow for wavelength excitation between 335–355 nm and emitted light between 495–510 nm was recorded.
Statistical analysis
Results from mRNA expression, protein or peptide level, and enzymatic activity assays were subject to t–test against “adult” data points, “adult” defined as PND 365 for mice and 12 years age for monkeys. Average values with p < 0.05 vs. their respective “adult” data points were deemed significant.
DNA sequence homology analysis of mouse and monkey Sp1 and AβPP genes vs. human Sp1 and AβPP genes
The NCBI human genome database (build 36.2) was consulted for the reference sequences of the human Sp1 and AβPP genomic sequences. A portion of reference sequence NC_000012 from 52056246 to 52096497 was selected for Sp1 BLAST, and the AβPP reference sequences NG_007376.1 was used for BLAST. Cynomolgus monkey (Macaca fascicularis) genomic sequences were not available; therefore, rhesus monkey (Macaca mulatta) sequences were used. BLAST comparison of the available cynomolgus sequence vs. rhesus sequences showed 99% or greater homology (data not shown) between the two. Each sequence was used to probe the rhesus monkey (build 1.1) and mouse (build 37.1) NCBI reference genome databases. In addition, sequences of 4kb upstream of the +1 transcription start site (TSS) of the Sp1 genes of mouse, rhesus monkey, and human were extracted from their respective NCBI genomic databases, and the monkey and mouse Sp1 sequences were each compared with the human Sp1 sequence via ClustalX [37].
Transcription factor binding site analysis of promoters of Sp1 for human, mouse, and monkey
Sequences 4kb upstream of the +1 TSS of the Sp1 genes of mouse, rhesus monkey, and human were used to search for putative transcription factor binding sites via the MatInspector utility of the Genomatix analysis package [38]. Results for each species were compared, and predicted factor binding sites unique to mouse or shared by monkey and human but absent in mouse were recorded.
Motif analysis of 5′– and 3′–untranslated regions (UTRs) of AβPP for human, mouse, and monkey
The RegRNA database/analysis utility [39] was employed to search the sequences of the human (GenBank Accession #NM_000484), cynomolgus monkey (M58727), and mouse (NM_007471) AβPP mRNA 5′– and 3′–UTRs. For consistency with our previous publications, the +1 transcription start site (TSS) producing a 147bp 5′–UTR [19] was selected for the human AβPP sequence rather than a further–upstream TSS that produces a 194bp 5′–UTR. UTR sequences were searched for conventional regulatory motifs and miRNA homology sites.
Results
Our purpose in comparing AD–associated gene expression between monkeys and mice is to establish comparative non–pathological “baselines” for disease–critical genes and their protein products. We hypothesized that non–trivial, qualitative differences exist between primate and rodent expression in fundamental AD–associated genes at transcriptional, post–transcriptional, and protein processing levels. Profiling of AD–associated gene expression and protein levels in the lifespan of monkeys and mice produces control profiles of animal models, which develop an understanding of “baseline” normal aging effects on transcriptional, translational, and post–translational mechanisms. These baselines then form a basis for evaluating overall model performance in comparison to human aging and pathological processes. The data reported below are the results of measuring AβPP, BACE1 and Sp1 gene expression as well as their protein levels in the brain frontal cortices of wild–type mice and primates. In addition, comparative results of pertinent DNA and mRNA sequences and sub–sequences of the AβPP, BACE1, and Sp1 genes are presented.
AβPP, BACE1, and Sp1 mRNA expression in mice at different ages
The mRNA expression of AβPP and Sp1 was examined by real time PCR at 6 different times within the mouse life span and normalized to β–actin PCR signal, PND 5 through 630. In mice, normalized AβPP mRNA signal increased dramatically from PND 5 to PND 20, remained steady throughout adulthood, and increased again upon aging (Fig. 1A). normalized Sp1 mRNA expression showed the same trend as that of the AβPP mRNA (Fig. 1B); however, normalized BACE1 mRNA did not show any trend with aging (data not shown).
Fig. 1. Lifetime mRNA expression changes in AD related genes (Sp1, AβPP) in the mouse brain cortex.

Relative quantification was measured by using 7500 Real–Time PCR System (Applied Biosystems, CA) with β–actin serving as the endogenous control. A) Relative Sp1 mRNA signal. B) Relative AβPP mRNA signal. Each data point in the curve is the mean + SEM (n=3-4 animals). “*” denotes significant difference for SP1 or AβPP mRNA time point when compared to that of PND 365.
AβPP, SP1, and Aβ1–40 levels in mice at different ages
SP1 and AβPP protein levels were determined by Western blot analysis and normalized to β–actin, and Aβ levels were measured using an ELISA assay (Fig. 2A, 2B, and 2C). Normalized AβPP levels slightly increased during development, remained steady during adulthood, and sharply rose in old age (Fig. 2A). Normalized SP1 levels on the other hand did not change on PND 20 but showed a similar increase in old age (Fig. 2B). Aβ levels on the other hand dropped on PND 20, rose to adult levels by PND 365, but exhibited a sharp decline in old age at PND 630 (Fig. 2C). The profile of the SP1 and AβPP proteins was similar to the pattern of AβPP and Sp1 mRNA expression in old age (Fig. 1 vs. 2).
Fig. 2. Lifetime profile of AD related proteins (AβPP, SP1 Aβ) in the mouse brain.
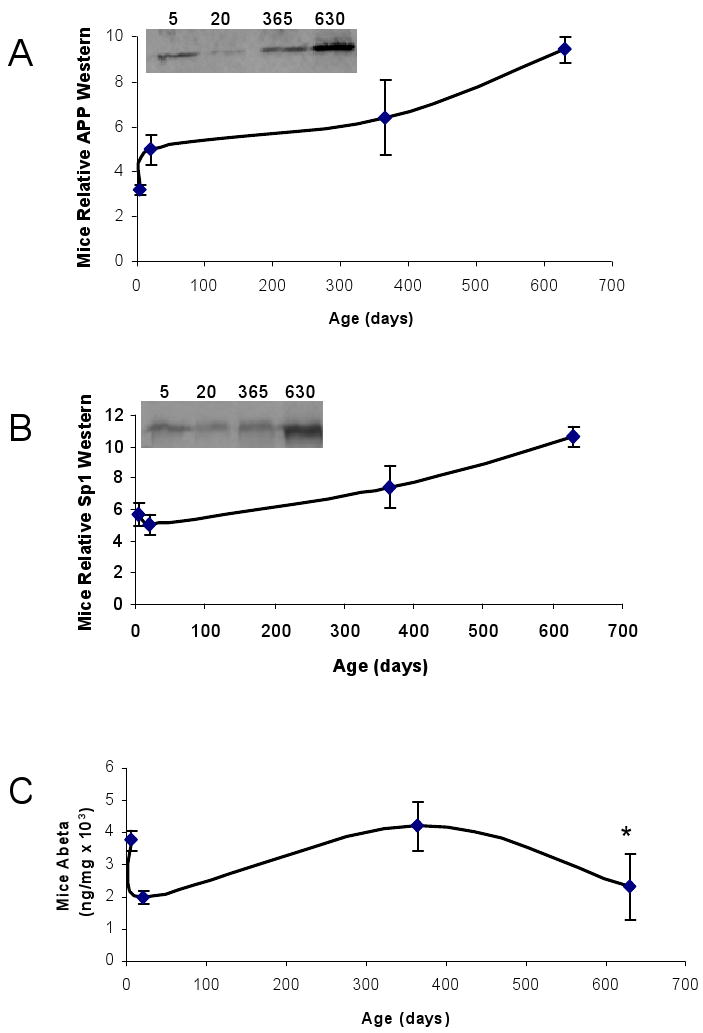
Protein from cortical tissue of wild–type mice was isolated, equal protein amounts were loaded and probed with 22C11 AβPP N–terminus antibody with SDS–PAGE western blot analysis as described in the methods section. The SP1 antibody used is mentioned in the methods section. Protein was also used to measure Aβ 1–40 by a sandwich ELISA assay (IBL, Japan). Six time points are shown. Representative blots are shown in insets for western analysis. A) Relative AβPP levels; B) Relative SP1 levels; C) Aβ40 levels. Each data point in the curve is the mean + SEM (n=3 animals). “*” denotes significant difference between Aβ levels at PND 630 as compared to PND 365. Western blot results were normalized to β–actin signal.
AβPP, BACE1, and Sp1 mRNA expression in monkeys at different ages
In the three monkey age groups, both GAPDH–normalized AβPP and normalized BACE1 mRNA were independently elevated in the adult group (12–year old), but decreased in the aged 23–year old group (Fig. 3A and 3B). As was the case in mice, normalized Sp1 mRNA expression showed the same trend as normalized mRNA of AβPP (Fig. 1 vs. 2). Unlike in mice, BACE1 mRNA decreased in monkey.
Fig. 3. Lifespan mRNA expression changes in AD related genes (Sp1, AβPP, BACE1) in the primate brain cortex.

Relative quantification was measured by using 7500 Real–Time PCR System (Applied Biosystems, CA) with GAPDH serving as the endogenous control. Three time points are shown. Representative blots are shown in insets for western analysis. A) Relative AβPP mRNA. B) Relative SP1 mRNA. C) Relative BACE1 mRNA. Each data point in the curve is the mean + SEM (n=3 monkeys). “*” denotes significant difference for SP1 or AβPP mRNA time point when compared to 12 years age.
AβPP, SP1 protein expression and Aβ1–40 levels in monkeys at different ages
The total β–actin–normalized AβPP protein level in monkeys increased linearly as they aged (Fig. 4A). The plaque–forming primates accumulated AβPP protein in their brain as they aged despite their inverse relationship to the AβPP mRNA (Fig. 3 vs. 4). Normalized SP1 levels on the other hand, remained steady during adulthood but sharply rose in old age (Fig. 4B). In monkeys, there was an age–dependent increase in Aβ1–40 levels (Fig. 4C), which was consistent with normalized AβPP protein levels.
Fig. 4. Lifespan profile of AD related proteins (AβPP, SP1, and Aβ) in the primate brain.
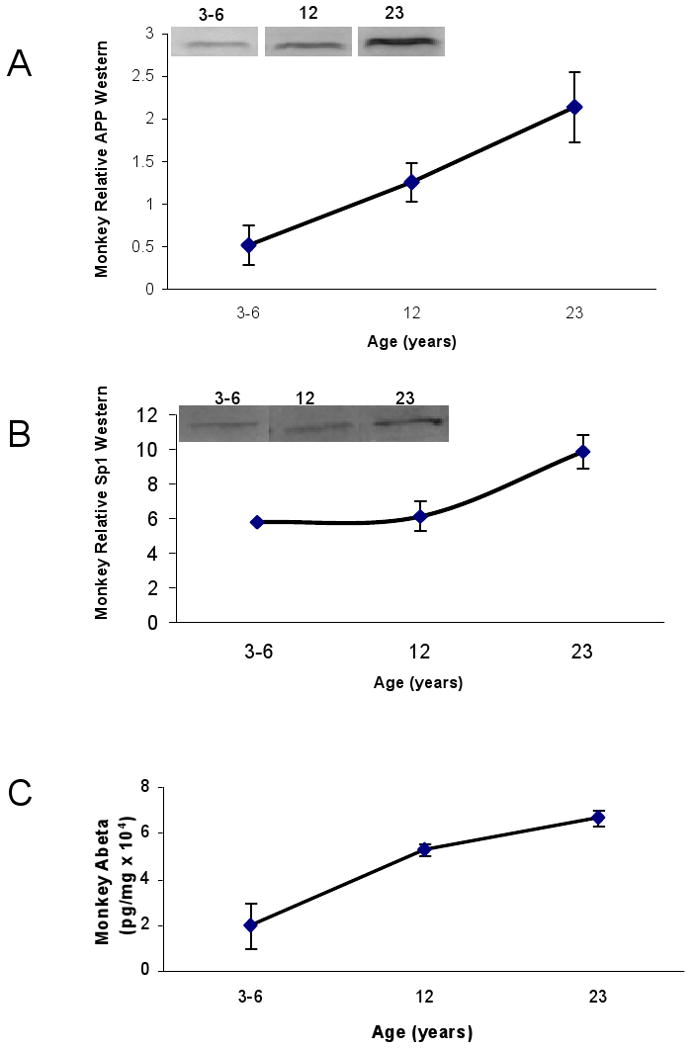
Protein from cortical tissue of Cynomolgus primate was isolated and probed with 22C11 AβPP N–terminus antibody with SDS–PAGE western blot analysis as described in the text. The SP1 antibody used is mentioned in the methods section. Protein was also used to measure Beta amyloid (Aβ) 1–40 using an ELISA assay (IBL, Japan). A) Relative AβPP protein signal; B) Relative SP1 signal; C. Aβ40 levels. Each data point in the curve is the mean + SEM (n=3 monkeys). Western blot results were normalized to β–actin signal.
BACE1 activity in mice and monkeys at different ages
BACE1 is the proteolytic enzyme that generates the N–terminus of Aβ peptide. Our study showed that BACE1 activity remained relatively steady in young and aging mice (Fig. 5A). In monkeys, BACE1 activity appears to decrease in old age (Fig. 5B), although this decrease is not significant at p < 0.05. In both mice and monkeys, BACE1 activity does not appear to follow the same pattern as AβPP or Aβ levels.
Fig. 5. Lifespan profile of BACE1 secretase activity in the mouse and primate brain.

Protein from cortical tissue of mouse and Cynomolgus primate was isolated and BACE1 activity measured using the BACE1 activity assay kit (R&D Systems, Inc., MN). The y–axis reports raw intensity numbers from fluorescence spectrophotometry. A) BACE1 activity in mice at six time points. B) BACE1 activity in monkeys at three time points. Each data point in the curve is the mean + SEM (n=3 animals). “*” denotes significant difference for SP1 or AβPP mRNA time point when compared to PND 365 for mouse or 12 years age for monkey.
Genomic sequence homologies of monkey and mouse Sp1 and AβPP sequences with human sequence
Structural similarities and differences in genomic sequences are often reflected in differences in transcription and hnRNA processing. We examined the respective Sp1 genes of monkey (40kb) and mouse (39kb) vs. human (40kb) genomic sequences via BLAST. When the mouse genomic sequence database was BLAST probed with the human genomic sequence for Sp1 (Fig. 6A), coverage of homologous regions attained 19% of total human genomic sequence with an identity of 91% over the longest homologous sub–sequence. Coverage of homologous regions between human (300kb) AβPP and mouse (290kb) AβPP sequences (Fig. 6B) was 3%, with an identity of 85% over the longest homologous sub–sequence. Comparison of monkey and human Sp1 genomic sequences (Fig. 6C) revealed 63% coverage with a 95% homology for the longest homologous sub–sequence. Coverage of homologous regions between human and monkey (300kb) AβPP sequences (Fig. 6D) was 91% with an identity of 91% over the longest homologous sequence. These differences between mouse and monkey in structural homology to the human AD–related genes Sp1 and AβPP are not unexpected and indicate that fundamental gene regulatory variation should, likewise, be expected between rodent model systems and human AD.
Fig. 6. Genomic homology of mouse Sp1 and AβPP with human Sp1 and AβPP.
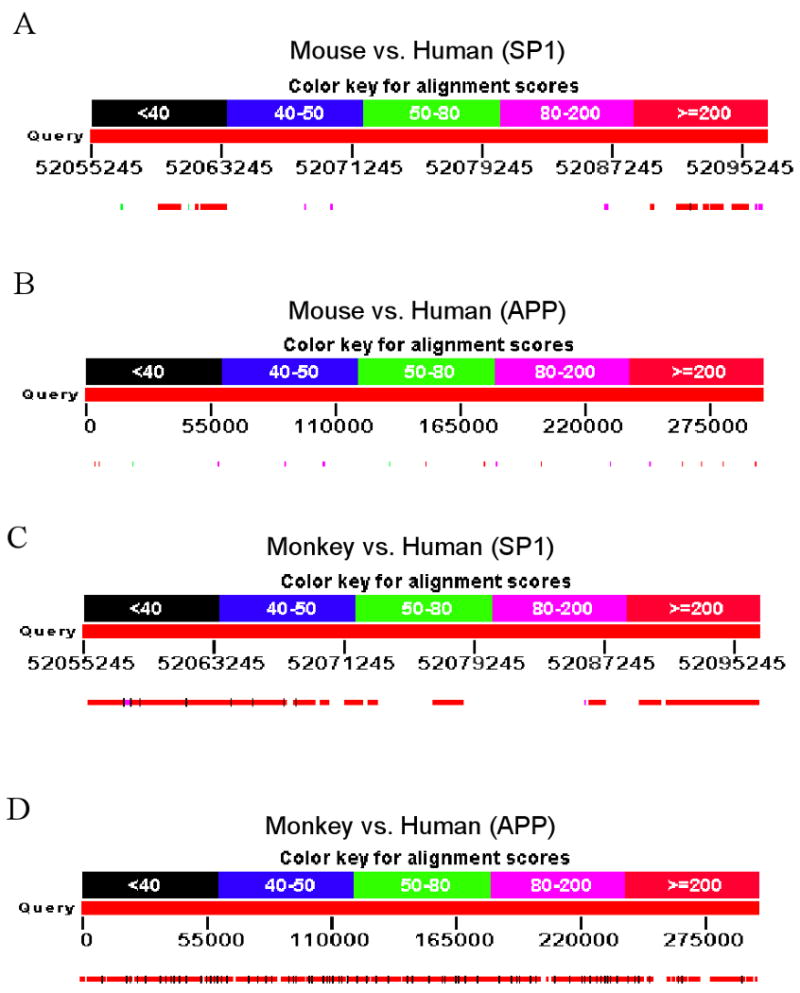
Genomic reference sequences for human Sp1 and AβPP were used to BLAST the mouse reference genomic assembly as described in the text. Diagram represents coverage of homological regions over entire genomic sequences. Colors indicate percent homology as indicated by keys on figure. A) Homology of mouse Sp1 vs. human Sp1. Numbers along alignment indicate position in human chromosomal genomic sequence. B) Homology of mouse AβPP vs. human AβPP. Numbers along alignment indicate position in human reference gene sequence [81]. C) Homology of monkey Sp1 vs. human Sp1. Numbers along alignment indicate position in human chromosomal genomic sequence. D) Homology of monkey AβPP vs. human AβPP. Numbers along alignment indicate position in human reference gene sequence [81].
Sp1 promoter sequence homologies vs. human
Promoter homology comparison in a 50bp window (up to 4kb upstream of the +1 TSS) of Sp1 (Fig. 7A) produced two distinct running profiles when comparing mouse vs. human and monkey vs. human. Homology between mouse and human sequences was mostly between 25% and 50% from −4000 to −1600 on the human sequence, counting the TSS as +1, when it rose to around 75% from −1400 to −100 (human sequence numbering). From −100 through the 5′–UTR (+1 to +101), homology was between 90% and 100%. When comparing monkey to human Sp1 5′–flanking sequences (Fig. 7B), there was no region of homology between −4000 and −3709 on the human sequence. From −3709 to −2450, homology was 85%–100%. A sharp drop in homology occurred at −2450 to −1950, where homology dropped to 25%, rose to 75% and then dropped back to 25%. From –1950 to the end of the 5′–UTR (+101), homology of between 85% and 100% resumed.
Fig. 7. Homology of mouse and monkey Sp1 promoter sequences with human Sp1 sequence.

Sequences of 4kb length upstream of the +1 TSS were taken from genomic reference sequences for mouse, rhesus monkey, and human Sp1, and ClustalX was used to align each of the monkey and mouse sequences to the human. Diagram represents percent homology of each non–human sequence with human sequence in a 50–bp window. A) Homology of mouse Sp1 promoter vs. human Sp1 promoter. B) Homology of monkey Sp1 promoter vs. human SP1 promoter.
Unique transcription factor binding sites predicted in Sp1 promoter of mouse vs. primate (monkey and human)
We used the human, monkey, and mouse Sp1 promoter sequences, 4kb upstream of the +1TSS, to probe the transcription factor database included in MatInspector (v. 7.7). Hundreds of sites were shared between both rodents and primates (data not shown). However, when the output was screened to include only those sites that were unique by transcription factor and transcription factor family, 18 different transcription factor families, each represented by a single factor, remained (Table 2). For mouse, the families were represented by transcription factors activator protein 2 (AP2), autoimmune regulatory element binding factor (AIRE), a barbiturate–inducible element (BARBIE), downstream immunoglobulin control element, critical for B cell activity and specificity (DICE), GTF2I-like repeat 4 of GTF3 (GTF3R4), and Nuclear DEAF-1-related protein (NUDR).
Table 2.
Unique transcription factor family sites in Sp1 promoters of human and monkey vs. mouse.
| Factor | Family | Human | Monkey | Mouse |
|---|---|---|---|---|
| AARE | AARE binding factors | −3830, −2743, −1833 | −3050, −2132 | |
| AP2 | Activator protein 2 | −1232, −1232 | ||
| AIRE | Autoimmune regulatory element binding factor | −3472, −3308, −2044, −1476 | ||
| BARBIE | Barbiturate-inducible element box from pro+eukaryotic genes | −2272, −1707, −732, −671 | ||
| TBX5 | Brachyury gene, mesoderm developmental factor | −3920, −823 | −806 | |
| KAISO | BTB/POZ (broad complex, TramTrack, Bric à brac/pox viruses and zinc fingers) transcription factor | −1970 | −2270 | |
| DICE | Downstream Immunoglobulin Control Element, critical for B cell activity and specificity | −1636 | ||
| GTF3R4 | GTF2I repeat domain–containing factors | −58 | ||
| NUDR | Homolog to deformed epidermal autoregulatory factor–1 from D. melanogaster | −872, −766 | ||
| FLI | Human and murine ETS1 factors | −313 | −294 | |
| HIF1 | Hypoxia inducible factor, bHLH/PAS protein family | −1877, −330 | −3910 | |
| HIC1 | Krueppel–like C2H2 zinc finger factors hypermethylated in cancer | −482 | −463 | |
| TCF11 | MAF and AP1 related factors | −364 | −345 | |
| MEF3 | MEF3 binding sites | −2731 | −3834, −3204 | |
| NRSE | Neuron-restrictive silencer factor | −2820, 48 | 67 | |
| PTF1 | Pancreas transcription factor 1, heterotrimeric transcription factor | −1281 | −1258 | |
| RBPJκ | Notch–associated RBPJ–κ | −3977 | −3646, −3635 | |
| THAP1 | THAP domain containing protein | −2799 | −3106 |
Transcription factor families unique to the primate (human and monkey) sequences were represented by the specific factors of amino acid response element (AARE), T–box transcription factor 5 (TBX5), kaiso (a zinc–finger transcription factor), the factor for Friend leukemia integration site 1 (FLI), hypoxia inducible factor 1 (HIF1), hypermethylated in cancer 1 (HIC1), transcription factor 11 (TCF11), myocyte expression factor 3 (MEF3), Neuron–restrictive silencer factor (NSRF), Pancreas transcription factor 1 (PTF1), the Notch–associated factor RBPJκ (RBPJκ), and THAP domain containing, apoptosis associated protein 1 (THAP1).
Regulatory factor and miRNA binding sites in the 5′—UTR of human, monkey, and mouse AβPP
To assess potential pathways whereby differences in posttranscriptional regulation of primate vs. murid rodent AβPP may operate, the 5′– and 3′– UTRs of the human, cynomolgus monkey, and mouse AβPP gene were analyzed via the RegRNA utility. In addition, some microRNA (miRNA) sites determined were redundant homologies, since both the human and mouse miRNA databases were used to search these sequences. In the 5′–UTRs (Table 3), we noticed that all three species had terminal oligopyrimidine tracts (TOP), although the mouse sequence had only one while the human and monkey sequences had three. Furthermore, three different human miRNA homology sites (hsa–miR–346, 502, 504) were found in both monkey and human sequences but not in the mouse (along with three sites for the homologous mouse miRNAs). One mouse miRNA homology site (mmu–miR–328) was found in the mouse sequence (homologous to a single human miRNA) but neither in monkey nor human.
Table 3.
Presence of selected motifs in AβPP 5′–UTR mRNA from human, monkey, and mouse.
| Motif | Human | Monkey | Mouse |
|---|---|---|---|
| TSSa | 1 | 1 | 1 |
| AUG | 148 | 144 | 146 |
| TOPb | 6, 52, 131 | 5, 51, 127 | 5 |
| hsac–miR–324–3p | 54 | 44 | |
| hsa–miR–328 | 29 | ||
| hsa–miR–346 | 69 | 62 | |
| hsa–miR–502 | 71 | 70 | |
| hsa–miR–504 | 123 | 119 | |
| mmud–miR–296 | 33 | 35 | 35 |
| mmu–miR–324–3p | 54 | 44 | |
| mmu–miR–328 | 29 | ||
| mmu–miR–346 | 63 | 62 |
Sites unique to mouse are in boldface. Sites found in monkey and human but not mouse are italic.
+1 Transcription Start Site
Terminal Oligopyrimidine Tract
Homo sapiens, human
Mus musculus, mouse
Regulatory sites in 3′–UTR in different species
Examining the 3′–UTR sequences of human, cynomolgus monkey, and mouse also revealed potentially important differences in regulatory motifs (Table 4). All three sequences had the AβPP mRNA stability control element (AβPP SCE). However, the mouse sequence alone possessed (two copies of) the cytoplasmic polyadenylation element (CPE). While all sequences had at least two copies of the gamma interferon activated inhibitor of ceruloplasmin mRNA translation (GAIT) motif, the human and monkey sequences had five more or four more such sites, respectively, than did the mouse. Similarly, human and monkey sequences had more selenocysteine insertion sequence (SECIS) motifs than did the mouse. The major difference noticed in regard to miRNA homology sites was that human and monkey sequences shared five (hsa–miR–17–5p, 20b, 106b, 483, 485–5p) human sites (with five homologous mouse miRNAs) found in mouse, while the mouse sequence had one unique mouse miRNA (mmu–miR–99b) site (with a homologous human miRNA).
Table 4.
Presence of selected motifs in AβPP 3′–UTR mRNA from human, monkey, and mouse.
| Motif | Human | Monkey | Mouse |
|---|---|---|---|
| stop codon | 2458a | 2229a | 2231b |
| AβPP SCEc | 2659 | 2435 | 2445 |
| CPEd | 2931, 2941 | ||
| GAITe | 2704, 2787, 3013, 3096, 3130, 3392, 3397 | 2291, 2562, 2788, 2901, 2938 | 2580, 2638 |
| SECISf | 3478, 3479 | 2361, 2362, 2365 | 2567 |
| hsa–miR–17–5p | 3155 | 2926 | |
| hsa–miR–20b | 3156 | 2927 | |
| hsa–miR–99b | 2960 | ||
| hsa–miR–106b | 3158 | 2929 | |
| hsa–miR–483 | 3181 | 2952 | |
| hsa–miR–485–5p | 2464 | 2235 | |
| mmu–miR–17–5p | 3155 | 2926 | |
| mmu–miR–20a | 3156 | 2927 | |
| mmu–miR–99b | 2960 | ||
| mmu–miR–106a | 3157 | 2928 | |
| mmu–miR–106b | 3158 | 2929 | |
| mmu–miR–485–5p | 2464 | 2235 |
Sites unique to mouse are in boldface. Sites found in monkey and human but not mouse are italic.
“UAG”
“UAA”
Amyloid–β Precursor Protein mRNA Stability Control Element
Cytoplasmic Polyadenylation Element
Gamma Interferon Activated Inhibitor of Ceruloplasmin mRNA Translation
Selenocysteine Insertion Sequence–type 1
Discussion
We undertook our study specifically to test a critical unspoken assumption in the field of AD research, that conventional rodent animal models can be presumed to be sufficiently similar to humans that results from the animal models can be “linearly applied” to the human condition. We, therefore, compared levels of proteins shown to be critical for AD etiology between murine rodents and primates, specifically to see how much actual similarity existed for the expression of these proteins between rodent models and primates (which would include humans).
Animal disease models are not necessarily “non–reactive vessels”—the substrate species has its own normal expression patterns and pathways for etiologically interesting genes. These patterns and pathways may or may not significantly resemble those of the ultimate target species, which for AD would be humans. It is not known whether or not “normal” expression patterns do or do not interact with AD models imposed on mice. An indispensible step in learning whether or not the mouse functions more as a “vessel” or as an “environment” for AD models is to understand lifetime non–diseased expression patterns of AD–associated genes. This understanding is enlarged in the context of translation of animal results to human subjects by comparing these patterns between mice and primates that are, presumably, more closely related to humans.
The single most important risk factor in the etiology of Alzheimer's disease is age. The majority of research within the field “short–circuits” this risk factor by utilizing transfected cell cultures and short–lived natural or transgenic models. These “time–compressed” models of AD have not been evaluated by comparison to actual aging, particularly not for comparison of non–pathological lifespan expression of genes and proteins associated with AD, such as AβPP, BACE1, and Aβ between plaque forming (primate) and non–plaque forming (rodent) species.
In this study, constitutive AβPP and Sp1 mRNA expression mirror each other across the rodent lifespan and thus either gene could be biomarker for the other. These findings are consistent with previous siRNA studies, which showed a dramatic drop in AβPP promoter activity, if SP1 levels are depleted [26] and with other surveys of AβPP and Sp1 mRNA [40-42]. Immunohistochemical studies have shown that AβPP and SP1 co–localize to neurons and have a similar distribution in the brain [43]. These lifetime signatures establish SP1 as a partner transcription factor that controls AβPP expression across the lifespan.
BACE1 mouse mRNA levels remained unchanged (data not shown). This may indicate that, in mice, SP1 does not drive BACE1 mRNA expression in the same manner as does AβPP. Other studies have shown that, even when AβPP is transgenically up–regulated, BACE1 mRNA levels do not alter significantly at different ages [44]. BACE1 over-expression with elevated mRNA level was only seen in genomic BACE1 transgenic mice [45].
In primates, the mRNA expression of AβPP, BACE1, and Sp1 showed the same trend among all age groups. Higher levels of Sp1 mRNA expression were accompanied by greater AβPP and BACE1 mRNA expression, and vice–versa. This would not be inconsistent with SP1 coordinately regulating both AβPP and BACE1 gene expression in primates. However, there was no elevation of mRNA expression for the genes in old age, instead, mRNA levels for those genes decreased in the oldest age group of mice.
Several studies have reported age related brain AβPP mRNA changes in cynomolgus monkeys, normal humans, and AD patients. A primate study [46] showed unchanged mRNA levels of AβPP751 and AβPP695 in cortical regions in the aged group in comparison to the young group, but expression in thalamus was significantly increased with a decreased AβPP695/AβPP751 ratio in aged monkeys. Another report found no differential expression of alternatively spliced AβPP mRNA transcripts in AD cases or aged monkeys [47]. A study reported that the mRNA ratio AβPP770+751/AβPP695 increased with age in AD patients [48], while another study found expression of major AβPP mRNA in neocortex declined as a function of age in both AD and control cases [49]. On the other hand, there was a report of no alteration of total AβPP mRNA as well as AβPP with Kunitz protease inhibitor (KPI) in a wide range of age group of control human subjects [50]. These contradictory results are probably caused by the methods for studying mRNA used by different studies. For example, solution hybridization–RNase protection assay [48, 50] is more sensitive and quantitative than the Northern blot analysis utilized by another group [49]. Moreover, several factors, such as gender, postmortem interval, and brain pH would affect the quantification of mRNA when postmortem brain tissues are utilized [51].
In mice, AβPP and Sp1 gene expression and their protein products were elevated late in life; however Aβ levels declined in old age. In monkeys, Sp1, BACE1, and AβPP mRNA expression declined in old age, while their protein products, as well as Aβ levels, rose. In rodents, Aβ levels in old age do not appear to be maintained by the transcriptional or translational status of the AβPP gene but instead by enhanced degradation and clearance. In primates, there is an inverse relationship between AβPP and Sp1 mRNA levels and their corresponding protein products, as well as Aβ levels. While the specific mechanism of this disparity is not apparent, it suggests that enhanced translational efficiency or reduced protein degradation may account for a rise in AβPP consequently elevating Aβ levels in primates.
We found that BACE1 activity remains practically unchanged across the entire adult lifespan of mice and has a non–significant decrease in monkeys. Thus, BACE1 activity does not appear to mirror Aβ levels nor is it influenced by AβPP levels. Neither does it appear to match the decline in BACE1 mRNA levels in monkeys. We must note that currently available β–secretase activity assays are not necessarily specific for BACE1 if used on tissue extracts instead of purified BACE1 protein. However, of the alternatives, BACE1 is the primary β–secretase [29] and is likely to be responsible for most of the measured activity and changes in this activity.
We did note apparently dramatic changes between postnatal days 5 to 20 in levels of mouse SP1 and APP mRNA, in mouse APP and in mouse Aβ. While these results may help illuminate regulation of these genes in mouse, we have previously published in greater detail on developmental expression of such genes in rodents [26, 52, 53].
Given the differences we found in AβPP mRNA and protein levels between mouse and monkey, we examined homology at the genomic level. Rhesus monkey and human AβPP promoter sequences up to 4kb have previously been shown to have high (>90%) homology. [54]. The full–length (∼300kb) monkey genomic sequence preserved approximately 90% homology with the human reference AβPP genomic sequence, while mouse had no more than 3% homological regions. Respective Sp1 genomic sequences' homology comparison with human showed that monkey sequence had up to 63% homology coverage vs. 19% for mouse vs. human. The majority of non–homologous regions were intronic. Intronic regulation of mRNA levels has been well demonstrated [55, 56]. The large differences between mouse and monkey respective genomic Sp1 homologies to human likely contribute to differences in mRNA levels for this transcription factor, although greater differences in AβPP homologies do not seem to alter tight transcriptional control of AβPP by Sp1.
We also examined the promoters of monkey and mouse Sp1 genes for structural differences vs. the human Sp1 gene and determined very high homology (>90%) between monkey and human over most of 4kb upstream of the +1 TSS, while mouse and human homology remained around 75% for most of this length. In addition, the primate Sp1 promoter sequences were predicted to have several transcription factor binding sites absent in the mouse sequence. Of particular interest is the presence of AP2 and HIF1 sites. AP2 has been implicated in regulation of the BACE1 gene promoter [57]. HIF1 activity has been linked to neuroprotection against Aβ [58] but paradoxically upregulates BACE1 and results in greater generation of Aβ [59]. in addition, the presence of RBPJκ sites may be pathogenically interesting, given that transcription factor's role in notch-associated inhibition of apoptosis [60]. NRSF is a potent repressor of transcription of neuron–specific genes in non–neuronal cells [61]. TBX5 is a developmental regulator that induces apoptosis [62]. THAP1 is a nuclear proapoptotic factor [63]. Factors such as NRSF, HIF1 or RBPJκ could function to downregulate Sp1 in healthy neuronal tissue, while factors such as THAP1 could be active during apoptotic or pathological states, such as in AD. These interactions would not be possible with the mouse Sp1 promoter, given that the sites are not available on the mouse sequence. Beyond the differences in predicted transcription factor binding sites, intronic regulation of hnRNA processing may also play a role in the differences observed between mouse and monkey Sp1 mRNA levels.
Upon examining Aβ peptide levels, we noted that in neither species did the peptide levels closely follow AβPP mRNA levels in the aging paradigm studied herein. We, therefore, examined differences in the 5′– and 3′–UTRs of mouse vs. cynomolgus monkey AβPP mRNA. We determined that the mouse sequence lacked two of three TOP motifs found in the human and monkey sequences. TOP presumably functions for translational repression [64]. The presence of multiple TOP sites in primate sequences vs. a single TOP site in mouse may indicate that, early in life, primate AβPP mRNA translation may be more strongly suppressed than mouse, and some mechanism later operates on the primate 5′–UTR to overcome this suppression. One such potential mechanism may involve the absence of a “CAGA” box within the 5′–UTR of mice and rats. This “CAGA” box is present in the AβPP 5′–UTR sequences of plaque–forming mammalian species [18] and resides in a region of the AβPP 5′–UTR that has been shown to be targeted by the potential anti–AD drug phenserine [65, 66]. Activity of miRNA on the 5′–UTR in regulation of translation may also explain differences in mouse vs. monkey protein levels. It has been recently shown that miRNA can be active via the 5′–UTR in repression of mRNA translation [67].
Our examination of the 3′–UTR has also suggested avenues to explore for differential mRNA regulation. Two CPE sites were present in mouse mRNA vs. absent in primate. This motif stabilizes mRNA and increases posttranscriptional expression. However, it only does so up through the blastoderm stage [68]. AβPP and its Aβ product have developmental functions that have only been partially elucidated [69, 70]. It is possible that murid rodents have evolved a specific means of early–developmental regulation of AβPP translation via the 3′–UTR. However, in addition to CPE, we also determined that the human and monkey AβPP 3′–UTR sequences had three times as many GAIT motifs (an inhibitor of mRNA translation) as did mouse. This points toward aging–related derepression of translation to explain increasing levels of AβPP protein in primates. However, in addition to these differences, mouse AβPP 3′–UTR had one unique miRNA binding site, which may repress mouse AβPP translation, via 3′–UTR repression by miRNA binding [67]. Alternatively, the miRNA sites that occur in primate but not mouse sequences may function to activate primate AβPP mRNA translation, as has been determined to occur for tumor necrosis factor alpha [71]. Direct confirmation of the active status of these sites in the AβPP mRNAs would determine which mechanism or mechanisms are actually functioning for this particular gene.
With aging, other factors may additionally contribute to the amyloidogenic pathway. A recent study [72] with normal aging human beings found the non–amyloidogenic α–secretase pathway declined due to aging, and, while β–secretase activity was increased, levels of Aβ40 and Aβ42 did not change with age. Since they only measured the insoluble form of Aβ, this result did not represent the whole Aβ pool. Aging is also a crucial factor resulting in reduced Aβ clearance by degrading enzymes. Aging rats showed much less elimination of Aβ1–40 from brain to peripheral circulation than young rats [73].
In addition to aging–related factors, species–intrinsic differences also need to be considered, such as those we have recently demonstrated in our analysis of the human apolipoprotein E (APOE) gene promoter in human–origin vs. rodent–origin cell lines and nuclear extracts [74].
Regarding the aforementioned results and their interpretations, the overall mouse mRNA data is similar to that performed in an independent set of rats previously published [26]. An mRNA analysis of monkeys produced similar readings, as previously published by us for aged monkeys [75]. Confidence is also raised in the rodent protein data through measurement at multiple intermediate ages. The data points on the curves presented were derived from 3–4 animals. When considering these profiles, one may keep in mind that the overall signature profiles are more important than individual points on the curve. Similarity and contrast of the lifespan expression of amyloid pathway genes and their products between amyloid–producing species (cynomolgus monkey) and non–amyloid species (mouse) are the major focus of the present work.
Alternative explanations may suffice for the observed differences between mouse and monkey in AβPP expression and Aβ metabolism. While both populations were maintained in laboratory conditions, these conditions could not, of course, have been identical. Each species has different nutritional requirements, requiring that their feed differ from each other. This introduces the potential for dietary effects on AβPP expression, similar to those seen for the PSEN1 gene [76]. Epigenetic effects also cannot be ruled out [77]. Likewise, the great divergence in overall lifespan raises the possibility of a fundamental difference of aging programs that is not limited to SP1, AβPP, or BACE1. That is to say, differences seen in the expression and activity of these genes' products may actually reflect a deeper and more profound difference between the two species, altogether, one that raises the question of applicability of results from one model to another.
In a broader context, the present work underscores the importance of studying the regulation of gene expression in relation to the disease process. Structural similarity of gene coding sequences is often taken as a strong indicator of the suitability of a model system, especially when a model is transgenic, since it has the exact human coding sequence. Experience has shown that such models have limits. Notably, a natural model considered as close as 99% homologous to humans, such as the chimpanzee, does not afford a 99% level of gene–based pathogenic functional similarity. Fundamental differences in gene regulation and interaction may play a more important role in determining differences than primary DNA sequence [78]. These regulatory differences could likewise be significantly influenced by environmental factors, such as diet and metals, at the very early stage of development and, importantly, could be manifested later in the life after prolong latency as explained in a recently proposed ‘LEARn’ model (Latent Early–life Associated Regulation) [74] and discussed for the somatic epitype [79].
In summary, we have examined the lifetime profiles of intermediates in the amyloid cascade pathway in both non plaque–forming rodents and plaque–forming primates (Table 5). We found that the expression pattern of AβPP mRNA mirrors that of the transcription factor Sp1, and thus SP1 may be a lifelong regulator of the AβPP gene. We also noted that in both species, there is a complex relationship between AβPP mRNA expression and AβPP protein levels. Furthermore, in non plaque–forming rodents, Aβ does not accumulate in the brain with aging; however, in plaque–forming primates, both AβPP protein and Aβ accumulated. These findings are summarized diagrammatically in Fig. 9. Proteolytic enzyme activity does not match the production levels of Aβ. The discrepancy between AβPP mRNA and AβPP protein as well as Aβ in both species may be due to different nucleic acid structure–based mechanisms, as our comparisons of genomic and mRNA sequences suggest. In mice, posttranslational pathways related to Aβ clearance or degradation appears to prevent any accumulation Aβ levels. On the other hand, enhanced translational efficiency or decreased AβPP degradation may lead to an accumulation of AβPP and Aβ in non–human primates. Posttranslational regulation and AβPP protein metabolism may also play a crucial role in amyloidogenesis.
Table 5.
Summary of mRNA expression, protein or peptide levels, and enzymatic activity, monkey vs. mouse.
| Monkey | Mouse | |||
|---|---|---|---|---|
| Gene | mRNA | Protein/Peptide/Activity | mRNA | Protein/Peptide/Activity |
| SP1 | ↓ | ↑ | ↑ | ↑ |
| AβPP | ↓ | ↑ | ↑ | ↑ |
| BACE1 | ↓ | ↓ | nca | ↑ |
| Aβ | ↑ | ↓ | ||
No change
Our results point toward the need to carefully and rationally select animal models, even transgenic models, to understand fundamental molecular mechanisms of human disease. Differential regulation of “pathogenic” genes points toward the need for models that preserve a similar regulatory milieu to the ultimate target species (in the case of AD, human). Transgenic models may be able to fulfill this need, but each level of regulation (transcriptional, translational, posttranslational) requires more transgenes be combined, and raises the possibility that the transgenes, themselves, may be subject to potentially important species–differentiated regulation.
The current prospect for mouse models of AD is mixed, with much work done on animals transgenic for mutant AβPP, mutant PSEN1, and the two combined. Likewise, there are also knockouts for AβPP, BACE1, MAPT, and other genes implicated in AD. Most of the transgenic lines use a “strong” promoter specifically to ensure high production of the protein of interest. This practice has also meant that studying possible contributions of gene regulation to etiology may have been sidestepped, entirely. Recently, mouse lines have begun to be developed that are transgenic for both the coding sequence and promoter of AD–related genes of interest, such as tau. It should be noted that work with the promoters of the AD–associated gene APOE for mouse and human have revealed that the human promoter can have different responses in rodent–origin cell lines and nuclear extracts than in cells and extracts of human origin [74]. Thus, even though improvements are likely in rodent models, there may always be an inherent limitation to the practice. The authors do not wish this cautionary statement regarding mouse models to be taken as an indictment of animal modeling of AD, altogether. This work raises the question of the applicability of a particular model species toward translation of AD research to humans. Even though there are stark contrasts between mouse and primate expression patterns, other rodent species, such as guinea pig [80], could serve as useful non–transgenic models for APP processing and expression.
Fig. 8. Relationship between mRNA and protein product levels of selected AD–related genes in mouse vs. monkey.
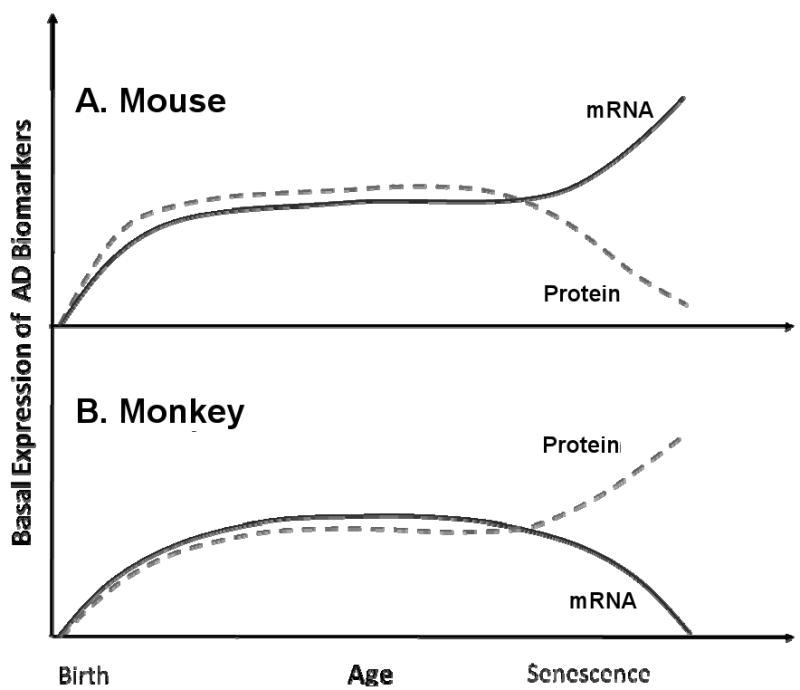
Diagram illustrates levels of mRNA vs. protein product levels of SP1 and APP in animal models studied. Solid line indicates mRNA levels over lifespan while dashed line indicates protein levels over lifespan. For each species, mRNA and protein levels diverge from each other in later life, albeit in opposite directions when comparing species to species. A) Mouse mRNA and protein levels. B) Monkey mRNA and protein levels.
Acknowledgments
This research was supported by the Intramural Research Program of the NIH, National Institute of Environmental Health Sciences (NIEHS) and by grants (ES013022 and AG027246) from the National Institutes of Health (NIH) awarded to NHZ. The research core facility was funded (P20RR016457) by the National Center for Research Resources (NCRR), a component of NIH. Work at DKL's laboratory was funded by grants from the Alzheimer's association and National Institute on Aging, NIH (AG18379 and AG18884).
Footnotes
Disclosure Statement. The authors state they have no actual or potential conflicts of interest concerning the material of this report.
References
- 1.Tanzi RE, Bertram L. Alzheimer's disease: The latest suspect. Nature. 2008;454:706–708. doi: 10.1038/454706a. [DOI] [PubMed] [Google Scholar]
- 2.Selkoe DJ. Amyloid protein and Alzheimer's disease. Scientific American. 1991;265:68–66. 78. doi: 10.1038/scientificamerican1191-68. [DOI] [PubMed] [Google Scholar]
- 3.Sambamurti K, Suram A, Venugopal C, Prakasam A, Zhou Y, Lahiri DK, Greig NH. A partial failure of membrane protein turnover may cause Alzheimer's disease: a new hypothesis. Current Alzheimer Research. 2006;3:81–90. doi: 10.2174/156720506775697142. [DOI] [PubMed] [Google Scholar]
- 4.Lahiri DK, Farlow MR, Sambamurti K, Greig NH, Giacobini E, Schneider LS. A critical analysis of new molecular targets and strategies for drug developments in Alzheimer's disease. Current Drug Targets. 2003;4:97–112. doi: 10.2174/1389450033346957. [DOI] [PubMed] [Google Scholar]
- 5.Goedert M, Spillantini MG. A century of Alzheimer's disease. Science. 2006;314:777–781. doi: 10.1126/science.1132814. [DOI] [PubMed] [Google Scholar]
- 6.Maslow K. 2008 Alzheimer's disease facts and figures. Alzheimers Dement. 2008;4:110–133. doi: 10.1016/j.jalz.2008.02.005. [DOI] [PubMed] [Google Scholar]
- 7.Corder EH, Saunders AM, Strittmatter WJ, Schmechel DE, Gaskell PC, Small GW, Roses AD, Haines JL, Pericak-Vance MA. Gene dose of apolipoprotein E type 4 allele and the risk of Alzheimer's disease in late onset families. Science. 1993;261:921–923. doi: 10.1126/science.8346443. [DOI] [PubMed] [Google Scholar]
- 8.Saunders AM, Strittmatter WJ, Schmechel D, George-Hyslop PH, Pericak-Vance MA, Joo SH, Rosi BL, Gusella JF, Crapper-MacLachlan DR, Alberts MJ, et al. Association of apolipoprotein E allele epsilon 4 with late-onset familial and sporadic Alzheimer's disease. Neurology. 1993;43:1467–1472. doi: 10.1212/wnl.43.8.1467. [DOI] [PubMed] [Google Scholar]
- 9.Evans DA, Beckett LA, Field TS, Feng L, Albert MS, Bennett DA, Tycko B, Mayeux R. Apolipoprotein E epsilon4 and incidence of Alzheimer disease in a community population of older persons. Journal of the American Medical Association. 1997;277:822–824. [PubMed] [Google Scholar]
- 10.Price DL, Sisodia SS. Mutant genes in familial Alzheimer's disease and transgenic models. Annual Review of Neuroscience. 1998;21:479–505. doi: 10.1146/annurev.neuro.21.1.479. [DOI] [PubMed] [Google Scholar]
- 11.Fukuchi K, Ogburn CE, Smith AC, Kunkel DD, Furlong CE, Deeb SS, Nochlin D, Sumi SM, Martin GM. Transgenic animal models for Alzheimer's disease. Annals of the New York Academy of Sciences. 1993;695:217–223. doi: 10.1111/j.1749-6632.1993.tb23055.x. [DOI] [PubMed] [Google Scholar]
- 12.Wirak DO, Bayney R, Ramabhadran TV, Fracasso RP, Hart JT, Hauer PE, Hsiau P, Pekar SK, Scangos GA, Trapp BD, et al. Deposits of amyloid beta protein in the central nervous system of transgenic mice. Science. 1991;253:323–325. doi: 10.1126/science.1857970. [DOI] [PubMed] [Google Scholar]
- 13.Kawabata S, Higgins GA, Gordon JW. Amyloid plaques, neurofibrillary tangles and neuronal loss in brains of transgenic mice overexpressing a C-terminal fragment of human amyloid precursor protein. Nature. 1991;354:476–478. doi: 10.1038/354476a0. [DOI] [PubMed] [Google Scholar]
- 14.Games D, Adams D, Alessandrini R, Barbour R, Berthelette P, Blackwell C, Carr T, Clemens J, Donaldson T, Gillespie F, et al. Alzheimer-type neuropathology in transgenic mice overexpressing V717F beta-amyloid precursor protein. Nature. 1995;373:523–527. doi: 10.1038/373523a0. [DOI] [PubMed] [Google Scholar]
- 15.Podlisny MB, Tolan DR, Selkoe DJ. Homology of the amyloid beta protein precursor in monkey and human supports a primate model for beta amyloidosis in Alzheimer's disease. American Journal of Pathology. 1991;138:1423–1435. [PMC free article] [PubMed] [Google Scholar]
- 16.Jankowsky JL, Younkin LH, Gonzales V, Fadale DJ, Slunt HH, Lester HA, Younkin SG, Borchelt DR. Rodent A beta modulates the solubility and distribution of amyloid deposits in transgenic mice. Journal of Biological Chemistry. 2007;282:22707–22720. doi: 10.1074/jbc.M611050200. [DOI] [PMC free article] [PubMed] [Google Scholar]
- 17.Fung J, Frost D, Chakrabartty A, McLaurin J. Interaction of human and mouse Abeta peptides. Journal of Neurochemistry. 2004;91:1398–1403. doi: 10.1111/j.1471-4159.2004.02828.x. [DOI] [PubMed] [Google Scholar]
- 18.Maloney B, Ge YW, Greig N, Lahiri DK. Presence of a “CAGA box” in the APP gene unique to amyloid plaque-forming species and absent in all APLP-1/2 genes: implications in Alzheimer's disease. FASEB Journal. 2004;18:1288–1290. doi: 10.1096/fj.03-1703fje. [DOI] [PubMed] [Google Scholar]
- 19.La Fauci G, Lahiri DK, Salton SR, Robakis NK. Characterization of the 5′-end region and the first two exons of the beta-protein precursor gene. Biochemical and Biophysical Research Communications. 1989;159:297–304. doi: 10.1016/0006-291x(89)92437-6. [DOI] [PubMed] [Google Scholar]
- 20.Salbaum JM, Weidemann A, Lemaire HG, Masters CL, Beyreuther K. The promoter of Alzheimer's disease amyloid A4 precursor gene. EMBO Journal. 1988;7:2807–2813. doi: 10.1002/j.1460-2075.1988.tb03136.x. [DOI] [PMC free article] [PubMed] [Google Scholar]
- 21.Pollwein P, Masters CL, Beyreuther K. The expression of the amyloid precursor protein (APP) is regulated by two GC-elements in the promoter. Nucleic Acids Research. 1992;20:63–68. doi: 10.1093/nar/20.1.63. [DOI] [PMC free article] [PubMed] [Google Scholar]
- 22.Hoffman PW, Chernak JM. DNA binding and regulatory effects of transcription factors SP1 and USF at the rat amyloid precursor protein gene promoter. Nucleic Acids Res. 1995;23:2229–2235. doi: 10.1093/nar/23.12.2229. [DOI] [PMC free article] [PubMed] [Google Scholar]
- 23.Docagne F, Gabriel C, Lebeurrier N, Lesne S, Hommet Y, Plawinski L, Mackenzie ET, Vivien D. Sp1 and Smad transcription factors co-operate to mediate TGF-beta-dependent activation of amyloid-beta precursor protein gene transcription. Biochemical Journal. 2004;383:393–399. doi: 10.1042/BJ20040682. [DOI] [PMC free article] [PubMed] [Google Scholar]
- 24.Kadonaga JT, Carner KR, Masiarz FR, Tjian R. Isolation of cDNA encoding transcription factor Sp1 and functional analysis of the DNA binding domain. Cell. 1987;51:1079–1090. doi: 10.1016/0092-8674(87)90594-0. [DOI] [PubMed] [Google Scholar]
- 25.Hagen G, Dennig J, Preiss A, Beato M, Suske G. Functional analyses of the transcription factor Sp4 reveal properties distinct from Sp1 and Sp3. Journal of Biological Chemistry. 1995;270:24989–24994. doi: 10.1074/jbc.270.42.24989. [DOI] [PubMed] [Google Scholar]
- 26.Basha MR, Wei W, Bakheet SA, Benitez N, Siddiqi HK, Ge YW, Lahiri DK, Zawia NH. The fetal basis of amyloidogenesis: exposure to lead and latent overexpression of amyloid precursor protein and beta-amyloid in the aging brain. Journal of Neuroscience. 2005;25:823–829. doi: 10.1523/JNEUROSCI.4335-04.2005. [DOI] [PMC free article] [PubMed] [Google Scholar]
- 27.Santpere G, Nieto M, Puig B, Ferrer I. Abnormal Sp1 transcription factor expression in Alzheimer disease and tauopathies. Neuroscience Letters. 2006;397:30–34. doi: 10.1016/j.neulet.2005.11.062. [DOI] [PubMed] [Google Scholar]
- 28.Christensen MA, Zhou W, Qing H, Lehman A, Philipsen S, Song W. Transcriptional regulation of BACE1, the beta-amyloid precursor protein beta-secretase, by Sp1. Molecular and Cellular Biology. 2004;24:865–874. doi: 10.1128/MCB.24.2.865-874.2004. [DOI] [PMC free article] [PubMed] [Google Scholar]
- 29.Cai H, Wang Y, McCarthy D, Wen H, Borchelt DR, Price DL, Wong PC. BACE1 is the major beta-secretase for generation of Abeta peptides by neurons. Nature Neuroscience. 2001;4:233–234. doi: 10.1038/85064. [DOI] [PubMed] [Google Scholar]
- 30.Heicklen-Klein A, Ginzburg I. Tau promoter confers neuronal specificity and binds Sp1 and AP-2. Journal of Neurochemistry. 2000;75:1408–1418. doi: 10.1046/j.1471-4159.2000.0751408.x. [DOI] [PubMed] [Google Scholar]
- 31.von Strauss E, Viitanen M, De Ronchi D, Winblad B, Fratiglioni L. Aging and the occurrence of dementia: findings from a population-based cohort with a large sample of nonagenarians. Archives of Neurology. 1999;56:587–592. doi: 10.1001/archneur.56.5.587. [DOI] [PubMed] [Google Scholar]
- 32.Sani S, Traul D, Klink A, Niaraki N, Gonzalo-Ruiz A, Wu CK, Geula C. Distribution, progression and chemical composition of cortical amyloid-beta deposits in aged rhesus monkeys: similarities to the human. Acta Neuropathologica (Berlin) 2003;105:145–156. doi: 10.1007/s00401-002-0626-5. [DOI] [PubMed] [Google Scholar]
- 33.Marvanova M, Menager J, Bezard E, Bontrop RE, Pradier L, Wong G. Microarray analysis of nonhuman primates: validation of experimental models in neurological disorders. FASEB Journal. 2003;17:929–931. doi: 10.1096/fj.02-0681fje. [DOI] [PubMed] [Google Scholar]
- 34.Nagahara AH, Bernot T, Tuszynski MH. Age-related cognitive deficits in rhesus monkeys mirror human deficits on an automated test battery. Neurobiology of Aging. 2009 doi: 10.1016/j.neurobiolaging.2008.07.007. Epub ahead of print. [DOI] [PMC free article] [PubMed] [Google Scholar]
- 35.Wu J, Basha MR, Brock B, Cox DP, Cardozo-Pelaez F, McPherson CA, Harry J, Rice DC, Maloney B, Chen D, Lahiri DK, Zawia NH. Alzheimer's disease (AD)-like pathology in aged monkeys after infantile exposure to environmental metal lead (Pb): evidence for a developmental origin and environmental link for AD. Journal of Neuroscience. 2008;28:3–9. doi: 10.1523/JNEUROSCI.4405-07.2008. [DOI] [PMC free article] [PubMed] [Google Scholar]
- 36.Morishima-Kawashima M, Oshima N, Ogata H, Yamaguchi H, Yoshimura M, Sugihara S, Ihara Y. Effect of apolipoprotein E allele epsilon4 on the initial phase of amyloid beta-protein accumulation in the human brain. Am J Pathol. 2000;157:2093–2099. doi: 10.1016/s0002-9440(10)64847-x. [DOI] [PMC free article] [PubMed] [Google Scholar]
- 37.Jeanmougin F, Thompson JD, Gouy M, Higgins DG, Gibson TJ. Multiple sequence alignment with Clustal X. TIBS. 1998;23:403–405. doi: 10.1016/s0968-0004(98)01285-7. [DOI] [PubMed] [Google Scholar]
- 38.Quandt K, Frech K, Karas H, Wingender E, Werner T. MatInd and MatInspector: new fast and versatile tools for detection of consensus matches in nucleotide sequence data. Nucleic Acids Research. 1995;23:4878–4884. doi: 10.1093/nar/23.23.4878. [DOI] [PMC free article] [PubMed] [Google Scholar]
- 39.Huang HY, Chien CH, Jen KH, Huang HD. RegRNA: an integrated web server for identifying regulatory RNA motifs and elements. Nucleic Acids Res. 2006;34:W429–434. doi: 10.1093/nar/gkl333. [DOI] [PMC free article] [PubMed] [Google Scholar]
- 40.Apelt J, Bigl M, Wunderlich P, Schliebs R. Aging-related increase in oxidative stress correlates with developmental pattern of beta-secretase activity and beta-amyloid plaque formation in transgenic Tg2576 mice with Alzheimer-like pathology. International Journal of Developmental Neuroscience. 2004;22:475–484. doi: 10.1016/j.ijdevneu.2004.07.006. [DOI] [PubMed] [Google Scholar]
- 41.Rossner S, Sastre M, Bourne K, Lichtenthaler SF. Transcriptional and translational regulation of BACE1 expression--implications for Alzheimer's disease. Progress in Neurobiology. 2006;79:95–111. doi: 10.1016/j.pneurobio.2006.06.001. [DOI] [PubMed] [Google Scholar]
- 42.Jeong SJ, Kim K, Suh YH. Age-related changes in the expression of Alzheimer's beta APP in the brain of senescence accelerated mouse (SAM)-P/10. Neuroreport. 1997;8:1733–1737. doi: 10.1097/00001756-199705060-00033. [DOI] [PubMed] [Google Scholar]
- 43.Brock B, Basha MR, DiPalma K, Anderson A, Harry GJ, Rice DC, Maloney B, Lahiri DK, Zawia NH. Co–localization and Distribution of Cerebral APP and SP1 and its Relationship to Amyloidogenesis. Journal of Alzheimers Disease. 2008;13:71–80. doi: 10.3233/jad-2008-13108. [DOI] [PMC free article] [PubMed] [Google Scholar]
- 44.Zohar O, Pick CG, Cavallaro S, Chapman J, Katzav A, Milman A, Alkon DL. Age-dependent differential expression of BACE splice variants in brain regions of tg2576 mice. Neurobiology of Aging. 2005;26:1167–1175. doi: 10.1016/j.neurobiolaging.2004.10.005. [DOI] [PubMed] [Google Scholar]
- 45.Chiocco MJ, Kulnane LS, Younkin L, Younkin S, Evin G, Lamb BT. Altered amyloid-beta metabolism and deposition in genomic-based beta-secretase transgenic mice. Journal of Biological Chemistry. 2004;279:52535–52542. doi: 10.1074/jbc.M409680200. [DOI] [PMC free article] [PubMed] [Google Scholar]
- 46.Sirinathsinghji DJ, Rigby M, Heavens RP, Smith D, Fernandez JM, Schuligoi R, Hill RG. Increased messenger RNA expression of the 695 and 751 amino acid isoforms of the beta-amyloid protein precursor in the thalamus of 17-year-old cynomolgus (Macaca fascicularis) monkeys. Neuroscience. 1995;65:51–57. doi: 10.1016/0306-4522(94)00485-n. [DOI] [PubMed] [Google Scholar]
- 47.Koo EH, Sisodia SS, Cork LC, Unterbeck A, Bayney RM, Price DL. Differential expression of amyloid precursor protein mRNAs in cases of Alzheimer's disease and in aged nonhuman primates. Neuron. 1990;4:97–104. doi: 10.1016/0896-6273(90)90446-m. [DOI] [PubMed] [Google Scholar]
- 48.Tanaka S, Liu L, Kimura J, Shiojiri S, Takahashi Y, Kitaguchi N, Nakamura S, Ueda K. Age-related changes in the proportion of amyloid precursor protein mRNAs in Alzheimer's disease and other neurological disorders. Brain Research Molecular Brain Research. 1992;15:303–310. doi: 10.1016/0169-328x(92)90122-r. [DOI] [PubMed] [Google Scholar]
- 49.Robinson CA, Clark AW, Parhad IM, Fung TS, Bou SS. Gene expression in Alzheimer neocortex as a function of age and pathologic severity. Neurobiology of Aging. 1994;15:681–690. doi: 10.1016/0197-4580(94)90049-3. [DOI] [PubMed] [Google Scholar]
- 50.Flood FM, Cowburn RF, Johnston JA. Presenilin-1, amyloid precursor protein and amyloid precursor-like protein 2 mRNA levels in human superior frontal cortex during aging. Neuroscience Letters. 1997;235:17–20. doi: 10.1016/s0304-3940(97)00697-6. [DOI] [PubMed] [Google Scholar]
- 51.Preece P, Cairns NJ. Quantifying mRNA in postmortem human brain: influence of gender, age at death, postmortem interval, brain pH, agonal state and inter-lobe mRNA variance. Brain Research Molecular Brain Research. 2003;118:60–71. doi: 10.1016/s0169-328x(03)00337-1. [DOI] [PubMed] [Google Scholar]
- 52.Bolin CM, Basha R, Cox D, Zawia NH, Maloney B, Lahiri DK, Cardozo-Pelaez F. Exposure to lead and the developmental origin of oxidative DNA damage in the aging brain. Faseb J. 2006;20:788–790. doi: 10.1096/fj.05-5091fje. [DOI] [PubMed] [Google Scholar]
- 53.Basha MR, Murali M, Siddiqi HK, Ghosal K, Siddiqi OK, Lashuel HA, Ge YW, Lahiri DK, Zawia NH. Lead (Pb) exposure and its effect on APP proteolysis and Abeta aggregation. Faseb J. 2005;19:2083–2084. doi: 10.1096/fj.05-4375fje. [DOI] [PubMed] [Google Scholar]
- 54.Song W, Lahiri DK. Molecular cloning of the promoter of the gene encoding the Rhesus monkey beta-amyloid precursor protein: structural characterization and a comparative study with other species. Gene. 1998;217:151–164. doi: 10.1016/s0378-1119(98)00337-0. [DOI] [PubMed] [Google Scholar]
- 55.Weise A, Lalonde S, Kuhn C, Frommer WB, Ward JM. Introns control expression of sucrose transporter LeSUT1 in trichomes, companion cells and in guard cells. Plant Mol Biol. 2008;68:251–262. doi: 10.1007/s11103-008-9366-9. [DOI] [PubMed] [Google Scholar]
- 56.Blount AL, Vaughan JM, Vale WW, Bilezikjian LM. A Smad-binding element in intron 1 participates in activin-dependent regulation of the follistatin gene. J Biol Chem. 2008;283:7016–7026. doi: 10.1074/jbc.M709502200. [DOI] [PubMed] [Google Scholar]
- 57.Ge YW, Maloney B, Sambamurti K, Lahiri DK. Functional characterization of the 5′ flanking region of the BACE gene: identification of a 91 bp fragment involved in basal level of BACE promoter expression. FASEB Journal. 2004;18:1037–1039. doi: 10.1096/fj.03-1379fje. [DOI] [PubMed] [Google Scholar]
- 58.Soucek T, Cumming R, Dargusch R, Maher P, Schubert D. The regulation of glucose metabolism by HIF-1 mediates a neuroprotective response to amyloid beta peptide. Neuron. 2003;39:43–56. doi: 10.1016/s0896-6273(03)00367-2. [DOI] [PubMed] [Google Scholar]
- 59.Zhang X, Zhou K, Wang R, Cui J, Lipton SA, Liao FF, Xu H, Zhang YW. Hypoxia-inducible factor 1alpha (HIF-1alpha)-mediated hypoxia increases BACE1 expression and beta-amyloid generation. Journal of Biological Chemistry. 2007;282:10873–10880. doi: 10.1074/jbc.M608856200. [DOI] [PubMed] [Google Scholar]
- 60.MacKenzie F, Duriez P, Wong F, Noseda M, Karsan A. Notch4 inhibits endothelial apoptosis via RBP-Jkappa-dependent and -independent pathways. Journal of Biological Chemistry. 2004;279:11657–11663. doi: 10.1074/jbc.M312102200. [DOI] [PubMed] [Google Scholar]
- 61.Jones FS, Meech R. Knockout of REST/NRSF shows that the protein is a potent repressor of neuronally expressed genes in non-neural tissues. Bioessays. 1999;21:372–376. doi: 10.1002/(SICI)1521-1878(199905)21:5<372::AID-BIES3>3.0.CO;2-3. [DOI] [PubMed] [Google Scholar]
- 62.He ML, Chen Y, Peng Y, Jin D, Du D, Wu J, Lu P, Lin MC, Kung HF. Induction of apoptosis and inhibition of cell growth by developmental regulator hTBX5. Biochemical and Biophysical Research Communications. 2002;297:185–192. doi: 10.1016/s0006-291x(02)02142-3. [DOI] [PubMed] [Google Scholar]
- 63.Roussigne M, Cayrol C, Clouaire T, Amalric F, Girard JP. THAP1 is a nuclear proapoptotic factor that links prostate-apoptosis-response-4 (Par-4) to PML nuclear bodies. Oncogene. 2003;22:2432–2442. doi: 10.1038/sj.onc.1206271. [DOI] [PubMed] [Google Scholar]
- 64.Levy S, Avni D, Hariharan N, Perry RP, Meyuhas O. Oligopyrimidine tract at the 5′ end of mammalian ribosomal protein mRNAs is required for their translational control. Proceedings of the National Academy of Sciences of the United States of America. 1991;88:3319–3323. doi: 10.1073/pnas.88.8.3319. [DOI] [PMC free article] [PubMed] [Google Scholar]
- 65.Venti A, Giordano T, Eder P, Bush AI, Lahiri DK, Greig NH, Rogers JT. The integrated role of desferrioxamine and phenserine targeted to an iron-responsive element in the APP-mRNA 5′-untranslated region. Annals of the New York Academy of Sciences. 2004;1035:34–48. doi: 10.1196/annals.1332.003. [DOI] [PubMed] [Google Scholar]
- 66.Morse LJ, Payton SM, Cuny GD, Rogers JT. FDA-preapproved drugs targeted to the translational regulation and processing of the amyloid precursor protein. J Mol Neurosci. 2004;24:129–136. doi: 10.1385/JMN:24:1:129. [DOI] [PubMed] [Google Scholar]
- 67.Lytle JR, Yario TA, Steitz JA. Target mRNAs are repressed as efficiently by microRNA-binding sites in the 5′ UTR as in the 3′ UTR. Proceedings of the National Academy of Sciences of the United States of America. 2007;104:9667–9672. doi: 10.1073/pnas.0703820104. [DOI] [PMC free article] [PubMed] [Google Scholar]
- 68.Verrotti AC, Thompson SR, Wreden C, Strickland S, Wickens M. Evolutionary conservation of sequence elements controlling cytoplasmic polyadenylylation. Proceedings of the National Academy of Sciences of the United States of America. 1996;93:9027–9032. doi: 10.1073/pnas.93.17.9027. [DOI] [PMC free article] [PubMed] [Google Scholar]
- 69.Young-Pearse TL, Bai J, Chang R, Zheng JB, LoTurco JJ, Selkoe DJ. A critical function for beta-amyloid precursor protein in neuronal migration revealed by in utero RNA interference. Journal of Neuroscience. 2007;27:14459–14469. doi: 10.1523/JNEUROSCI.4701-07.2007. [DOI] [PMC free article] [PubMed] [Google Scholar]
- 70.Porayette P, Gallego MJ, Kaltcheva MM, Meethal SV, Atwood CS. Amyloid-beta precursor protein expression and modulation in human embryonic stem cells: a novel role for human chorionic gonadotropin. Biochemical and Biophysical Research Communications. 2007;364:522–527. doi: 10.1016/j.bbrc.2007.10.021. [DOI] [PubMed] [Google Scholar]
- 71.Vasudevan S, Tong Y, Steitz JA. Switching from repression to activation: microRNAs can up-regulate translation. Science. 2007;318:1931–1934. doi: 10.1126/science.1149460. [DOI] [PubMed] [Google Scholar]
- 72.Nistor M, Don M, Parekh M, Sarsoza F, Goodus M, Lopez GE, Kawas C, Leverenz J, Doran E, Lott IT, Hill M, Head E. Alpha- and beta-secretase activity as a function of age and beta-amyloid in Down syndrome and normal brain. Neurobiology of Aging. 2007;28:1493–1506. doi: 10.1016/j.neurobiolaging.2006.06.023. [DOI] [PMC free article] [PubMed] [Google Scholar]
- 73.Shiiki T, Ohtsuki S, Kurihara A, Naganuma H, Nishimura K, Tachikawa M, Hosoya K, Terasaki T. Brain insulin impairs amyloid-beta(1-40) clearance from the brain. Journal of Neuroscience. 2004;24:9632–9637. doi: 10.1523/JNEUROSCI.2236-04.2004. [DOI] [PMC free article] [PubMed] [Google Scholar]
- 74.Maloney B, Ge YW, Alley GM, Lahiri DK. Important Differences between human and mouse APOE gene promoters with implications for Alzheimer's disease. Journal of Neurochemistry. 2007;103:1237–1257. doi: 10.1111/j.1471-4159.2007.04831.x. [DOI] [PubMed] [Google Scholar]
- 75.Wu J, Basha MR, Brock B, Maloney B, Cox D, Harry J, Cardozo-Paleaz F, Rice DC, Lahiri DK, Zawia NH. Alzheimer's disease (AD)-like pathology in aged monkeys after infantile exposure to environmental metal lead (Pb): evidence for a developmental origin and environmental link for AD. Journal of Neuroscience. 2008;28:3–9. doi: 10.1523/JNEUROSCI.4405-07.2008. [DOI] [PMC free article] [PubMed] [Google Scholar]
- 76.Chan A, Shea TB. Supplementation with apple juice attenuates presenilin-1 overexpression during dietary and genetically-induced oxidative stress. Journal of Alzheimers Disease. 2006;10:353–358. doi: 10.3233/jad-2006-10401. [DOI] [PubMed] [Google Scholar]
- 77.Lahiri DK, Maloney B, Basha MR, Ge YW, Zawia NH. How and when environmental agents and dietary factors affect the course of Alzheimer's disease: the “LEARn” model (Latent Early Associated Regulation) may explain the triggering of AD. Current Alzheimer Research. 2007;4:219–228. doi: 10.2174/156720507780362164. [DOI] [PubMed] [Google Scholar]
- 78.Cohen J. Relative differences: The myth of 1% Science. 2007;316:1836. doi: 10.1126/science.316.5833.1836. [DOI] [PubMed] [Google Scholar]
- 79.Lahiri DK, Maloney B. Genes are not our destiny: the somatic epitype bridges between the genotype and the phenotype. Nature Review of Neuroscience. 2006;7 doi: 10.1038/nrn2022-c1. [DOI] [Google Scholar]
- 80.Beck M, Bigl V, Rossner S. Guinea pigs as a nontransgenic model for APP processing in vitro and in vivo. Neurochemical Research. 2003;28:637–644. doi: 10.1023/a:1022850113083. [DOI] [PubMed] [Google Scholar]
- 81.Hattori M, Tsukahara F, Furuhata Y, Tanahashi H, Hirose M, Saito M, Tsukuni S, Sakaki Y. A novel method for making nested deletions and its application for sequencing of a 300 kb region of human APP locus. Nucleic Acids Research. 1997;25:1802–1808. doi: 10.1093/nar/25.9.1802. [DOI] [PMC free article] [PubMed] [Google Scholar]