Abstract
Introduction:
In the inaccessible areas on the crown the removal of calculus and stains by hand and ultrasonic instrumentation is the method for cleaning to preserve and increase the longevity of the restoration. However, when oral prophylaxis is performed on restorative crowns, it may produce some surface alterations and may favour plaque accumulation.
Statement of Problem:
Many patients may have restored their teeth with artificial crowns and would come to the dental office for oral prophylaxis. If a routine oral prophylaxis is followed, its effect on the restorative materials and the plaque accumulation can be studied.
Materials and Methods:
A total of 15 disc shaped wax patterns were invested and casted for cast titanium (Group A) and the remaining 15 disk shaped for nickel-chromium (Group B). The obtained castings were finished and polished. All the specimens were subjected to hand and ultrasonic scaling for 15 s. Profilometer and scanning electron microscopic was used to analyze and evaluate the surface roughness. Specimens of each group were embedded on the anterior lingual aspects of the removable lower retention plates. 5 volunteers were asked to wear it in the mouth for 24 h for 7 days. After 7 days, the specimens were stained with plaque disclosing solutions and the photomicrographs were taken by the optical stereomicroscope and the plaque accumulations were assessed in percentage.
Results:
The difference in average surface roughness (μm) of the polished test specimens was maximum for ultrasonic scaling than hand scaling and maximum for Group A than Group B. Plaque accumulation in percentage on the treated specimens was found to be nonsignificant but, mean plaque accumulation was maximum on ultrasonic scaling surface than hand scaling and maximum for Group A than Group B. Surface roughness was found to be statistically significant after hand scaling (F = 9.377, P = 0.000) and ultrasonic scaling (F = 5.373, P = 0.0000) by Student t-test.
Conclusion:
The Surface roughness and plaque accumulation on the specimens were more for Group A than Group B and maximum produced by ultrasonic scaling than hand scaling.
Keywords: Nickel-chromium alloy, titanium alloy, surface roughness, ultrasonic scaling, Hand scaling
INTRODUCTION
There are many reasons for the failure of restored teeth. The two most important being the periodontitis and the secondary caries for which the main etiological factor is dental plaque.[1,2] Dental plaque can be defined as the soft deposit that forms a biofilm adhering to the tooth surface or other hard surfaces on the oral cavity including removable partial denture and fixed restoration.[2]
Dental plaque formation is influenced by the surface free energy of the bacteria and by the free energy and roughness of the plaque accumulatory substratum. Plaque adheres better and retain more quickly on rough surfaces.[3,4,5] The other factors, which follow the accumulation of plaque are the placement of the restorative margins contour of the restorations, the type of restorative materials and the patient's oral hygiene.[6]
Different artificial crown materials namely: Nickel-chromium porcelain resin cobalt-chromium cast gold have different surface texture or surface roughness which is one of the various factors for plaque accumulation. Chan and Weber[7] concluded in their study that the plaque retention on teeth restored with full ceramic crowns is less when compared with acrylic resin veneer crowns.
Removal of plaque in inaccessible areas such as gingiva and the restorative margins are possible only by the prophylactic instrumentation. Ideally professional instrumentation of periodontally diseased teeth should include complete removal of plaque calculus and other bacterial components from the tooth surface with no or minimal sacrifice of healthy tooth substance and no production of surface roughness.[1]
Unfortunately, results from prophylactic instrumentation and methods available have revealed considerable iatrogenic effects such as surface roughness and loss of tooth structure. Garnick and Dent[8] in their study showed that the topography on the tooth surface resulting from hand instrumentation appeared smooth with parallel scratches. With ultrasonic instrumentation, the surface appeared scaly and rough with occasional deep gouges. Adamczyk and Spiechowicz[9] in their study found that there was a tendency to form more dental plaque on metal crowns within 24 h, and the plaque were closely packed. Large amount of plaque on acrylic resin restoration were seen but were more loosely packed. The least of plaque accumulation was seen on porcelain restoration and were more loosely packed. They also said that the retention of plaque increases with increase surface roughness of the restorative material.
Gantes and Nilveus[10] in their comparative study they found the effect of different hygiene instruments on the titanium surface by scanning electron observations. They concluded that Rubber cup with pumice steel hand scalers sonic scalers with metal tips and air powder devices using soda should be avoided as they removed the ridge height of 0.11 mm at 15 s and the base of the ridge after 30 s of instrumentation.
When the dentition is restored with different metal crowns or bridges that are titanium. nickel-chromium cobalt-chromium it is difficult for the clinician to differentiate from which material the bridge or crown is made up of. If the routine oral prophylaxis is performed especially on the titanium restorations without any special instrumental care, the surface roughness created by the instrumentation may increase the plaque retention high risk of caries and periodontitis.
Therefore this study examined the effect of oral prophylactic instrumentation on different artificial crown materials with the objectives being. To evaluate and compare the surface roughness produced by hand scaling and ultrasonic scaling. To evaluate the plaque accumulation on the surface of the artificial crown materials after treating them with oral prophylactic instruments.
MATERIALS AND METHODS
The study comprises of two parts in which the first part consists of an in vitro study dealing with the hand and ultrasonic instrumentation on artificial crown materials. The resulted surface alterations were evaluated by a profilometer and scanning electron microscopic (SEM). The second part studies the amount of plaque formed on the treated surface of the crown materials was assessed in vivo by calculating the percentage of surface of plaque accumulation on the photographs obtained by the optical stereomicroscope.
Sample fabrication
Disc shaped, 30 wax patterns measuring 11 mm in diameter and 1 mm in thickness were made by flowing inlay casting wax into the rubber mould with an electrical waxer. Each specimen was divided into three equal divisions with the help of the reference mark incorporated in the rubber mould. Fifteen specimens were spread and attached to the crucible former in one 6x ring at a time.
For titanium discs (Group A) the casting of the specimen was carried out in the titanium casting machine using Orotig 36 g titanium pellets (Orotig, Verona, Italy). For nickel-chromium casting (Group B), the casting was performed using Vera Bond II pellets (nonberyllium Aalbadent, Cordelia, USA). Finishing and polishing were carried out in one direction from the center to the periphery for all specimens as per the manufacturer's instructions.
Surface roughness assessment
All the specimens were numbered from 1 to 15 in each group, which were embedded in the stone block. The surface of each specimen had three divisions. At the periphery of one division, a single notch and on the other division a double notch was made, using straight fissure bur, for identification of the area for hand scaling and ultrasonic scaling respectively. The third division was untouched and was used as control for the second part of the study. Hand scaling was carried out using surface hand scaler and interdental scaler (Manipal, Mangalore, India) for 15 s in the direction of the finishing and polishing of each specimen of the representative division. Approximately, the same hand pressure was maintained during hand scaling for all specimens [Figure 1].[11]
Figure 1.
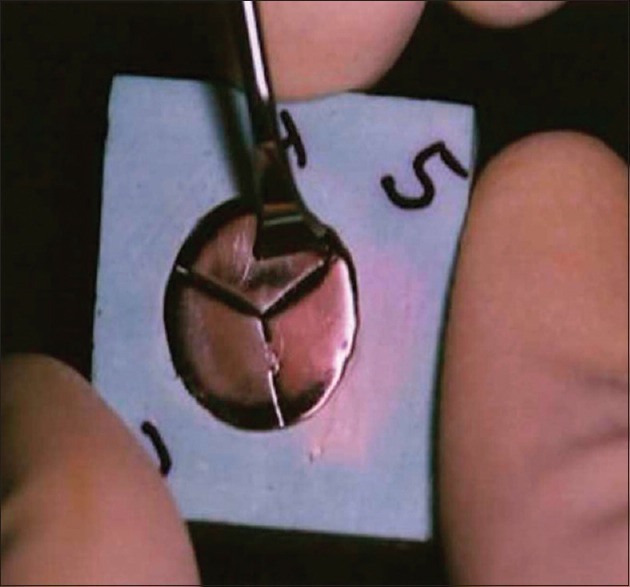
Hand scaling on the representative division of the specimen
Ultrasonic scaling using regular surface and interdental tips (Cavitron, Bobcat, USA) was carried out on the divisions having a double notch, at 30 KHz with medium power setting. The tip of the ultrasonic scaler was held perpendicular to the surface with back and forth motion. A continuous water spray on the working area was maintained.[12] Each instrumentation was done for 15 s [Figure 2].
Figure 2.
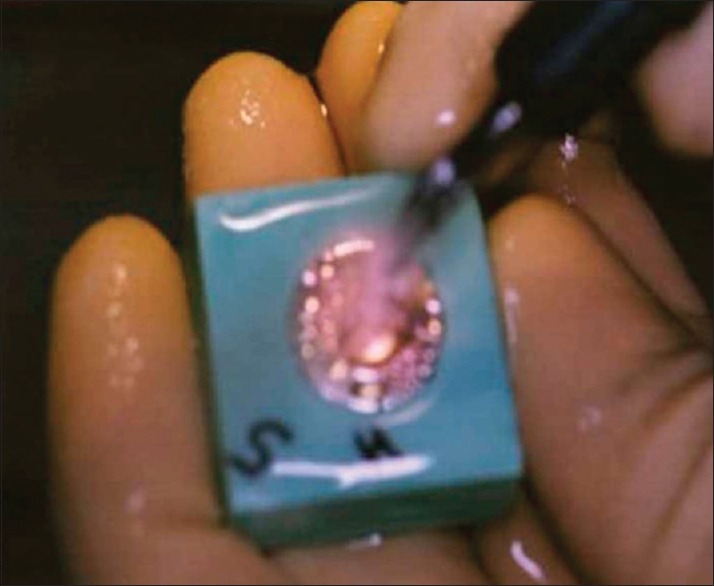
Ultrasonic scaling on the representative division of the specimen
A surface analyzer, profilometer[3,13] (Taylor Hobson, Rank Taylor Hobson Ltd., England) was used to assess the surface roughness. Its stylus was made to run with a traverse length of 4 mm and cut-off length of 0.8 mm on the surface of each division of each specimen, before and after scaling in the opposite direction. All profilometer readings were made as close as possible to the center of each division. The average surface roughness (Ra) value obtained from the profilometer quantified the mean height of the profile above and below the center line. These values formed the basic data for the part of the study and were subjected to statistical analysis. From each group of specimen, one sample was selected at random and was prepared for SEM evaluation[2,10,14] (JSM 840A SEM, JEOL). The photomicrographs of the representative areas of each division of each group were obtained for qualitative evaluation of the surface topography.
Plaque accumulation assessment
Plaque accumulation was assessed for five test specimens of each group embedded in the lingual anterior aspects of the removable lower retention plates. They were worn in the mouth for 7 days. Five healthy individuals, aged 20 to 24 years, having apparently good oral hygiene voluntarily participated in the study. They were thoroughly informed about the study details.
Before starting the second part of the study, for each of the volunteer mandibular retention plate (without labial bow) was constructed and checked for comfort during its use. In the retention plate for each volunteer one specimen of Group A and one specimen of Group B was embedded at a time, using cold cure acrylic resin exposing the test surface (i.e., subjected to scaling) lingually.
Each volunteer was asked to wear the retention plate for 24 h a day for 7 days. After 7 days, the test specimens were cut sagitally and stained with plaque disclosing solution and observed under an optical stereomicroscope (Olympus DF Plapo IX PF, Japan). Photographs (4 × 6 inches) were taken of the specimens in ×10.5 magnification for comparison, after removing the retention plate with embedded Group A and B specimens.
The plaque assessment was done by the same operator, the total surface area as well as the plaque accumulated surface area of each division of each specimen was calculated by placing the photocopied over head projector (OHP) graph sheet on the photograph of test specimens which were obtained through the optical stereomicroscope [Figure 3]. The number of small squares covered by the graph sheet of the plaque accumulated surface and the total surface of each specimen was counted and thereby the Percentage of plaque accumulation was calculated using the following formula:
Figure 3.
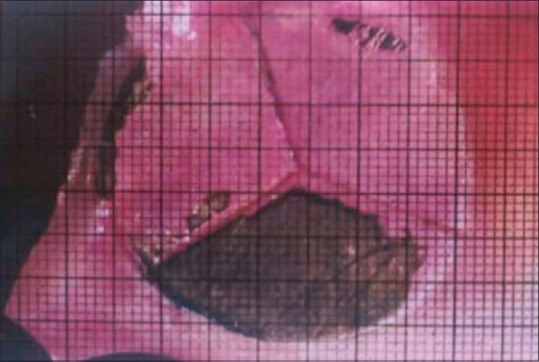
OHP graph sheet on the photograph of test specimens, obtained through optical stereomicroscope

The percentage values obtained were tabulated and subjected to statistical analysis.
RESULTS
The values with respect to the average surface roughness in micrometer (of hand scaling and ultrasonic scaling as well as the difference in the value of the polished test specimens of the groups A, and B have been presented in Tables 1–3. The percentage of surface area covered by plaque on the hand scaling and ultrasonic scaling, as well as the control test specimens, have been presented in Tables 4–6.
Table 1.
Mean and standard deviation, minimum and maximum values and coefficient of variation of difference in average surface roughness values after H/S and U/S of polished test specimens of the Groups A (cast titanium discs) and B (nickel-chromium alloy discs)
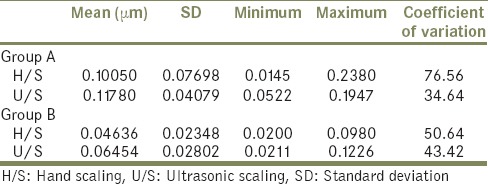
Table 3.
Statistical comparison (student's t-test) of the mean of the difference in average surface roughness of the specimens between the Groups A and B after H/S and U/S

Table 4.
Statistical analysis by one-way ANOVA to compare the percentage of surface area covered by plaque on specimens of the Group A between control, H/S and U/S
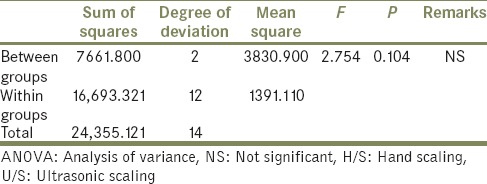
Table 6.
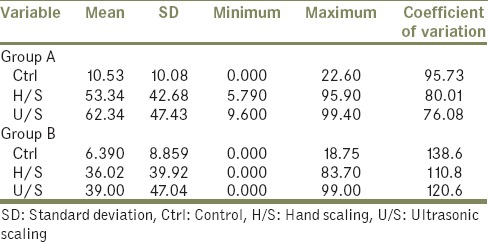
Mean and standard deviation, minimum and maximum values of the percentage of surface area covered by the plaque on the specimens of the Groups A and B on Ctrl, H/S and U/S surface
DISCUSSION
Many researchers in the dental literature have revealed a lot of interest to assess the effect of prophylactic instrumentation on teeth[8,15,16] crown materials[2,10] the plaque accumulation[9,17,18,19,20] and the plaque retaining capacity[7] of the crown materials.
When oral prophylaxis is done on different materials, it may produce surface alterations. Therefore, this study concluded with the objectives: To assess the surface of the artificial crown materials after hand and ultrasonic scaling and to assess the plaque accumulation on the surface of the artificial crown materials after treating them with hand and ultrasonic scaling. The surface alterations produced by scaling may be due to the differences in the pressure applied. The angulation of the tip, and the surface hardness of the material. The initial surface roughness of the crown material, and the contour of the restoration.
Hand scaling was carried out with a surface hand scaler and interdental scaler for 15 s in the direction of finishing and polishing surfaces of each specimen. The ultrasonic scaling using regular surface and interdental tips (Cavitron) was carried out on the other division with medium power setting for 15 s. The tip of the ultrasonic scaler was held perpendicular to the surface with a continuous water spray on the working area.[2,12]
According to Walmsley et al. in 1998 there was an increase in plaque removal with the water cooled scaling tip over the non-water cooled tip by approximately six folds if oscillations was directed parallel to the tooth surface and eight folds if the scaling tip was perpendicular to the tooth surface. The reason being the cavitational activity in the cooling water supply. Approximately same hand pressure was applied for all the specimens during hand and ultrasonic scaling.[11]
To assess the surface roughness surface analyzer; profilometer[3,13] was used. Its stylus was made to run 4 mm with cut off length 0.8 mm before and after hand scaling and ultrasonic scaling in an opposite direction so that it records all the grooves produced by scaling. SEM evaluation was also considered[2,10,14] for the same. According to the mean of differences in average surface roughness values after hand scaling and ultrasonic scaling was maximum for titanium that is, Group A (H/S = 0.10050 μm and U/S = 0.11780 μm) and minimum for nickel-chromium that is, Group B (H/S = 0.04636 μm and U/S = 0.06454 μm). Among the groups different in average surface roughness values was maximum for ultrasonic scaling and minimum for hand scaling [Table 1]. Upon statistical comparison (Paired t-test) the difference in average surface roughness values was significant between hand scaling and ultrasonic scaling of the groups A, and B (P = 0.0000) [Table 2].
Table 2.
Statistical comparison (paired t-test) of the mean of the difference in average surface roughness of specimens between the H/S and U/S of the Groups A and B

Student ‘t’ test was done for the mean of difference in average surface roughness of the specimens between the groups A, and B after hand scaling (F = 9.377, P = 0.0000) and ultrasonic scaling (F = 5.373, P = 0.0000) [Table 3], and found significant for all the groups.
By SEM photographic comparison, it was found that there were more surface alterations for the ultrasonic scaling for both the groups when compared with hand scaling. On titanium, hand scaling surface [Figure 4], the grooves appeared sharp, smooth and parallel. For ultrasonic scaling surface [Figure 5] the grooves were wider, rougher, irregular, and scaly. Gantes and Nilveus[10] showed a lot of structural alteration on the titanium surface after hand scaling by Gracey curettes, where the ridge 0.11 mm high and 0.55 mm wide was completely removed from the cylinder of the titanium surface. For nickel-chromium alloy on the hand scaling surface [Figure 6] the grooves were faint and parallel, on the ultrasonic scaling surface [Figure 7] the grooves were sharper, wider and more parallel. All these features coincide with the profilometer readings.
Figure 4.
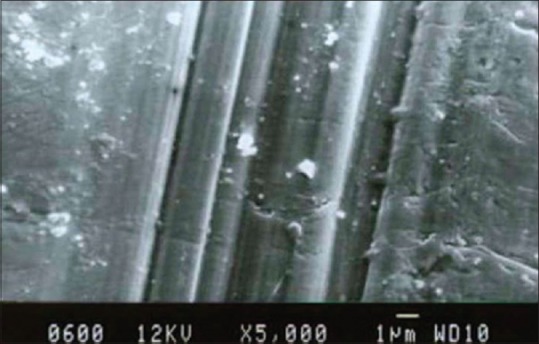
Scanning electron microscopic photograph representing the hand scaling on Titanium surface
Figure 5.
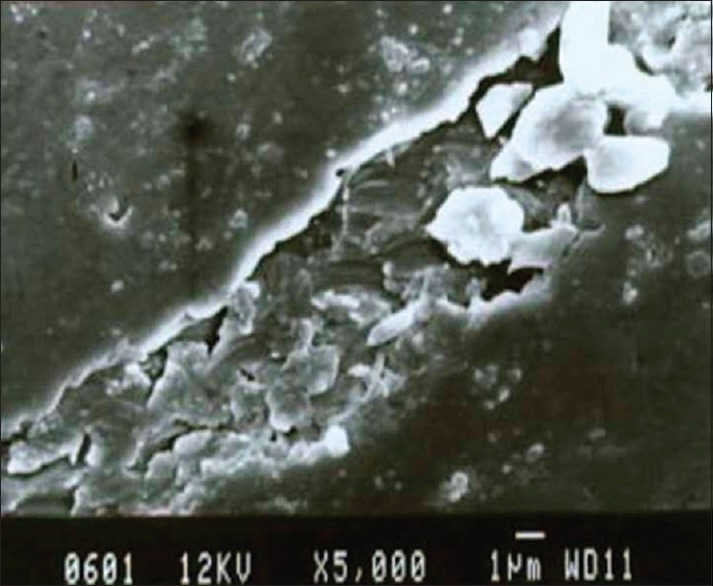
Scanning electron microscopic photograph representing the ultrasonic scaling on the titanium surface
Figure 6.
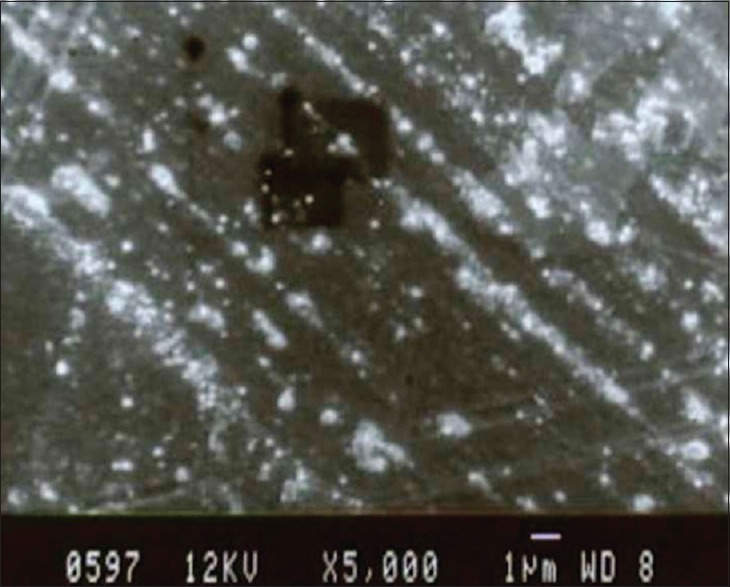
Scanning electron microscopic photograph representing the hand scaling on nickel-chromium surface
Figure 7.
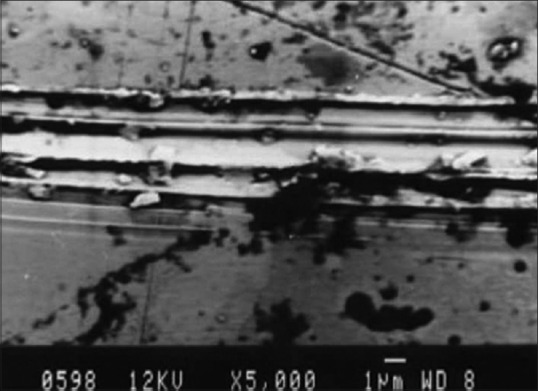
Scanning electron microscopic photograph representing the ultrasonic scaling on nickel-chromium surface
The surface hardness and the microstructural nature of the specimen would result in abrasion resistance.[21] The Vicker's hardness number for nickel-chromium and cast titanium is 270–350 and 10–210[22], respectively. The resulted surface topography after instrumentation from this study coincides with Garnick and Dent[8] findings but was opposite to Ewen and Gwinnett findings. The difference in the results may be because the study was done on the natural teeth, the methods of processing the specimens, the type of surface analyzer used the technique of instrumentation.
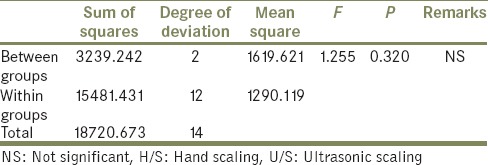
In the second part of the study to assess the plaque accumulation on the treated surfaces the in vivo specimens were cut, and photomicrograph for five volunteers were obtains using an optical stereomicroscope of ×10.5 magnification. The photomicrograph of two volunteer tests specimen's had a very low plaque accumulation. In the other three volunteers test specimen's had a very low plaque accumulation. Hence, there was a lot of standard deviation, which led to a statistically nonsignificant (ANOVA) results of the Group A (F = 2.754, P = 0.104) and Group B (F = 1.255, P = 0.320) [Tables 4 and 5].
Table 5.
Statistical analysis by one-way ANOVA to compare the percentage of surface area covered by plaque on specimens of the Group B between control, H/S and U/S
When the mean percentage of plaque accumulation of the control, hand scaled and ultrasonic scaled specimens of all groups of 5 volunteers was considered, it was found that least amount of plaque accumulated on the control surface and maximum on the ultrasonic surface. Between the groups it was found that maximum amount of plaque accumulated on the titanium surface that is, Group A (Ctrl = 10.53, H/S = 53.34, U/S = 62.34), then the nickel-chromium that is, Group B (Ctrl = 6.39, H/S = 36.02, U/S = 39.00) [Table 6].
Profilometric readings and SEM photographic comparison, revealed the differences in average surface roughness values and the surface alterations which was more for cast titanium than nickel-chromium. The plaque accumulation is influenced by the surface free energy[3,4] and surface roughness[1,3,4,5,6] of the material. Higher the melting point or alloy, the higher the free surface energy and higher energy surfaces, which will adsorb molecules of salivary glycoproteins and have a comparative close packing.[3,9]
Limitations of the study
A constant scaling pressure was not applied on all specimens. However, same hand pressure was maintained during hand scaling for all the specimens
Ideally, after hand scaling and ultrasonic scaling, polishing is mandatory but in this study polishing was not done on the scaled surface of the specimens
Plaque accumulation was assessed by placing the treated specimens on the lower anterior lingual region, but the submandibular and the parotid duct regions were not considered
The stylus of the profilometer was made to run on the same path before and after scaling, but there may be a slight deviation while orienting the stylus on the same path.
Clinical implications
In this study the results showed that routine hand scaling and the ultrasonic scaling on nickel-chromium alloy and cast titanium specimens resulted in surface roughness which favor the plaque accumulation. Dentist and auxiliary personal should be aware of the untoward consequences of these instruments.
CONCLUSION
The hand scaling and ultrasonic scaling on cast titanium and nickel-chromium crown materials were evaluated, and the plaque accumulation on these treated specimens was observed. Within the limitations of the study the following conclusions were made:
The hand scaling done on the test specimen surface showed less surface roughness than ultrasonic scaling in both the Groups
Titanium test specimen's surface had more surface roughness than nickel-chromium
Greater plaque accumulation was observed for ultrasonic scaling than hand scaling in both the groups
The plaque accumulation was more on cast titanium surface compared to nickel-chromium.
ACKNOWLEDGMENT
The authors thank esteemed Professor Late Dr. Narendra P. Patil for the knowledge he has shared and for his kind support in finishing this work.
Footnotes
Source of Support: Nil
Conflict of Interest: None.
REFERENCES
- 1.Newman MG, Takei HH, Klokkevold PR, Carranza FA. Carrranza's Clinical Periodontology. Missouri: Elsevier; 2012. [Google Scholar]
- 2.Vermilyea SG, Prasanna MK, Agar JR. Effect of ultrasonic cleaning and air polishing on porcelain labial margin restorations. J Prosthet Dent. 1994;71:447–52. doi: 10.1016/0022-3913(94)90181-3. [DOI] [PubMed] [Google Scholar]
- 3.Quirynen M, Marechal M, Busscher HJ, Weerkamp AH, Darius PL, van Steenberghe D. The influence of surface free energy and surface roughness on early plaque formation. An in vivo study in man. J Clin Periodontol. 1990;17:138–44. doi: 10.1111/j.1600-051x.1990.tb01077.x. [DOI] [PubMed] [Google Scholar]
- 4.Quirynen M, Bollen CM. The influence of surface roughness and surface-free energy on supra- and subgingival plaque formation in man. A review of the literature. J Clin Periodontol. 1995;22:1–14. doi: 10.1111/j.1600-051x.1995.tb01765.x. [DOI] [PubMed] [Google Scholar]
- 5.Leknes KN. The influence of anatomic and iatrogenic root surface characteristics on bacterial colonization and periodontal destruction: A review. J Periodontol. 1997;68:507–16. doi: 10.1902/jop.1997.68.6.507. [DOI] [PubMed] [Google Scholar]
- 6.Gharechahi M, Moosavi H, Forghani M. Effect of surface roughness and materials composition on biofilm formation. J Biomater Nanobiotechnol. 2012;3:541–6. [Google Scholar]
- 7.Chan C, Weber H. Plaque retention on teeth restored with full-ceramic crowns: A comparative study. J Prosthet Dent. 1986;56:666–71. doi: 10.1016/0022-3913(86)90140-x. [DOI] [PubMed] [Google Scholar]
- 8.Garnick JJ, Dent J. A scanning electron micrographical study of root surfaces and subgingival bacteria after hand and ultrasonic instrumentation. J Periodontol. 1989;60:441–7. doi: 10.1902/jop.1989.60.8.441. [DOI] [PubMed] [Google Scholar]
- 9.Adamczyk E, Spiechowicz E. Plaque accumulation on crowns made of various materials. Int J Prosthodont. 1990;3:285–91. [PubMed] [Google Scholar]
- 10.Gantes BG, Nilveus R. The effects of different hygiene instruments on titanium surfaces: SEM observations. Int J Periodontics Restorative Dent. 1991;11:225–39. [PubMed] [Google Scholar]
- 11.Zappa U, Cadosch J, Simona C, Graf H, Case D. In vivo scaling and root planing forces. J Periodontol. 1991;62:335–40. doi: 10.1902/jop.1991.62.5.335. [DOI] [PubMed] [Google Scholar]
- 12.Walmsley AD, Laird WR, Williams AR. Dental plaque removal by cavitational activity during ultrasonic scaling. J Clin Periodontol. 1988;15:539–43. doi: 10.1111/j.1600-051x.1988.tb02126.x. [DOI] [PubMed] [Google Scholar]
- 13.Weitman RT, Eames WB. Plaque accumulation on composite surfaces after various finising procedures. J Am Dent Assoc. 1975;91:101–6. doi: 10.14219/jada.archive.1975.0294. [DOI] [PubMed] [Google Scholar]
- 14.Brookshire FV, Nagy WW, Dhuru VB, Ziebert GJ, Chada S. The qualitative effects of various types of hygiene instrumentation on commercially pure titanium and titanium alloy implant abutments: An in vitro and scanning electron microscope study. J Prosthet Dent. 1997;78:286–94. doi: 10.1016/s0022-3913(97)70028-3. [DOI] [PubMed] [Google Scholar]
- 15.Jotikasthira NE, Lie T, Leknes KN. Comparative in vitro studies of sonic, ultrasonic and reciprocating scaling instruments. J Clin Periodontol. 1992;19:560–9. doi: 10.1111/j.1600-051x.1992.tb00684.x. [DOI] [PubMed] [Google Scholar]
- 16.Ewen SJ, Gwinnett AJ. A scanning electron microscopic study of teeth following periodontal instrumentation. J Periodontol. 1977;48:92–7. doi: 10.1902/jop.1977.48.2.92. [DOI] [PubMed] [Google Scholar]
- 17.Kohavi D, Klinger A, Steinberg D, Sela MN. Adsorption of salivary proteins onto prosthetic titanium components. J Prosthet Dent. 1995;74:531–4. doi: 10.1016/s0022-3913(05)80357-9. [DOI] [PubMed] [Google Scholar]
- 18.Leonhardt A, Olsson J, Dahlén G. Bacterial colonization on titanium, hydroxyapatite, and amalgam surfaces in vivo . J Dent Res. 1995;74:1607–12. doi: 10.1177/00220345950740091701. [DOI] [PubMed] [Google Scholar]
- 19.Rimondini L, Farè S, Brambilla E, Felloni A, Consonni C, Brossa F, et al. The effect of surface roughness on early in vivo plaque colonization on titanium. J Periodontol. 1997;68:556–62. doi: 10.1902/jop.1997.68.6.556. [DOI] [PubMed] [Google Scholar]
- 20.Siegrist BE, Brecx MC, Gusberti FA, Joss A, Lang NP. In vivo early human dental plaque formation on different supporting substances. A scanning electron microscopic and bacteriological study. Clin Oral Implants Res. 1991;2:38–46. doi: 10.1034/j.1600-0501.1991.020105.x. [DOI] [PubMed] [Google Scholar]
- 21.Knoernschild KL, Lefebvre CA, Schuster GS, Payant LM, Gagnon FM. Endotoxin adherence to and elution from two casting alloys. Int J Prosthodont. 1994;7:22–9. [PubMed] [Google Scholar]
- 22.Wang RR, Fenton A. Titanium for prosthodontic applications: A review of the literature. Quintessence Int. 1996;27:401–8. [PubMed] [Google Scholar]


