

Abstract
Objective:
To perform whole-brain morphometry in patients with frontal lobe epilepsy and evaluate the utility of group-level patterns for individualized diagnosis and prognosis.
Methods:
We compared MRI-based cortical thickness and folding complexity between 2 frontal lobe epilepsy cohorts with histologically verified focal cortical dysplasia (FCD) (13 type I; 28 type II) and 41 closely matched controls. Pattern learning algorithms evaluated the utility of group-level findings to predict histologic FCD subtype, the side of the seizure focus, and postsurgical seizure outcome in single individuals.
Results:
Relative to controls, FCD type I displayed multilobar cortical thinning that was most marked in ipsilateral frontal cortices. Conversely, type II showed thickening in temporal and postcentral cortices. Cortical folding also diverged, with increased complexity in prefrontal cortices in type I and decreases in type II. Group-level findings successfully guided automated FCD subtype classification (type I: 100%; type II: 96%), seizure focus lateralization (type I: 92%; type II: 86%), and outcome prediction (type I: 92%; type II: 82%).
Conclusion:
FCD subtypes relate to diverse whole-brain structural phenotypes. While cortical thickening in type II may indicate delayed pruning, a thin cortex in type I likely results from combined effects of seizure excitotoxicity and the primary malformation. Group-level patterns have a high translational value in guiding individualized diagnostics.
Focal cortical dysplasia (FCD) is a frequent epileptogenic developmental malformation in children and adults undergoing epilepsy surgery.1 While FCD type II combining cytological anomalies with varying degrees of dyslamination2 is generally associated with obvious morphology and signal changes on MRI,3 the imaging signature of FCD type I, characterized by subtle cortical thinning and dyslamination,2 remains elusive.
Because of the crucial role of MRI in defining the surgical target, imaging studies in FCD have been primarily dedicated to lesion detection in single patients.4 Whole-brain cohort-specific structural brain anomalies remain largely unknown.5 In other epilepsy syndromes, group-based designs have provided new insights by unveiling clinically relevant characteristics and helped in formulating hypotheses about disease mechanisms.6,7 In this study, we aimed to compare whole-brain morphology between frontal lobe epilepsy cohorts with histologically verified FCD type I and II. Our approach was motivated by case reports indicating that FCD type II may present with histologic8 and MRI anomalies9,10 in remote cortices resembling those found in the primary lesion and that type I may be associated with subtle multilobar hypoplasia on MRI.11
We hypothesized widespread, yet diverging patterns of anomalies, with cortical thinning in FCD type I and thickening in type II. Our MRI phenotyping combined group- and individual-level analysis of cortical thickness and folding complexity, 2 established in vivo markers of brain morphology and development. We evaluated the clinical utility of group-level patterns to classify the histopathologic FCD subtype, lateralize the seizure focus, and to predict postsurgical seizure outcome in individual patients using machine learning.
METHODS
Participants.
From a database of patients hospitalized for presurgical workup of drug-resistant extratemporal epilepsy at the Montreal Neurological Institute (MNI) and Hospital who underwent video-EEG telemetry and were examined on a single scanner with an identical imaging protocol12 (n = 73), we selected those with frontal lobe epilepsy and histologically verified FCD (type I, n = 13; type II, n = 28).
In patients with FCD type II, the lesion was seen either on conventional MRI (n = 18) or became visible through texture analysis13 (n = 10). In the latter group, surgery was preceded by invasive monitoring using stereotactic implanted depth electrodes (stereoelectroencephalography [SEEG]), with positioning of the leads guided by the putative lesion seen on texture maps; in all, SEEG demonstrated a very active interictal activity and focal changes at seizure onset in the electrodes targeting the lesion. Mean postoperative follow-up time was 4.9 ± 3 years; 18 patients became seizure-free (Engel Class I),14 6 had rare disabling seizures (Engel II), and 4 with lesions encroaching eloquent areas had worthwhile improvement (Engel III) as lesionectomy was incomplete. In patients with FCD type I, both preoperative visual MRI and image processing were unremarkable; surgery in these patients was preceded by SEEG. Implantations were guided by findings derived from video-EEG telemetry with scalp electrodes in all, with additional help from FDG-PET ([18F]-fluorodeoxyglucose-PET) (n = 9) and SPECT (n = 7) data, and resulted in focal corticectomies in the supplementary motor area in 5 patients, prefrontal cortex in 4, lower central in 3, and orbitofrontal in one. Mean postoperative follow-up was 3.9 ± 2 years; 3 patients became seizure-free (Engel I), 3 had rare disabling seizures (Engel II), 5 a worthwhile improvement (Engel III), and 2 no improvement (Engel IV).
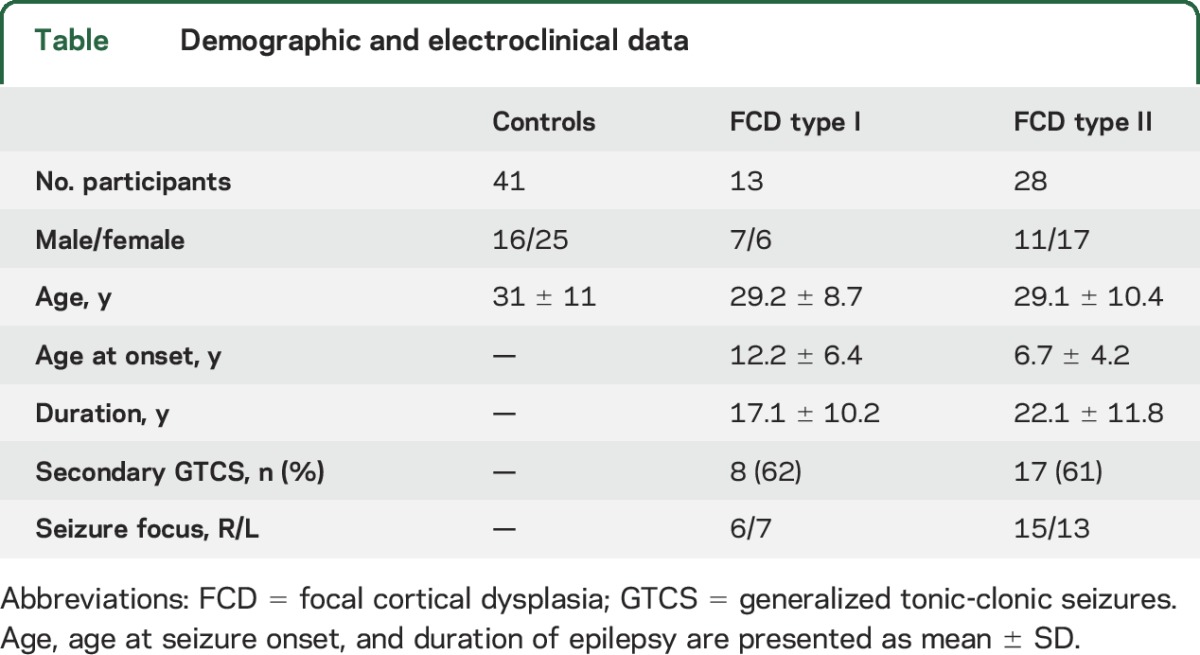
Patient cohorts did not differ in age, disease duration, sex distribution, seizure focus lateralization, and number of generalized seizures (p > 0.15). The control group consisted of 41 age- and sex-matched healthy individuals. Demographic, clinical, and electrophysiologic data are presented in the table.
Table.
Demographic and electroclinical data
Standard protocol approvals, registrations, and patient consents.
The ethics committee of the MNI approved the study and written informed consent was obtained from all participants.
MRI acquisition and image preparation.
Images were acquired on a 1.5T Gyroscan (Philips, Eindhoven, the Netherlands) using a 3-dimensional T1 fast field echo sequence (repetition time = 18 milliseconds; echo time = 10 milliseconds; flip angle = 30°; matrix = 256 × 256; field of view = 256 × 256 mm2; slice thickness = 1 mm) providing isotropic voxel dimensions of 1 × 1 × 1 mm. MRI preprocessing included correction for intensity nonuniformity, intensity standardization, linear registration to the MNI152 template, and classification into white matter (WM), gray matter (GM), and CSF.15 The Constrained Laplacian Anatomic Segmentation using Proximity (CLASP) algorithm16 generated a model of the inner (WM-GM) and outer (GM-CSF) surfaces with 40k surface points (or vertices) for each hemisphere. Surfaces were aligned to a hemisphere-symmetric surface template to improve interindividual correspondence.17 The accuracy of surface extractions was verified in all individuals before further analysis.
Surface-based morphometry.
We generated cortical thickness and curvature maps using a previously reported methodology.18,19 Cortical thickness was measured as the distance between corresponding vertices of inner and outer surfaces. To measure curvature, we generated a surface model running at middistance between the inner and outer surfaces. We subsequently applied a barycentric smoothing with 3 iterations to reduce high-frequency noise in vertex positions.20 Absolute mean curvature was calculated at each vertex to quantify changes in frequency and depth of sulcal and gyral folds, expressing local gyrification complexity. Structural metrics were blurred with a surface-based kernel of full width at half maximum = 20 mm that preserves cortical topology.15
Analysis.
Statistical analysis was performed using SurfStat for MATLAB.21 Patients were analyzed relative to the epileptogenic hemisphere; the symmetric template used for surface registration ensured an unbiased analysis when sorting hemispheres into ipsilateral/contralateral to the focus. Furthermore, we normalized thickness and curvature at each vertex using a z-transformation with respect to the corresponding distribution in controls; in other words, each patient's right/left feature was expressed as z score with respect to right/left values in controls.
Mapping structural changes relative to controls.
We assessed differences in cortical thickness and folding complexity between each patient group (i.e., FCD type I and type II) and controls using 2-tailed Student t tests at each vertex. Because curvature might be affected by variations of cortical thickness, we statistically adjusted this metric at every vertex by the corresponding thickness measure.22 In FCD type II, to eliminate potential effect of the lesion on group comparisons, we performed an additional analysis in which lesion labels obtained through expert manual segmentation (D.S.) were projected onto cortical surfaces and blurred with a 20-mm kernel, excluding cortical measures that fell within the blurred labels.
For individual analysis, we calculated proportions of patients with thickness/curvature measures beyond ±2 SD from the mean of controls across the cortical surface.23 In FCD type II, lesional labels were excluded. A leave-one-out approach calculated unbiased prevalences in controls.
Direct contrast between patient groups.
Cortical thickness and curvature were directly compared between groups using vertex-wise 2-sample t tests.
Group differences in postsurgical outcome.
We subdivided patients into seizure-free (Engel Class I) and non–seizure-free (Classes II–IV) and compared cortical markers between outcome classes.
Automatic classification of individual patients.
We evaluated the yield of group-level findings to predict FCD subtypes, lateralize the seizure focus, and determine postsurgical outcome using a machine-learning approach with leave-one-out validation. Each hemisphere was subdivided into 500 equally sized parcels.24 The search space was confined to regions displaying group-level differences (FCD type I vs type II for subtype prediction, FCDs vs healthy controls for focus lateralization, and seizure-free vs non–seizure-free for outcome prediction). Each parcel falling into a significant cluster was mirrored to both left and right hemispheres, as one cannot assume to know focus-laterality in a new patient. We extracted mean thickness and curvature z scores from these parcels and fed them to a support vector machine (SVM) classifier that evaluated prediction performance based on single pairs of parcels. To optimize classification sensitivity, borrowing the concept of searchlight-based multivoxel pattern analysis,10 we evaluated combinations of single pairs of parcels (preselected from those achieving >80% accuracy) using a separate SVM. The optimal number of parcel pairs was empirically set to 3.
Correction for multiple comparisons and assessment of classification accuracy.
Group results were corrected using random field theory for nonisotropic images at a cluster level.25 We used the function SurfStatP.m, with a search space constrained to the neocortical mantle in both hemispheres. This controlled the family-wise error (FWE) probability to p < 0.05. In all machine-learning experiments, we used permutation tests to confirm whether the achieved accuracy exceeded chance level (Bonferroni-corrected p < 0.05).
RESULTS
Group analysis.
Cortical thickness.
Compared with controls, FCD type I showed bilateral multilobar cortical thinning, with ipsilateral lateral frontal and mesial precentral changes (FWE-corrected p value, pFWE < 0.0001; Cohen d = 0.78; 95% confidence interval [CI] = −1.53 to −0.40) (figure 1). Atrophy was also present in ipsilateral insular, supramarginal, and temporal cortices (pFWE < 0.02; Cohen d = 0.72; 95% CI = −1.37 to −0.29). Comparing type II with controls revealed contralateral postcentral and temporal thickening (pFWE < 0.005; Cohen d = 0.63; 95% CI = 0.24–1.13), together with medial occipital thinning (pFWE < 0.04; Cohen d = 0.69; 95% CI = −1.07 to −0.28). Of note, at uncorrected thresholds, thickness increases were also present ipsilaterally; moreover, asymmetry analysis did not show interhemispheric differences in this cohort (t < 0.5, p > 0.3). Excluding lesional vertices from comparisons did not modify results. Finally, directly contrasting both patient cohorts confirmed frontal and cingulate atrophy in type I (pFWE < 0.005; Cohen d = 0.82; 95% CI = −1.66 to −0.34).
Figure 1. Group-level alterations in cortical thickness (A) and folding complexity (B) in patients with FCD.

In A and B, the left panels show comparison between FCD type I and healthy controls; the middle panels between type II and controls; and the right panels show the direct contrast between both FCD cohorts. Increases/decreases are shown in red/blue. Significant clusters, corrected for multiple comparisons using random field theory at pFWE < 0.05, are shown in solid colors and outlined in black; trends are shown in semitransparent. FCD = focal cortical dysplasia.
Cortical folding complexity.
Compared with controls, while FCD type I showed increased curvature in ipsilateral orbitofrontal cortices (pFWE < 0.001; Cohen d = 0.71; 95% CI = 0.16–1.24), complexity in type II was decreased in bilateral frontopolar regions (pFWE < 0.03; Cohen d = 0.62; 95% CI = −1.06 to −0.23). The direct between-group contrast confirmed increased folding in ipsilateral orbitofrontal cortices in type I with additional increases in frontopolar cortices (pFWE < 0.01; Cohen d = 0.84; 95% CI = 0.17–1.38).
Individual analysis.
In both patient cohorts, individual analysis revealed a spatial distribution of prevalent anomalies resembling the group-level findings, with up to 55% showing marked morphologic abnormalities (i.e., ≥2 SD beyond the mean of controls) (figure e-1 on the Neurology® Web site at Neurology.org). Prevalent anomalies were also seen in lateral temporal cortices in FCD type I and medial frontal cortices in type II. In controls, prevalences for abnormal z scores did not surpass 5%.
Duration-stratified subgroup analysis.
To explore the dichotomy between patient cohorts, we subdivided each with respect to its median duration (14 years in FCD type I, 21 years in type II) into short (FCD type I: n = 7; FCD type II: n = 14) and long (FCD type I: n = 6; FCD type II: n = 14) duration and compared them with controls (figure 2). The difference in duration between FCD type I and type II was not significant, neither for the short-duration (10.1 ± 3.2 vs 12.9 ± 6.2; t = 1.1, p > 0.28) nor long-duration subgroups (25.2 ± 9.4 vs 31.4 ± 8.1; t = 1.4, p > 0.15). However, as the short duration subgroups were younger than controls (22 ± 5 vs 31 ± 11 years, p = 0.001), we controlled for age in subsequent comparisons.
Figure 2. Duration-stratified analysis of cortical thickness.

Each patient cohort was split into short (A) and long (B) duration subgroups according to its respective median (FCD type I/type II: 14/21 years) and compared with controls. Thickness increases/decreases are shown in red/blue. See figure 1 for details on statistical procedures. FCD = focal cortical dysplasia.
In FCD type I, both subgroups presented with diffuse and bilateral cortical thinning, with a somewhat more marked and extended distribution in ipsilateral frontal cortices in those with long disease duration. In type II, however, patients with short duration showed bilateral symmetric thickening in frontal, central, and temporal areas (pFWE < 0.04), while those with long duration presented with pericentral and temporo-occipital thinning (pFWE < 0.04). Results in type II remained unchanged after excluding lesional vertices. In a separate analysis, linearly modeling vertex-wise duration effects revealed progressive cortical thinning in ipsilateral middle frontal and contralateral orbitofrontal cortices in FCD type I. A similar direction and extent of progressive thinning was observed in type II; interaction analysis did not show differences in duration effects between both patient cohorts. These findings suggest that disease progression occurs in both FCD subtypes, although with differential timelines (i.e., FCD type II: thick cortex in patients with short disease duration, thinner cortex with longer duration; FCD type I: thin cortex in patients with short duration, very thin cortex in those with longer duration).
Analysis of postsurgical outcome.
In FCD type I, patients with residual seizures had more marked cortical thinning compared to seizure-free patients in a large region within the ipsilateral medial frontal cortex (pFWE < 0.05) (figure 3). In FCD type II, however, non–seizure-free patients presented with thicker contralateral mid/posterior cingulate, parietal, and temporopolar cortices compared to those who achieved seizure freedom (pFWE < 0.05). Folding complexity did not relate to outcome in either cohort.
Figure 3. Morphologic markers of postsurgical seizure outcome.

Cortical thickness comparison between seizure-free (Engel Class I) and non–seizure-free patients (Classes II–IV). See figure 1 for details on statistical procedures. Given the small number of seizure-free patients (n = 3) in type I, findings were cross-validated using nonparametric permutation tests, both for group comparison and family-wise error correction. FCD = focal cortical dysplasia.
Automated patient classification.
The SVM predicting the histologic subtype achieved 98% accuracy (13/13 = 100% in FCD type I; 27/28 = 96% in FCD type II), with frontopolar and ventrolateral prefrontal regions contributing to optimal classification (figure 4). Automated lateralization of the epileptic focus was also highly accurate (12/13 = 92% in type I; 24/28 = 86% in type II), with lateral frontal, temporal, and frontobasal features driving performance for type I, and postcentral, lateral temporal, and frontopolar regions for type II. Finally, we could predict outcome in 92% of patients (12/13) with type I and 82% (23/28) with type II; predictive parcels were situated in superior frontal and parietal regions in type I, and in the mid/posterior cingulate cortex in type II. Permutation tests with 1,000 iterations confirmed that achieved accuracies exceeded chance level (Bonferroni-corrected p < 0.05).
Figure 4. Machine-learning framework applied to FCD subtype prediction.

(A) Feature generation. Each hemisphere was subdivided into 500 equally sized parcels. The search space was confined to significant clusters of group-level differences (i.e., FCD type I vs type II). After mirroring each parcel to both left and right hemispheres, we generated a feature vector by extracting mean thickness and curvature z scores. (B) Single-parcel classification. Features obtained in panel A were fed to a support vector machine classifier, which evaluated subtype prediction performance at each pair of parcels. (C) Multiparcel classification. To optimize sensitivity, among parcels achieving >80% accuracy in panel B (color-coded in green), combinations of k pairs of parcels (optimal k empirically set at 3) were fed to a separate classifier. Multidimensional scaling allows reducing dimensionality to 2 dimensions while preserving interfeature distances. Misclassified cases are highlighted with an x. Steps A through C are performed in a leave-one-out framework that allows determining prediction accuracy for previously unseen cases. FCD = focal cortical dysplasia.
DISCUSSION
We examined whole-brain MRI morphology in dysplasia-related frontal lobe epilepsy. Cohorts did not differ in demographics, disease duration, and number of generalized seizures, but diverged with respect to the FCD type, lesion visibility, and postsurgical outcome. In FCD type I, surface-based analysis unveiled widespread atrophy, a finding cross-validated by direct comparison to those with type II lesions. Moreover, individual analysis showed that group-level patterns were highly prevalent, dispelling possible concerns that outliers could have driven findings.
Widespread neocortical atrophy, often observed in drug-resistant temporal lobe epilepsy26 and idiopathic generalized epilepsy,27 is thought to reflect combined effects of neuronal disconnection and seizure-related damage. Sustained seizure activity may lead to cell loss in both seizure-generating regions and areas of spread,28 particularly through upregulation of glutamate.29 While this scenario may explain cortical thinning in our patients with type I FCD, it is seemingly at odds with findings in those with type II lesions, who showed increased thickness in several cortices. This paradox was further amplified when stratifying patients according to disease duration: close to the onset, patients with type I FCD displayed diffuse bilateral cortical atrophy, while those with type II lesions presented with marked and fairly extensive cortical thickening, even when controlling for age and after excluding the lesion label.
Diverging morphometric patterns, particularly at early disease stages, may point to distinct mechanisms and timing underlying the anomalous cortical development in these cohorts. Typical brain growth entails a series of complex and overlapping steps, including synaptogenesis with elaboration of dendrites, which continue into early childhood.30 In this context, pruning, a self-regulatory process starting in late gestation (which eliminates redundant axons, dendrites, and synapses, as well as neurons) has a pivotal role in shaping cortical network organization until late adolescence, sparing only the most efficient connectivity configurations.31 Of note, in FCD type II, aberrant synaptogenesis of dysmorphic neurons and failure of oligodendroglial differentiation result in erroneous axonal processes and hypomyelination.32 In light of our observations, one may postulate that the primary lesion and mutually connected cortices show delayed pruning that manifest as gray matter excess. Moreover, according to models of structural covariance and maturational coupling of brain networks, regions belonging to the same network show correlated growth due to exchange of trophic factors and common molecular signaling pathways.33 Conceivably, developing cortices sharing links with the lesion may be influenced in similar ways. A post hoc analysis indeed supported a selective thickening of contralateral neocortices homotopic to the primary FCD type II in patients with short disease duration (p < 0.05 relative to controls), while thickness of nonhomotopic contralateral vertices was not increased.
Diffuse cortical thinning in FCD type I warrants several considerations. First, in light of the recent histopathologic findings showing a tendency for reduced cortical thickness in FCD type I,32 primary frontal cortical thinning observed in our patients may reflect, in part, the primary lesion. This hypothesis is justified by our inclusion criteria, as we restricted the assessment to patients with frontal lobe epilepsy only. Second, in young children with psychomotor handicap, this malformation may span across several lobes.34 Further support for the widespread nature of morphologic anomalies and the associated epileptogenic zone may come from the unfavorable surgical outcome after focal resections in our patients, in line with reported series of patients with nonlesional frontal lobe epilepsy.1,35 While pathogenic mechanisms underlying FCD type I remain largely uncertain, it is enticing to hypothesize that cortical architecture in this condition may relate to abnormal tangential migration. Contrary to excitatory projection neurons obeying the laws of gliophilic radial migration, the vast majority of GABAergic inhibitory interneurons arrive in the cortex via a tangential migratory corridor.36 Of note, in this migration mode, neurons move parallel to the brain surface and their final positioning often transgresses regional boundaries.37 Reduced arrival and abnormal maturation of inhibitory interneurons into the cortical plate may alter the balance between excitatory and inhibitory signaling, resulting in aberrant network hyperexcitability and widespread subtle morphologic defects. This hypothesis is supported by metabolic imaging studies showing diffuse abnormalities of γ-aminobutyric acid type A receptors.38
Alterations of folding patterns are often used to typify malformations of cortical development, ranging from reduction in lissencephaly spectrum disorders caused by defective early neuronal proliferation to increased folding frequency in polymicrogyrias related to abnormal postmigrational development.39 Considering this continuum, decreased sulcal-gyral complexity in FCD type II reinforces the notion of a defect occurring during the initial stages of corticogenesis; conversely, increased complexity in FCD type I suggests a postmigrational anomaly.39
Evidence-based clinical practice parameters foster novel combinations of quantitative neuroimaging with pattern learning techniques to objectively extract critical features and high-dimensional data relationships.40 Our findings emphasize that group-level phenotypes may guide fully automated and accurate diagnostic procedures in single patients. While seizure focus lateralization may optimize the performance of automated lesion-detection algorithms, especially for previously overlooked lesions, noninvasive preoperative prediction of FCD subtype and outcome may have implications for surgical planning and optimized patient counseling.
Supplementary Material
GLOSSARY
- CI
confidence interval
- FCD
focal cortical dysplasia
- FWE
family-wise error
- GM
gray matter
- MNI
Montreal Neurological Institute
- SEEG
stereoelectroencephalography
- SVM
support vector machine
- WM
white matter
Footnotes
Supplemental data at Neurology.org
AUTHOR CONTRIBUTIONS
Seok-Jun Hong: drafting manuscript for content, including medical writing, study concept and design, statistical analysis and interpretation of data. Boris C. Bernhardt: drafting manuscript for content, including medical writing, study concept and design, interpretation of data. Dewi S. Schrader: expert lesion segmentation. Neda Bernasconi: revising manuscript for content, including medical writing, study concept and design, interpretation of data, study supervision, obtaining funding. Andrea Bernasconi: revising manuscript for content, including medical writing, study concept and design, interpretation of data, acquisition of data, study supervision, obtaining funding.
STUDY FUNDING
This work was supported by the Canadian Institutes of Health Research (CIHR, MOP-57840 and 123520). S.-J.H. received a Desjardins fellowship. B.C.B. was funded by CIHR and a JTC fellowship of the Montreal Neurological Institute.
DISCLOSURE
The authors report no disclosures relevant to the manuscript. Go to Neurology.org for full disclosures.
REFERENCES
- 1.Lerner JT, Salamon N, Hauptman JS, et al. Assessment and surgical outcomes for mild type I and severe type II cortical dysplasia: a critical review and the UCLA experience. Epilepsia 2009;50:1310–1335. [DOI] [PubMed] [Google Scholar]
- 2.Blumcke I, Thom M, Aronica E, et al. The clinicopathologic spectrum of focal cortical dysplasias: a consensus classification proposed by an ad hoc Task Force of the ILAE Diagnostic Methods Commission. Epilepsia 2011;52:158–174. [DOI] [PMC free article] [PubMed] [Google Scholar]
- 3.Sisodiya SM, Fauser S, Cross JH, Thom M. Focal cortical dysplasia type II: biological features and clinical perspectives. Lancet Neurol 2009;8:830–843. [DOI] [PubMed] [Google Scholar]
- 4.Hong SJ, Kim H, Schrader D, Bernasconi N, Bernhardt BC, Bernasconi A. Automated detection of cortical dysplasia type II in MRI-negative epilepsy. Neurology 2014;83:48–55. [DOI] [PMC free article] [PubMed] [Google Scholar]
- 5.Fonseca Vde C, Yasuda CL, Tedeschi GG, Betting LE, Cendes F. White matter abnormalities in patients with focal cortical dysplasia revealed by diffusion tensor imaging analysis in a voxelwise approach. Front Neurol 2012;3:121. [DOI] [PMC free article] [PubMed] [Google Scholar]
- 6.Keller SS, Roberts N. Voxel-based morphometry of temporal lobe epilepsy: an introduction and review of the literature. Epilepsia 2008;49:741–757. [DOI] [PubMed] [Google Scholar]
- 7.Bernhardt BC, Hong S, Bernasconi A, Bernasconi N. Imaging structural and functional brain networks in temporal lobe epilepsy. Front Hum Neurosci 2013;7:624. [DOI] [PMC free article] [PubMed] [Google Scholar]
- 8.Fauser S, Sisodiya SM, Martinian L, et al. Multi-focal occurrence of cortical dysplasia in epilepsy patients. Brain 2009;132:2079–2090. [DOI] [PubMed] [Google Scholar]
- 9.Bonilha L, Montenegro MA, Rorden C, et al. Voxel-based morphometry reveals excess gray matter concentration in patients with focal cortical dysplasia. Epilepsia 2006;47:908–915. [DOI] [PubMed] [Google Scholar]
- 10.Kriegeskorte N, Goebel R, Bandettini P. Information-based functional brain mapping. Proc Natl Acad Sci USA 2006;103:3863–3868. [DOI] [PMC free article] [PubMed] [Google Scholar]
- 11.Krsek P, Maton B, Korman B, et al. Different features of histopathological subtypes of pediatric focal cortical dysplasia. Ann Neurol 2008;63:758–769. [DOI] [PubMed] [Google Scholar]
- 12.Besson P, Andermann F, Dubeau F, Bernasconi A. Small focal cortical dysplasia lesions are located at the bottom of a deep sulcus. Brain 2008;131:3246–3255. [DOI] [PubMed] [Google Scholar]
- 13.Bernasconi A, Antel SB, Collins DL, et al. Texture analysis and morphological processing of magnetic resonance imaging assist detection of focal cortical dysplasia in extra-temporal partial epilepsy. Ann Neurol 2001;49:770–775. [PubMed] [Google Scholar]
- 14.Engel J, Jr, Van Ness PC, Rasmussen T, Ojemann LM. Outcome with respect to epileptic seizures. In: Engel J, Jr, editor. Surgical Treatment of the Epilepsies, 2nd ed New York: Raven; 1993:609–621. [Google Scholar]
- 15.Bernhardt BC, Worsley KJ, Kim H, Evans AC, Bernasconi A, Bernasconi N. Longitudinal and cross-sectional analysis of atrophy in pharmacoresistant temporal lobe epilepsy. Neurology 2009;72:1747–1754. [DOI] [PMC free article] [PubMed] [Google Scholar]
- 16.Kim JS, Singh V, Lee JK, et al. Automated 3-D extraction and evaluation of the inner and outer cortical surfaces using a Laplacian map and partial volume effect classification. Neuroimage 2005;27:210–221. [DOI] [PubMed] [Google Scholar]
- 17.Lyttelton O, Boucher M, Robbins S, Evans A. An unbiased iterative group registration template for cortical surface analysis. Neuroimage 2007;34:1535–1544. [DOI] [PubMed] [Google Scholar]
- 18.Voets NL, Bernhardt BC, Kim H, Yoon U, Bernasconi N. Increased temporolimbic cortical folding complexity in temporal lobe epilepsy. Neurology 2011;76:138–144. [DOI] [PMC free article] [PubMed] [Google Scholar]
- 19.Bernhardt BC, Bernasconi N, Concha L, Bernasconi A. Cortical thickness analysis in temporal lobe epilepsy: reproducibility and relation to outcome. Neurology 2010;74:1776–1784. [DOI] [PubMed] [Google Scholar]
- 20.Im K, Lee JM, Lyttelton O, Kim SH, Evans AC, Kim SI. Brain size and cortical structure in the adult human brain. Cereb Cortex 2008;18:2181–2191. [DOI] [PubMed] [Google Scholar]
- 21.Worsley K, Taylor J, Carbonell F, et al. SurfStat: a Matlab toolbox for the statistical analysis of univariate and multivariate surface and volumetric data using linear mixed effects models and random field theory. Neuroimage 2009. OHBM poster. [Google Scholar]
- 22.Glasser MF, Van Essen DC. Mapping human cortical areas in vivo based on myelin content as revealed by T1- and T2-weighted MRI. J Neurosci 2011;31:11597–11616. [DOI] [PMC free article] [PubMed] [Google Scholar]
- 23.Bernhardt BC, Worsley KJ, Besson P, et al. Mapping limbic network organization in temporal lobe epilepsy using morphometric correlations: insights on the relation between mesiotemporal connectivity and cortical atrophy. Neuroimage 2008;42:515–524. [DOI] [PubMed] [Google Scholar]
- 24.Cammoun L, Gigandet X, Meskaldji D, et al. Mapping the human connectome at multiple scales with diffusion spectrum MRI. J Neurosci Methods 2012;203:386–397. [DOI] [PubMed] [Google Scholar]
- 25.Worsley K, Andermann M, Koulis T, MacDonald D, Evans A. Detecting changes in nonisotropic images. Hum Brain Mapp 1999;8:98–101. [DOI] [PMC free article] [PubMed] [Google Scholar]
- 26.Bonilha L, Rorden C, Appenzeller S, Coan AC, Cendes F, Li LM. Gray matter atrophy associated with duration of temporal lobe epilepsy. Neuroimage 2006;32:1070–1079. [DOI] [PubMed] [Google Scholar]
- 27.Bernhardt BC, Rozen DA, Worsley KJ, Evans AC, Bernasconi N, Bernasconi A. Thalamo-cortical network pathology in idiopathic generalized epilepsy: insights from MRI-based morphometric correlation analysis. Neuroimage 2009;46:373–381. [DOI] [PubMed] [Google Scholar]
- 28.Blumenfeld H. From molecules to networks: cortical/subcortical interactions in the pathophysiology of idiopathic generalized epilepsy. Epilepsia 2003;44(suppl 2):7–15. [DOI] [PubMed] [Google Scholar]
- 29.Casillas-Espinosa PM, Powell KL, O'Brien TJ. Regulators of synaptic transmission: roles in the pathogenesis and treatment of epilepsy. Epilepsia 2012;53(suppl 9):41–58. [DOI] [PubMed] [Google Scholar]
- 30.Tau GZ, Peterson BS. Normal development of brain circuits. Neuropsychopharmacology 2010;35:147–168. [DOI] [PMC free article] [PubMed] [Google Scholar]
- 31.Raznahan A, Lerch JP, Lee N, et al. Patterns of coordinated anatomical change in human cortical development: a longitudinal neuroimaging study of maturational coupling. Neuron 2011;72:873–884. [DOI] [PMC free article] [PubMed] [Google Scholar]
- 32.Muhlebner A, Coras R, Kobow K, et al. Neuropathologic measurements in focal cortical dysplasias: validation of the ILAE 2011 classification system and diagnostic implications for MRI. Acta Neuropathol 2012;123:259–272. [DOI] [PubMed] [Google Scholar]
- 33.Duan KB, Keerthi SS. Which is the best multiclass SVM method? An empirical study. In: Oza N, Polikar R, Kittler J, Roli F, editors. Multiple Classifier Systems. Berlin: Springer; 2005:278–285. [Google Scholar]
- 34.Krsek P, Maton B, Jayakar P, et al. Incomplete resection of focal cortical dysplasia is the main predictor of poor postsurgical outcome. Neurology 2009;72:217–223. [DOI] [PubMed] [Google Scholar]
- 35.Lawson JA, Cook MJ, Vogrin S, et al. Clinical, EEG, and quantitative MRI differences in pediatric frontal and temporal lobe epilepsy. Neurology 2002;58:723–729. [DOI] [PubMed] [Google Scholar]
- 36.Marin O, Rubenstein JL. Cell migration in the forebrain. Annu Rev Neurosci 2003;26:441–483. [DOI] [PubMed] [Google Scholar]
- 37.Nadarajah B, Parnavelas JG. Modes of neuronal migration in the developing cerebral cortex. Nat Rev Neurosci 2002;3:423–432. [DOI] [PubMed] [Google Scholar]
- 38.Duncan JS, Koepp MJ. PET: central benzodiazepine neuroreceptor mapping in localization-related epilepsies. Adv Neurol 2000;83:131–136. [PubMed] [Google Scholar]
- 39.Barkovich AJ, Guerrini R, Kuzniecky RI, Jackson GD, Dobyns WB. A developmental and genetic classification for malformations of cortical development: update 2012. Brain 2012;135:1348–1369. [DOI] [PMC free article] [PubMed] [Google Scholar]
- 40.Bernhardt BC, Hong SJ, Bernasconi A, Bernasconi N. Magnetic resonance imaging pattern learning in temporal lobe epilepsy: classification and prognostics. Ann Neurol 2015;77:436–446. [DOI] [PubMed] [Google Scholar]
Associated Data
This section collects any data citations, data availability statements, or supplementary materials included in this article.