

Abstract
Prostate cancer is a highly prevalent tumor affecting millions of men worldwide, but poor understanding of its pathogenesis has limited effective clinical management of patients. In addition to transcriptional profiling or transcriptomics, metabolomics is being increasingly utilized to discover key molecular changes underlying tumorigenesis. In this study, we integrated transcriptomics and metabolomics to analyze 25 paired human prostate cancer tissues and adjacent noncancerous tissues, followed by further validation of our findings in an additional cohort of 51 prostate cancer patients and 16 benign prostatic hyperplasia patients. We found several altered pathways aberrantly expressed at both metabolic and transcriptional levels, including cysteine and methionine metabolism, nicotinamide adenine dinucleotide metabolism, and hexosamine biosynthesis. Additionally, the metabolite sphingosine demonstrated high specificity and sensitivity for distinguishing prostate cancer from benign prostatic hyperplasia, particularly for patients with low prostate specific antigen level (0–10 ng/ml). We also found impaired sphingosine-1-phosphate receptor 2 signaling, downstream of sphingosine, representing a loss of tumor suppressor gene and a potential key oncogenic pathway for therapeutic targeting. By integrating metabolomics and transcriptomics, we have provided both a broad picture of the molecular perturbations underlying prostate cancer and a preliminary study of a novel metabolic signature, which may help to discriminate prostate cancer from normal tissue and benign prostatic hyperplasia.
Prostate cancer (PCa)1 is the most commonly diagnosed visceral malignancy among men and the second leading cause of cancer-related death in Western countries, second only to lung cancer (1, 2). The prevalence of PCa in Asian populations, such as China and Japan, was much lower than Western countries, but its incidence and associated mortality rates are increasing rapidly with the growing aging population (3). Barriers in the effective clinical management of PCa include significant intratumoral heterogeneity and limited knowledge of the molecular events governing tumor progression (4). Therefore, there has been increased interest in understanding PCa pathogenesis during local and distant tumor progression to improve diagnostic sensitivity and therapeutic outcomes in the clinical setting (5, 6).
Comprehensive gene expression profiling has identified potential tumor biomarkers for early diagnosis and risk assessment of PCa (7). A cDNA microarray-based study utilized gene expression profiling to stratify tumors into clinically relevant subtypes of PCa (8), which were correlated with tumor grade, stage, and preoperative prostate-specific antigen (PSA) levels. Transcriptome sequencing across a PCa cohort identified that PCAT-1 was implicated in PCa progression (9). Based on gene expression data, researchers revealed pathway dysregulation (10) and transcriptional programs related to metastatic disease in PCa (11). A model based on gene expression data alone can accurately predict patient outcome following prostatectomy (12). Gene expression profiling is capable of surveying the entire genome, and this approach, also called transcriptomics, may yield further insight into oncogenesis. However, its integration with other “-omic” studies may provide a more in-depth understanding of intratumor processes (13, 14). Metabolic profiling or metabolomics provides data-rich information of metabolic alterations that reflect genetic, epigenetic, and environmental factors influencing cellular physiology (15). Integration of transcriptomics and metabolomics may yield further insight into tumor pathogenesis than either approach alone. For example, this combined approach elucidated altered expression of enzymatic lipases reflecting differential lipid metabolism profiles in pancreatic cancer (16). Likewise, metabolomic study of altered citrate and choline-related metabolism in PCa yielded potential aberrantly expressed enzymes for therapeutic targeting (17).
In this study, we performed metabolomic study of 25 paired human PCa samples, comprised of PCa tissue (PCT) and adjacent noncancerous tissue (ANT) by liquid chromatography-mass spectrometry (LC-MS), aiming to identify key metabolic alterations unique to PCa (Fig. 1). We then performed transcriptome analysis in these samples to identify differentially expressed genes, reflecting tumor-specific metabolic changes. These corresponding metabolic and genetic alterations were further validated in a separate cohort of 51 paired PCT and ANT. Lastly, we integrated our metabolic and transcriptomic data to uncover significantly perturbed pathways at both the metabolic and transcriptional levels and to identify potential biomarkers that may aid in the diagnosis and prognosis of PCa.
Fig. 1.
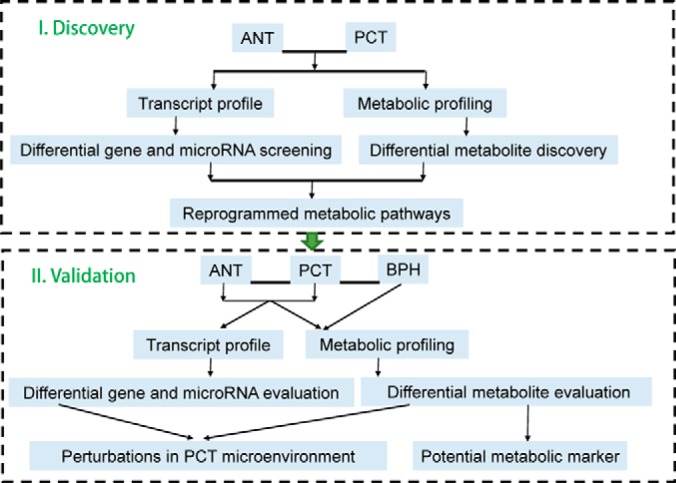
Experimental flow chart.
EXPERIMENTAL PROCEDURES
Chemicals and Reagents
Ultrapure water was provided by a Milli-Q water purification system (Millipore, Billerica, MA). Acetonitrile and methanol were of HPLC grade and obtained from Merck (Darmstodt, Germany). Formic acid, ammonium bicarbonate, and methyl tert-butyl ether (MTBE) were purchased from Sigma-Aldrich (St. Louis, USA). Isotope chemical standards including acetyl-d3-l-carnitine, decanoyl-d3-carnitine, palmitoyl-d3-carnitine, l-leucine-5,5,5-d3, l-phenyl-d5-alanine, l-tryptophan-d5, cholic acid-2,2,4,4-d4, chenodeoxycholic acid-2,2,4,4-d4, palmitic acid-16,16,16-d3,stearic-18,18,18-d3 acid, and LysoPC (19:0) were obtained from Sigma-Aldrich. All isotope chemical standards as internal standards were dissolved in methanol by dilution of stock solution of each compound. The preparations of each isotope standard are presented in Table S1.
Sample Collection and Preparation for Metabolomics Analysis
In total, 25 PCa patients and 51 PCa and 16 benign prostatic hyperplasia patients were involved in the discovery phase and validation phase of metabolomics study, respectively. After informed consent and approval by the institutional ethics committee, paired PCT and ANT from each PCa patient were collected from the archives of the Shanghai Changhai Hospital. Upon removal of the surgical specimen, the tumor tissue and patient-matched adjacent normal tissue were separated and immediately frozen to make sure the metabolites were unchanged before analysis. Routine hematoxylin and eosin staining of patient specimens were performed by the pathologists of the study to ensure that the tumor tissues had high-density cancer foci and the adjacent normal tissues had no tumor contamination. Clinical patient information, including Gleason score, preoperative prostate-specific antigen (PSA), and tumor grade are shown in Table I. All tissue specimens were stored at −80 °C before analysis.
Table I. Clinical information of patient cohorts.
| Characteristic | Discovery |
Validation |
|
|---|---|---|---|
| PCTa | PCT | BPH | |
| Total cases | 25 | 51 | 16 |
| PSA (ng/ml) <10/>10 | 9/15b | 9/42 | 10/5c |
| Gleason score <7 | 2 | 6 | |
| Gleason score = 7 | 12 | 31 | |
| Gleason score >7 | 11 | 14 | |
| Localized/ locally advanced/metastatic | 17/4/3d | 32/16/3 | |
a Paired adjacent noncancerous tissues were collected.
b One sample was lack of PSA information.
c One sample was lack of PSA information.
d One sample was lack of information related to grade malignancy.
MTBE was used to extract metabolites for metabolomic analysis. The protocol had been validated in previous studies (18, 19). For each specimen, 10 mg of wet tissue was weighed and placed into a 2 ml centrifuge tube. A porcelain ball and 300 μl ice-cold methanol with internal standards were added followed by homogenization (20 Hz, 2 × 1 min) in a frozen mixed ball grinding machine (MM400, Retsch Technology, Han, Germany). Next, 1 ml MTBE was added, and the mixture was incubated at room temperature for 1 h in a shaker. Phase separation was induced by adding 300 μl ultrapure water, and the centrifuge tube was vortexed for 30 s. The mixture was centrifuged for 10 min (10,000 rpm, 4 °C) after the extract was set aside for 10 min on ice. Due to the high density and high lipophilicity of MTBE, lipids and hydrophobic metabolites were primarily distributed into a MTBE-rich phase and formed the upper layer of the two-phase partitioning system, whereas hydrophilic metabolites were mainly extracted to the lower layer of methanol/water-rich phase. Proteins and other nonextractable matrix residues were at the bottom of centrifuge tube, which were easily removed. To enhance the coverage of metabolites, upper and lower layers were combined to form a small aliquot for metabolomics analysis. For each specimen, samples were prepared in duplicate for electrospray ionization positive ion mode and negative ion mode. Each sample consisted of 250 μl upper layer and 150 μl lower layer.
To monitor the robustness of sample pretreatment operation and stability of instrument analysis, quality control samples were prepared by pooling equal aliquots of upper layer and lower layer extracts from each specimen. All samples were dried in a vacuum centrifuge and stored at −80 °C until analysis. For LC-MS analysis, the samples were re-dissolved in 50 μl acetonitrile/water (2:8) solvent.
LC-MS Analysis
Chromatographic separation was implemented on an ACQUITY Ultra Performance Liquid Chromatography (UPLC, Waters Corporation, Manchester, UK) system. The instrument was equipped with a binary solvent manager with a maximum delivery flow rate of 2 ml min−1, an autosampler with a 10 μl loop, and a column manager with a column oven set at 40 °C in positive ion mode and 50 °C in negative ion mode.
For electrospray ionization positive ion mode, a 10 μl aliquot was injected into an ACQUITY UPLC BEH C8 1.7 μm (2.1 × 100 mm) column to perform metabolites separation. The mobile phases were water containing 0.1% formic acid (A) and acetonitrile (B). The elution gradient started with 5% B for 0.5 min, linearly increased to 100% B at 24 min, maintained for 4 min, then changed to 5% B for post equilibration. For electrospray ionization negative mode, an ACQUITY UPLC HSS T3 1.8 μm (2.1 × 100 mm) column was used. The mobile phases were 6.5 mm ammonium bicarbonate aqueous solution (C) and 95% methanol with 6.5 mm ammonium bicarbonate dissolved (D). The elution gradient was 2% D for 1 min, linearly increased to 100% D at 20 min, held for 4 min, and decreased back to 2% D. The delivery flow rate was 0.35 ml min−1.
TOF MS full scan was performed on positive ion mode and negative ion mode using a tripleTOF™ 5600 plus (Applied Biosystems, Foster City, CA) mass spectrometer, which was coupled to the UPLC system by an electrospray ionization port. Gas 1 and gas 2 of ion source were set to 50 psi, and curtain gas was set to 35 psi. Temperature was 500 °C, and ion spray voltage floating was 5500 V for positive ion mode and -4500 V for negative ion mode. Data acquisition, data handling, and instrument control were conducted on Analyst 1.6 software (Applied Biosystems).
Transcript Profile Analysis
Transcript analysis was performed by RNA-seq as previously described (20). TRIzol reagent was used to extract RNA and then rRNA was removed. cDNA library preparation and sequencing were performed on an Illumina (San Diego, CA) kit, following standard protocols. The clean reads of RNA nucleotide sequences were generated using TopHat software and miRNA data were aligned in a mirBase database.
Statistical Analysis
Peak detection and alignment was based on Marker View software (version 1.2.1.1, Applied Biosystems). The peak table was then exported to Excel software (Microsoft, Redmond, WA) for further analysis. The intensity of each ion feature was normalized to a corresponding internal standard (21, 22) then normalized to the unit weight of each tissue specimen. Principal component analysis (PCA) and partial least square discriminant analysis were performed using SIMCA-P 11.0 (Umetrics, Umea, Sweden) software. MATLAB (R2014a, MathWorks, Natick, MA) software was employed to perform paired nonparametric tests (signrank wilcoxon signed rank two-sided test), and a p value <0.05 was considered significant. Pearson correlation coefficients analysis was analyzed on SPSS 18.0 (IBM, Armonk, New York) software. Multi Experiment Viewer software was used to generate a heat map. Metabolic pathway analysis was conducted on the MetaboAnalyst website (http://www.metaboanalyst.ca). The pathway plots were based on the Kyoto Encyclopedia of Genes and Genomes database, and the National Center for Biotechnology Information (NCBI) database was searched to define gene functions. Gene enrichment analysis was conducted on Gene Set Enrichment Analysis Software (Broad Institute, Cambridge, MA).
RESULTS
Molecular Alterations at the Metabolic and Transcriptional Levels Suggest Major Altered Pathways in Prostate Cancer
Paired PCT and ANT from 25 patients were analyzed by LC-MS. After peak alignment and refining based on the 80% rule (23), the responses of retained ion features were calibrated by internal standards. In total, seven quality control samples were included into the batch to monitor the repeatability of the analysis, and the relative standard deviation of each ion feature in the quality control samples was used to evaluate reproducibility. For normalization of ion features, isotope-labeled acylcarnitines were used for positive ion mode, isotope-labeled fatty acids were used for negative ion mode, and others were used for both. After normalization by internal standards, quality control samples were clustered tightly on PCA score plots (Fig. S1A), indicating reproducibility was satisfactory. To further analyze metabolic differences between PCT and ANT, partial least square discriminant analysis models were built (Fig. S1B). There was a clear separation between PCT and ANT, and no overfitting of the partial least square discriminant analysis model was found.
Metabolite identification was based on our previously published strategy (24). Accurate mass and fragment patterns of second-order mass spectrum were utilized to search the online databases (Human Metabolome Database, Kyoto Encyclopedia of Genes and Genomes, and Metabolite and Tandem MS Database) and then metabolites were confirmed by chemical standards. Paired nonparametric tests were performed to identify differentially expressed metabolites in PCT. This approach yielded 128 metabolites, including 13 carnitines and acylcarnitines, 68 lipids and fatty acids, and 47 organic acids and bases (Fig. S1C, Table S2). The relative levels of metabolites in PCT and ANT were also visualized on a plotted heat map (Fig. S1D).
To trace upstream variations of the metabolome, transcriptional profiling of the same specimens was conducted. Paired nonparametric tests were performed to discover differentially expressed genes and miRNAs. Of the 22,684 genes profiled, 7941 exhibited significant alterations in PCa. After metabolic pathway analysis and gene set enrichment analysis, we found 27 significantly altered pathways at both the metabolomic and mRNA expression levels in PCT (Fig. 2A), involving in metabolism of cysteine and methionine, amino sugars and nucleotide sugars, glycerophospholipids, lysine, and sphingolipids, among others. Figure 2B visualizes the altered pathways based on metabolic profiling data, among which we identified cysteine and methionine metabolism and amino sugar and nucleotide sugar metabolism as two metabolic pathways of interest as both of them exhibited lower p values and greater pathway impact. Simultaneously, the gene set of these two pathways was specifically enriched in PCT (Figs. 2C–2D).
Fig. 2.

Altered pathways in prostate cancer. (A) Metabolic and transcriptional analysis identified 27 pathways that were significantly altered in prostate cancer. (B) Overview of the pathway analysis based on metabolites alteration. (C) and (D) Gene set enrichment analysis of cysteine and methionine metabolism (NES = 1.48, p = .030), amino sugar and nucleotide sugar metabolism (NES = 1.58, p = .031).
Metabolic Pathway Alterations in PCT
We further investigated the significant alterations in cysteine and methionine metabolism, observed at both the metabolic and transcriptional levels. Compared with ANT, PCT exhibited significant accumulations of choline, S-adenosylhomoserine (SAH), 5-methylthioadensine (MTA), S-adenosylmethionine (SAM), nicotinamide mononucleotide (NMN), nicotinamide adenine dinucleotide (NAD), and nicotinamide adenine dinucleotide phosphate (NADP) and reductions of adenosine and uric acid in PCT (Figs. 3A–3C). Accumulation of choline compound was observed in previous prostate cancer studies (17, 25), which was in accordance with our findings. Choline is considered as a key metabolite in prostate cancer, the positron-labeled choline analogues have been studied for the visualization screening of prostate cancer detection via positron emission tomography (26, 27). SAM is a general methyl donor that transfers methyl groups to acceptors like DNA through methyltransferase (i.e. DNMT, GNMT) with SAH as a by-product. To further investigate these metabolic changes, we examined corresponding gene expression alterations and found genes that encode DNMT (DNMT3A, p = .0299, DNMT3B, p = .0004, DNMT1, p = .0455) and GNMT (GNMT, p = .0006) were significantly up-regulated in PCa. A Pearson correlation analysis indicated that the increase in SAH was significantly correlated with the increase in GNMT (Fig. 3D), which has been associated with decreased levels of regulatory hsa-miR-100–5p in PCa (Table S3) (28). The alterations at the metabolic and transcriptional levels of cysteine and methionine metabolism in PCa are illustrated in Fig. 4A.
Fig. 3.

Significant alterations in cysteine and methionine metabolism. Relative level histograms of (A) choline, SAH, and adenosine (B) MTA, SAM, and uric acid (C) NMN, NAD, and NADP. *: The significant difference, .001 < p < .05, **: .0001 < p < .001, ***: p < .0001. (D) Pearson correlation analysis of SAH and GNMT.
Fig. 4.

Metabolic pathway alterations in PCT. (A) Description of cysteine and methionine metabolism. (B) NAD metabolism and its biological activities. NMN is synthesized from nicotinamide through the catalysis of nicotinamide phosphoribosyltransferase (NAMPT), which is the first step of NAD synthesis by the salvage pathway. NMN is converted into NAD by nicotinamide nucleotide adenylyltransferase (NMNATs) and NAD is subsequently used for NADP generation through mitochondrial NAD kinase (NADKs) catalysis. NADKs are pivotal to balance the NAD pool and NADP pool, which plays a key role in modulating NAD-dependent and NADP-dependent biological reactions. (C) The dysregulation of hexosamine biosynthesis and lysine degradation in prostate cancer. The red and blue fonts indicate significant increases and decreases, respectively, in PCT. ▴: Differential genes or metabolites in discovery and validation phases.
Disruption of cysteine and methionine metabolism also influences oxidative stress through involvement of metabolic intermediates causing endothelial cell damage or inflammation (29). NAD metabolism is a major consequence of reactive oxygen species (ROS) generation, which has been associated with androgenic effects on prostate tissue (30). Subsequently, we found that NMN, NAD, and NADP, which are three key metabolites in NAD metabolism (31), were significantly elevated in PCT. Two genes vital to proper NAD metabolism, NAMPT and NADK2, were also found to be up-regulated in PCT. These findings are summarized in Fig. 4B.
Next, we further explored our observed differential alterations in amino sugar and nucleotide sugar metabolism in PCT. Several metabolites in the hexosamine biosynthesis pathway (HBP) including d-glucosamine 6-phosphate (GlcN-6-P), N-acetyl-d-glucosamine (GlcNAc), N-acetyl-d-glucosamine 6-phosphate (GlcNAc-6-P), and UDP-acetyl-glucosamine (UDP-GlcNAc) increased in PCT. Gene expression data revealed that genes involved in HBP (HK2, GFPT1, GNPNAT1, and UAP1) were also up-regulated in PCT. HBP is part of amino sugar and nucleotide sugar metabolism and integrates diverse metabolic inputs for the biosynthesis of UDP-GlcNAc, a key substrate for O-linked N-acetyl-glucosamine transferase (OGT). OGT is a vital enzyme in the O-GlcNAcylated modification of proteins in the cytosol, mitochondria, and nucleus and has been shown to be elevated at the mRNA level in PCa (32, 33). Our findings of enhanced hexosamine biosynthesis in PCa are shown in Fig. 4C. Taken together, increased flux through the HBP may lead to accumulation of UDP-GlcNAc and subsequent hyperactivity of posttranslational O-GlcNAcylation of diverse nuclear and cytosolic proteins that regulate PCa malignant properties.
We also observed elevated levels of 2-aminoadipic acid, saccharopine, trimethyllysine, and carnitine in PCT, suggesting increased lysine degradation in tumor tissues (Fig. 4C). Acetyl-CoA and carnitine are intermediate metabolites of lysine degradation and play important roles in energy metabolism, including fatty acid β-oxidation. We found that carnitine and acylcarnitines were significantly altered, as carnitine and hydroxylated short-chain acylcarnitine were increased, while medium-chain and long-chain acylcarnitines were decreased (except CN 18:0) in PCT (Fig. S2A). Enzymes of the carnitine cycle (CPT I, CACT, CPT II) shuttle long-chain fatty acids across the mitochondrial membranes, and various acylcarnitines of different lengths are generated during the process by the catalysis of a series of chain-length-specific enzymes (34). In support of increased fatty acid metabolism in PCa, we found that the mRNA levels of the corresponding genes that encode these enzymes were mostly elevated in PCT (Fig. S2C).
In addition, sphingosine and pantothenic acid were elevated in PCT, while dehydroepiandrosterone sulfate and etiocholanolone sulfate were reduced (Fig. S2D). Sphingosine is an intermediate metabolite of sphingolipid metabolism, while pantothenic acid is a pivotal precursor substance of CoA and is important in regulating CoA homeostasis (35). In humans, the adrenal androgen dehydroepiandrosterone sulfate is taken up by prostate cancer cells and converted to dehydroepiandrosterone, which may act as a precursor to dihydrotestosterone (36). Dihydrotestosterone has been shown to play an important role in prostate cancer progression (37).
Validation of the metabolic and transcript alterations in PCT
To validate our findings, we collected additional paired ANT and PCT from another 51 patients (validation cohort). Among them, 14 pairs were subjected to mRNA expression analysis. Multivariate statistical analysis and paired non-parametric tests were performed on the validation cohort to filter differential metabolites and genes. Differential metabolites of PCT and ANT that were confirmed in the validation cohort are given in Fig. 5A with z-score of each metabolite. In addition, 16 benign prostatic hyperplasia (BPH) tissues were investigated, and differential metabolites of PCT and BPH are shown in Fig. 5b.
Fig. 5.

Discovery and validation of sphingosine as a biomarker. (A) Z-score plot of differential metabolites of PCT and ANT in validation cohorts. (B) Z-score plot of differential metabolites of PCT and BPH. (C) Histogram of nine important metabolites. (D) Volcano plot of the differential metabolites of PCT and ANT in validation cohorts. (E) ROC curve of sphingosine to distinguish PCT from ANT in discovery cohorts. (F) ROC curve of sphingosine to distinguish PCT from ANT in validation cohorts. (G) ROC curve of different markers to distinguish PCT within PSA < 10 ng/ml from BPH in validation cohorts. (H) Schematic of sphingolipid metabolism. The red and blue fonts indicate significant increases and decreases, respectively, in PCT. ▴: Differential genes or metabolites in discovery and validation phases.
Discovery and Validation of Metabolic Biomarker(s) of Prostate Cancer
Next, we sought to determine whether potential metabolic biomarkers specific to PCa could be identified from our data. Our approach was to identify metabolites having significant correlation with disease progression but unaltered in ANT and BPH. We found that nine metabolites exhibited this variation tendency (Fig. 5C). Citicoline, choline, pantothenic acid, carnitine C4-OH, GPC, NAD, and sphingosine all increased, while phenylacetyl-glutamine and carnitine C14:2 decreased. In particular, levels of sphingosine increased with disease progression and were significantly elevated (Fig. 5D) in the discovery (2.6-fold, p = .0007) and validation cohorts (2.7-fold, p = .0000), respectively. At the individual patient level, 21 of 25 in the discovery cohort and 43 of 51 in the validation cohort had elevated sphingosine levels in PCT compared with paired ANT. Receiver-operating curves were generated for both cohorts and showed an area under curve of 0.866 in the discovery cohort and 0.812 in the validation cohort (Figs. 5E–5F). Notably, in patients with low PSA level (0–10 ng/ml), sphingosine had better performance to differentiate PCT from BPH than PSA (area under curve of 0.756 versus 0.593) (Fig. 5G). These results suggested that sphingosine may be a potential biomarker for differentiating PCa from normal tissues, including BPH.
We further investigated the mechanisms underlying the increased sphingosine levels observed in our tumor samples. Sphingosine is the substrate for sphingosine kinase to generate sphingosine-1-phosphate (S1P), which subsequently binds to a family of five G protein-coupled receptors, termed S1PR1–5 (Fig. 5H). The resulting signaling cascade has been shown to play an important role in cancer progression (38). S1PR1 signaling can promote tumor cell proliferation and migration through ERK and Rac pathway activation (39), while S1PR3 and S1PR5 signaling leads to enhanced proliferation and migration (40). On the other hand, sphingosine-1-phosphate receptor 2 (S1PR2) is considered to be antitumorigenic and inhibits cells from metastatic spread through directing Rac pathway antagonism as well as via Rho signaling (39, 41) (Fig. 6A). We found significantly diminished S1PR2expression in PCT compared with ANT (Fig. 6B). This was accompanied by up-regulation of RAC3, which encodes the GTP binding protein Rac3 and down-regulation of RND2 and RND3, which encode Rho GTPases (Figs. 6C–6E). These data suggested that down-regulation of S1PR2 played a pivotal role in prostatic carcinogenesis through stimulation of the Rac pathway and blocking of the Rho pathway.
Fig. 6.

Alterations in S1PR pathways. (A) The major roles of S1P receptors in regulating cell proliferation and migration. Differential expression in ANT and PCT of (B) S1PR2, (C) RAC3, (D) RND2, and (E) RND3.
DISCUSSION
In this study, we integrated data from metabolomics and transcriptomics and found significant alterations of several metabolic pathways in prostate cancer at both the metabolic and transcriptional levels. SAM, SAH, and MTA were accumulated in prostate cancer. From the correlation analysis, we found a significant positive correlation between SAH and GNMT. Has-miR-100–5p could target GNMT, which was found to be down-regulated in PCT (Table S3) (28). We deduced that the down-regulation of hsa-miR-100–5p may be related to the elevated expression of GNMT, which in turn affected SAH generation. GNMT has been shown to affect genome stability in multiple manners including regulation of the SAM:SAH ratio, binding to folate, and interaction with environmental carcinogens like aflatoxin B1 (42). Therefore, based on studies in both patient samples and tumor cell lines, GNMT has been suggested to be a tumor susceptibility gene in prostate cancer (43, 44).
Our study also demonstrated accumulation of NAD metabolites (NMN, NAD, NADP) in prostate cancer compared with normal tissues. NAD metabolism participates in various kinds of biological activities, including regulation of oxidative stress. Like many other cancers, the generation of ROS secondary to increased oxidative stress contributes to tumor progression in prostate cancer (45). NAD(P)H oxidase (Nox) systems are associated with ROS generation and have been shown to be a major ROS source in prostate cancer cells through the NAD(P)H-dependent reduction of molecular oxygen (30, 45). In support of this, we found elevated expression in PCT of Nox4, a member of the Nox family (p = .0002, PCT/ANT = 2.94). The increased expression of Nox may contribute to ROS generation and subsequently promote prostate cancer progression.
Genes involved in hexosamine biosynthesis were up-regulated, including HK2, GFPT1, GNPNAT1, and UAP1, along with up-regulation of OGT, which encodes O-linked N-acetylglucosamine transferase. Glucose and glutamine serve as the two pivotal carbon sources in tumor cells and are established hallmarks of tumor metabolism (46, 47). In the setting of glucose deprivation, normal cells can utilize GlcNAc to maintain hexosamine biosynthesis, which in turn promotes glutamine uptake and mediates cell growth and survival (43). Likewise, increased hexosamine biosynthesis occurs in numerous cancers, including prostate cancer, as evidenced by elevated expression of OGT and production of O-GlcNAcylated end-products (48). The HBP can be further driven by androgen receptor signal in prostate cancer (49); the androgen receptor signal can up-regulate expression of GFPT1 and UAP1, two pivotal enzymes in hexosamine biosynthesis that enable prostate cancer cell proliferation (33). Notably, si-RNA-mediated or pharmacologic inhibition of OGT reduced prostate cancer cell viability and decreased expression of cell cycle related genes (33). Our metabolomics and transcriptomics data further support the possibility of OGT as a key therapeutic target in prostate cancer.
Significant β-oxidation of fatty acids in PCT samples was found at both the metabolomic and transcriptional levels. Carnitine and acylcarnitine play a key role in transferring long-chain fatty acid from cytosol to mitochondria or peroxisome for β-oxidation, which was significantly altered in PCT. Furthermore, targeting lipid catabolism may represent a promising therapeutic strategy in prostate cancer. For example, it has been shown that pharmacologic inhibition of CPT1A in prostate cancer cells inhibited androgen receptor signaling and induced apoptosis in both in vitro and in vivo models (50). Likewise, ACAT1 expression was demonstrated to be a potential prognostic biomarker in predicting aggressiveness of prostate cancer (51). In our study, we found 1.6-fold and 2.2-fold elevations in CPT1A and ACAT1 expression, respectively, which highlights the increased β-oxidation of fatty acids in prostate cancer. Studies in other cancers have demonstrated genetic and metabolic alterations of lipids, fatty acids, and acylcarnitines, which enabled tumor cells to meet increased energy demands for cellular proliferation in nutrient-limited and hypoxic tumor microenvironments (16, 52). Further studies are warranted to reveal whether these changes play a similar prominent role in prostate cancer progression.
We further analyzed our data for potential biomarkers to differentiate PCT from ANT and BPH tissues. Sphingosine was found to be the most prominent metabolite as it exhibited significant fold-changes both in discovery and validation phases. Compared with PSA, sphingosine has better sensitivity and specificity in differentiating PCT from BPH, particularly in patients with low PSA level. This finding is particularly clinically relevant as the rate of incidentally diagnosed prostate cancers upon repeat biopsy after initial negative biopsy is ∼20% (53). Thus, better biomarkers are urgently needed to improve the specificity of prostate cancer diagnosis and avoid unnecessary biopsies. The elevated sphingosine levels may be of potential diagnostic utility, particularly in cases of histopathological uncertainty and marginally elevated PSA.
Additional investigation revealed down-regulation of the potent tumor suppressor, S1PR2, along with concurrent increased RAC3 and decreased RND2 and RND3. Although an additional in vitro experiment was not performed to validate the functional consequence of these alterations, previous work demonstrated potent antiproliferative and antimigratory effects in melanoma and glioma cell lines after induction of S1PR2 signaling (54, 55). S1PR2 overexpression also significantly diminished hematogenous metastatic seeding in a melanoma mouse model (56). A recent study showed a novel anti-S1P monoclonal antibody Sphingomab can inhibit bladder cancer metastasis in vitro and in vivo models (57), suggesting pharmaceutical agonists of S1PR2 signaling may hold therapeutic potential in prevention of cancer spread. Future studies are needed to determine whether targeting of this pathway may prevent metastatic spread of prostate cancer cells.
In summary, profiling metabolite content and gene expression in PCT samples enabled comparisons of molecular findings at different levels and deep understanding of the underlying metabolic alterations in prostate cancer. Perturbed metabolism influenced a diverse array of intracellular pathways, including cysteine and methionine metabolism, generation of ROS, lysine degradation, and enhanced hexosamine biosynthesis leading to increased posttranslational O-GlcNacylation of nuclear and cytosolic proteins. We further identified sphingosine as a novel biomarker to differentiate PCT from ANT or BPH, particularly in cases of low PSA levels, and we deduced that diminished downstream S1PR2 signaling may play a key role in the pathogenesis of prostate cancer. Our study by integration of metabolomics and transcriptomics data provides a systems-level perspective of prostate cancer that could facilitate the development of novel therapeutic targets and biomarkers for this disease. Future studies are needed to validate the findings in large number of patients and investigate their potential clinical utilities in prostate cancer.
Supplementary Material
Footnotes
Author contributions: G.X. and Y. Sun designed the research; S.R., Y. Shao, X.Z., F.W., X.L., J.L., G.Y., C.X., G.X., and Y. Sun performed the research; Y. Shao, X.Z., Z.Z., and G.X. analyzed data; and S.R., Y. Shao, C.H., Z.Z., G.X., and Y. Sun wrote the paper.
* The work was supported by the National Basic Research Program (No. 2012CB518303, 2012CB518306) of China, the Key Program (21435006), the Creative Research Group project (No. 21321064) and general projects (81430058, 81101946, 81472397) from the National Natural Science Foundation of China, the Shanghai Pujiang Program (12PJD008), Prostate Cancer Foundation Young Investigator Award, Shanghai Municipal Health and Family Planning Commission Outstanding Young Investigator (XYQ2013077), Shanghai Municipal Education Commission. Additional support was provided by the Intramural Research Program of the National Institute of Neurological Disorders and Stroke at the National Institutes of Health (Bethesda, MD). The content is solely the responsibility of the authors and does not necessarily represent the official views of the National Institutes of Health.
 This article contains supplemental material Tables S1-S3 and Figs. S1 and S2.
1 The abbreviations used are:
- PCa
- prostate cancer
- PCT
- prostate cancer tissue
- ANT
- adjacent noncancerous tissue
- LC-MS
- liquid chromatography-mass spectrometry
- MTBE
- methyl tert-butyl ether
- PSA
- prostate-specific antigen
- PCA
- principle component analysis
- SAH
- S-adenosylhomoserine
- MTA
- 5-methyltioadenosine
- SAM
- S-adenosylmethionine
- NMN
- nicotinamide mononucleotide
- NAD
- nicotinamide adenine dinucleotide
- NADP
- nicotinamide adenine dinucleotide phosphate
- GlcN-6-P
- D-glucosamine 6-phosphate
- GlcNAc
- N-acetyl-D-glucosamine
- GlcNAc-6P
- N-acetyl-D-glucosamine 6-phosphate
- UDP-GlcNAc
- UDP-acetyl-glucosamine
- HBP
- hexosamine biosynthesis pathway
- OGT
- O-linked N-acetyl-glucosamine transferase
- BPH
- benign prostatic hyperplasia
- S1P
- sphingosine-1-phosphate.
REFERENCES
- 1.Sharma S. (2014) Imaging and intervention in prostate cancer: Current perspectives and future trends. Indian J. Radiol. Imaging 24, 139–148 [DOI] [PMC free article] [PubMed] [Google Scholar]
- 2.Singh A. P., Bafna S., Chaudhary K., Venkatraman G., Smith L., Eudy J. D., Johansson S. L., Lin M. F., and Batra S. K. (2008) Genome-wide expression profiling reveals transcriptomic variation and perturbed gene networks in androgen-dependent and androgen-independent prostate cancer cells. Cancer Lett. 259, 28–38 [DOI] [PMC free article] [PubMed] [Google Scholar]
- 3.Hsing A. W., Tsao L., and Devesa S. S. (2000) International trends and patterns of prostate cancer incidence and mortality. Int. J. Cancer 85, 60–67 [DOI] [PubMed] [Google Scholar]
- 4.Ding Z., Wu C. J., Chu G. C., Xiao Y., Ho D., Zhang J., Perry S. R., Labrot E. S., Wu X., Lis R., Hoshida Y., Hiller D., Hu B., Jiang S., Zheng H., Stegh A. H., Scott K. L., Signoretti S., Bardeesy N., Wang Y. A., Hill D. E., Golub T. R., Stampfer M. J., Wong W. H., Loda M., Mucci L., Chin L., and DePinho R. A. (2011) SMAD4-dependent barrier constrains prostate cancer growth and metastatic progression. Nature 470, 269–273 [DOI] [PMC free article] [PubMed] [Google Scholar]
- 5.Rantalainen M., Cloarec O., Beckonert O., Wilson I., Jackson D., Tonge R., Rowlinson R., Rayner S., Nickson J., Wilkinson R. W., Mills J. D., Trygg J., Nicholson J. K., and Holmes E. (2006) Statistically integrated metabonomic-proteomic studies on a human prostate cancer xenograft model in mice. J. Proteome Res. 5, 2642–2655 [DOI] [PubMed] [Google Scholar]
- 6.Sreekumar A., Poisson L. M., Rajendiran T. M., Khan A. P., Cao Q., Yu J., Laxman B., Mehra R., Lonigro R. J., Li Y., Nyati M. K., Ahsan A., Kalyana-Sundaram S., Han B., Cao X., Byun J., Omenn G. S., Ghosh D., Pennathur S., Alexander D. C., Berger A., Shuster J. R., Wei J. T., Varambally S., Beecher C., and Chinnaiyan A. M. (2009) Metabolomic profiles delineate potential role for sarcosine in prostate cancer progression. Nature 457, 910–914 [DOI] [PMC free article] [PubMed] [Google Scholar] [Research Misconduct Found]
- 7.Vanaja D. K., Ballman K. V., Morlan B. W., Cheville J. C., Neumann R. M., Lieber M. M., Tindall D. J., and Young C. Y. (2006) PDLIM4 repression by hypermethylation as a potential biomarker for prostate cancer. Clin. Cancer Res. 12, 1128–1136 [DOI] [PubMed] [Google Scholar]
- 8.Lapointe J., Li C., Higgins J. P., van de Rijn M., Bair E., Montgomery K., Ferrari M., Egevad L., Rayford W., Bergerheim U., Ekman P., DeMarzo A. M., Tibshirani R., Botstein D., Brown P. O., Brooks J. D., and Pollack J. R. (2004) Gene expression profiling identifies clinically relevant subtypes of prostate cancer. Proc. Natl. Acad. Sci. U.S.A. 101, 811–816 [DOI] [PMC free article] [PubMed] [Google Scholar]
- 9.Prensner J. R., Iyer M. K., Balbin O. A., Dhanasekaran S. M., Cao Q., Brenner J. C., Laxman B., Asangani I. A., Grasso C. S., Kominsky H. D., Cao X., Jing X., Wang X., Siddiqui J., Wei J. T., Robinson D., Iyer H. K., Palanisamy N., Maher C. A., and Chinnaiyan A. M. (2011) Transcriptome sequencing across a prostate cancer cohort identifies PCAT-1, an unannotated lincRNA implicated in disease progression. Nat. Biotechnol. 29, 742–749 [DOI] [PMC free article] [PubMed] [Google Scholar]
- 10.Rhodes D., Barrette T. R., Rubin M. A., Ghosh D., and Chinnaiyan A. M. (2002) Meta-analysis of microarrays: interstudy validation of gene expression profiles reveals pathway dysregulation in prostate cancer. Cancer Res. 62, 4427–4433 [PubMed] [Google Scholar]
- 11.LaTulippe E., Satagopan J., Smith A., Scher H., Scardino P., Reuter V., and Gerald W. L. (2002) Comprehensive gene expression analysis of prostate cancer reveals distinct transcriptional programs associated with metastatic disease. Cancer Res. 62, 4499–4506 [PubMed] [Google Scholar]
- 12.Singh D., Febbo P. G., Ross K., Jackson D. G., Manola J., Ladd C., Tamayo P., Renshaw A. A., D'Amico A. V, Richie J. P., Lander E. S., Loda M., Kantoff P. W., Golub T. R., and Sellers W. R. (2002) Gene expression correlates of clinical prostate cancer behavior. Cancer Cell 1, 203–209 [DOI] [PubMed] [Google Scholar]
- 13.Masters J. R. (2007) Clinical applications of expression profiling and proteomics in prostate cancer. Anticancer Res. 27, 1273–1276 [PubMed] [Google Scholar]
- 14.Kallioniemi O. (2005) Functional genomics and transcriptomics of prostate cancer: Promises and limitations. BJU Int. 96, 10–15 [DOI] [PubMed] [Google Scholar]
- 15.Priolo C., Pyne S., Rose J., Regan E. R., Zadra G., Photopoulos C., Cacciatore S., Schultz D., Scaglia N., McDunn J., De Marzo A. M., and Loda M. (2014) AKT1 and MYC Induce distinctive metabolic fingerprints in human prostate cancer. Cancer Res. 74, 7198–7204 [DOI] [PMC free article] [PubMed] [Google Scholar]
- 16.Zhang G., He P., Tan H., Budhu A., Gaedcke J., Ghadimi B. M., Ried T., Yfantis H. G., Lee D. H., Maitra A., Hanna N., Alexander H. R., and Hussain S. P. (2013) Integration of metabolomics and transcriptomics revealed a fatty acid network exerting growth inhibitory effects in human pancreatic cancer. Clin. Cancer Res. 19, 4983–4993 [DOI] [PMC free article] [PubMed] [Google Scholar]
- 17.Bertilsson H., Tessem M.-B., Flatberg A., Viset T., Gribbestad I., Angelsen A., and Halgunset J. (2012) Changes in gene transcription underlying the aberrant citrate and choline metabolism in human prostate cancer samples. Clin. Cancer Res. 18, 3261–3269 [DOI] [PubMed] [Google Scholar]
- 18.Matyash V., Liebisch G., Kurzchalia T. V., Shevchenko A., and Schwudke D. (2008) Lipid extraction by methyl-tert-butyl ether for high-throughput lipidomics. J. Lipid Res. 49, 1137–1146 [DOI] [PMC free article] [PubMed] [Google Scholar]
- 19.Chen S., Hoene M., Li J., Li Y., Zhao X., Häring H. U., Schleicher E. D., Weigert C., Xu G., and Lehmann R. (2013) Simultaneous extraction of metabolome and lipidome with methyl tert-butyl ether from a single small tissue sample for ultra-high performance liquid chromatography/mass spectrometry. J. Chromatogr. A 1298, 9–16 [DOI] [PubMed] [Google Scholar]
- 20.Ren S., Peng Z., Mao J. H., Yu Y., Yin C., Gao X., Cui Z., Zhang J., Yi K., Xu W., Chen C., Wang F., Guo X., Lu J., Yang J., Wei M., Tian Z., Guan Y., Tang L., Xu C., Wang L., Gao X., Tian W., Wang J., Yang H., Wang J., and Sun Y. (2012) RNA-seq analysis of prostate cancer in the Chinese population identifies recurrent gene fusions, cancer-associated long noncoding RNAs and aberrant alternative splicings. Cell Res. 22, 806–821 [DOI] [PMC free article] [PubMed] [Google Scholar]
- 21.Zhao X., Xu F., Qi B., Hao S., Li Y., Li Y., Zou L., Lu C., Xu G., and Hou L. (2014) Serum metabolomics study of polycystic ovary syndrome based on liquid chromatography–mass spectrometry. J. Proteome Res. 13, 1101–1111 [DOI] [PubMed] [Google Scholar]
- 22.Shao Y., Zhu B., Zheng R., Zhao X., Yin P., Lu X., Jiao B., Xu G., and Yao Z. (2015) Development of urinary pseudotargeted LC-MS-based metabolomics method and its application in hepatocellular carcinoma biomarker discovery. J. Proteome Res. 14, 906–916 [DOI] [PubMed] [Google Scholar]
- 23.Bijlsma S., Bobeldijk I., Verheij E., Ramaker R., Kochhar S., Macdonald I., van Ommen B., and Smilde A. K. (2006) Large-scale human metabolomics studies: A strategy for data (pre-) processing and validation. Anal. Chem. 78, 567–574 [DOI] [PubMed] [Google Scholar]
- 24.Chen J., Zhao X., Fritsche J., Yin P., Schmitt-Kopplin P., Wang W., Lu X., Häring H., Schleicher E. D., Lehmann R., and Xu G. (2008) Practical approach for the identification and isomer elucidation of biomarkers detected in a metabonomic study for the discovery of individuals at risk for diabetes by integrating the chromatographic and mass spectrometric information. Anal. Chem. 80, 1280–1289 [DOI] [PubMed] [Google Scholar]
- 25.Ackerstaff E., Pflug B. R., Nelson J. B., and Bhujwalla Z. M. (2001) Detection of increased choline compounds with proton nuclear magnetic resonance spectroscopy subsequent to malignant transformation of human prostatic epithelial cells. Cancer Res. 61, 3599–3603 [PubMed] [Google Scholar]
- 26.Hara T., Kosaka N., and Kishi H. (1998) PET Imaging of Prostate Cancer Using Carbon-11-Choline. J. Nucl. Med. 39, 990–995 [PubMed] [Google Scholar]
- 27.de Jong I. J., Pruim J., Elsinga P. H., Vaalburg W., and Mensink H. J. (2002) Visualization of prostate cancer with 11C-choline positron emission tomography. Eur. Urol. 42, 18–23 [DOI] [PubMed] [Google Scholar]
- 28.Koh T. C., Lee Y. Y., Chang S. Q., and Nissom P. M. (2009) Identification and expression analysis of miRNAs during batch culture of HEK-293 cells. J. Biotechnol. 140, 149–155 [DOI] [PubMed] [Google Scholar]
- 29.Vijaya Lakshmi S. V., Naushad S. M., Rupasree Y., Seshagiri Rao D., and Kutala V. K. (2011) Interactions of 5′-UTR thymidylate synthase polymorphism with 677C→ T methylene tetrahydrofolate reductase and 66A→ G methyltetrahydrofolate homocysteine methyl-transferase reductase polymorphisms determine susceptibility to coronary artery disease. J. Atheroscler. Thromb. 18, 56–64 [DOI] [PubMed] [Google Scholar]
- 30.Kumar B., Koul S., Khandrika L., Meacham R. B., and Koul H. K. (2008) Oxidative stress is inherent in prostate cancer cells and is required for aggressive phenotype. Cancer Res. 68, 1777–1785 [DOI] [PubMed] [Google Scholar]
- 31.Ying W. (2008) NAD+/NADH and NADP+/NADPH in cellular functions and cell death: Regulation and biological consequences. Antioxid. Redox Signal. 10, 179–206 [DOI] [PubMed] [Google Scholar]
- 32.Slawson C., Copeland R. J., and Hart G. W. (2010) O-GlcNAc signaling: A metabolic link between diabetes and cancer? Trends Biochem. Sci 35, 547–555 [DOI] [PMC free article] [PubMed] [Google Scholar]
- 33.Itkonen H. M., Minner S., Guldvik I. J., Sandmann M. J., Tsourlakis M. C., Berge V., Svindland A., Schlomm T., and Mills I. G. (2013) O-GlcNAc transferase integrates metabolic pathways to regulate the stability of c-MYC in human prostate cancer cells. Cancer Res. 73, 5277–5287 [DOI] [PubMed] [Google Scholar]
- 34.Isaguirre A. C., Olsina R. A., Martinez L. D., Lapierre A. V., and Cerutti S. (2013) Rapid and sensitive HILIC–MS/MS analysis of carnitine and acetylcarnitine in biological fluids. Anal. Bioanal. Chem. 405, 7397–7404 [DOI] [PubMed] [Google Scholar]
- 35.Tahiliani A. G., and Beinlich C. J. (1991) Pantothenic acid in health and disease. Vitam. Horm. 46, 165–228 [DOI] [PubMed] [Google Scholar]
- 36.Mohler J. L., Gregory C. W., Ford O. H. 3rd, Kim D., Weaver C. M., Petrusz P., Wilson E. M., and French F. S. (2004) The androgen axis in recurrent prostate cancer. Clin. Cancer Res. 10, 440–448 [DOI] [PubMed] [Google Scholar]
- 37.Wilson E. M. (2014) More evidence intratumoral DHT synthesis drives castration-resistant prostate cancer. Asian J. Androl. 16, 99–100 [DOI] [PMC free article] [PubMed] [Google Scholar]
- 38.Milstien S., and Spiegel S. (2006) Targeting sphingosine-1-phosphate: A novel avenue for cancer therapeutics. Cancer Cell 9, 148–150 [DOI] [PubMed] [Google Scholar]
- 39.Pyne N. J., and Pyne S. (2010) Sphingosine 1-phosphate and cancer. Nat. Rev. Cancer 10, 489–503 [DOI] [PubMed] [Google Scholar]
- 40.Blaho V. A., and Hla T. (2014) An update on the biology of sphingosine 1-phosphate receptors. J. Lipid Res. 55, 1596–1608 [DOI] [PMC free article] [PubMed] [Google Scholar]
- 41.Adada M., Canals D., Hannun Y. A., and Obeid L. M. (2013) Sphingosine-1-phosphate receptor 2. FEBS J. 280, 6354–6366 [DOI] [PMC free article] [PubMed] [Google Scholar]
- 42.Chen M., Huang Y.-L., Huang Y.-C., Shui I. M., Giovannucci E., Chen Y.-C., and Chen Y.-M. (2014) Genetic polymorphisms of the glycine N-methyltransferase and prostate cancer risk in the health Professionals Follow-Up Study. PLoS ONE 9, e94683. [DOI] [PMC free article] [PubMed] [Google Scholar]
- 43.Huang Y. C., Lee C. M., Chen M., Chung M. Y., Chang Y. H., Huang W. J., Ho D. M., Pan C. C., Wu T. T., Yang S., Lin M. W., Hsieh J. T., and Chen Y. M. (2007) Haplotypes, loss of heterozygosity, and expression levels of glycine N-methyltransferase in prostate cancer. Clin. Cancer Res. 13, 1412–1420 [DOI] [PubMed] [Google Scholar]
- 44.Song Y. H., Shiota M., Kuroiwa K., Naito S., and Oda Y. (2011) The important role of glycine N-methyltransferase in the carcinogenesis and progression of prostate cancer. Mod. Pathol. 24, 1272–1280 [DOI] [PubMed] [Google Scholar]
- 45.Khandrika L., Kumar B., Koul S., Maroni P., and Koul H. K. (2009) Oxidative stress in prostate cancer. Cancer Lett. 282, 125–136 [DOI] [PMC free article] [PubMed] [Google Scholar]
- 46.Lynch T. P., Ferrer C. M., Jackson S. R., Shahriari K. S., Vosseller K., and Reginato M. J. (2012) Critical role of O-Linked beta-N-acetylglucosamine transferase in prostate cancer invasion, angiogenesis, and metastasis. J. Biol. Chem. 287, 11070–11081 [DOI] [PMC free article] [PubMed] [Google Scholar]
- 47.Wellen K. E., Lu C., Mancuso A., Lemons J. M., Ryczko M., Dennis J. W., Rabinowitz J. D., Coller H. A., and Thompson C. B. (2010) The hexosamine biosynthetic pathway couples growth factor-induced glutamine uptake to glucose metabolism. Genes Dev. 24, 2784–2799 [DOI] [PMC free article] [PubMed] [Google Scholar]
- 48.Józwiak P., Forma E., Bryś M., and Krześlak A. (2014) O-glcnacylation and metabolic reprograming in cancer. Frontiers Endocrinol. 5, 145. [DOI] [PMC free article] [PubMed] [Google Scholar]
- 49.Pagliarulo V., Bracarda S., Eisenberger M. A., Mottet N., Schröder F. H., Sternberg C. N., and Studer U. E. (2012) Contemporary role of androgen deprivation therapy for prostate cancer. Eur. Urol. 61, 11–25 [DOI] [PMC free article] [PubMed] [Google Scholar]
- 50.Schlaepfer I. R., Rider L., Rodrigues L. U., Gijón M. A., Pac C. T., Romero L., Cimic A., Sirintrapun S. J., Glodé L. M., Eckel R. H., and Cramer S. D. (2014) Lipid catabolism via CPT1 as a therapeutic target for prostate cancer. Mol. Cancer Therapeutics 13, 2361–2371 [DOI] [PMC free article] [PubMed] [Google Scholar]
- 51.Saraon P., Trudel D., Kron K., Dmitromanolakis A., Trachtenberg J., Bapat B., van der Kwast T., Jarvi K. A., and Diamandis E. P. (2014) Evaluation and prognostic significance of ACAT1 as a marker of prostate cancer progression. Prostate 74, 372–380 [DOI] [PubMed] [Google Scholar]
- 52.Le A., Rajeshkumar N. V., Maitra A., and Dang C. V. (2012) Conceptual framework for cutting the pancreatic cancer fuel supply. Clin. Cancer Res. 18, 4285–4290 [DOI] [PMC free article] [PubMed] [Google Scholar]
- 53.Presti J. C., Jr. (2009) Repeat prostate biopsy—When, where, and how. Urologic Oncol. 27, 312–314 [DOI] [PubMed] [Google Scholar]
- 54.Arikawa K., Takuwa N., Yamaguchi H., Sugimoto N., Kitayama J., Nagawa H., Takehara K., and Takuwa Y. (2003) Ligand-dependent inhibition of B16 melanoma cell migration and invasion via endogenous S1P2 G protein-coupled receptor requirement of inhibition of cellular Rac activity. J. Biol. Chem. 278, 32841–32851 [DOI] [PubMed] [Google Scholar]
- 55.Malchinkhuu E., Sato K., Maehama T., Mogi C., Tomura H., Ishiuchi S., Yoshimoto Y., Kurose H., and Okajima F. (2008) S1P 2 receptors mediate inhibition of glioma cell migration through Rho signaling pathways independent of PTEN. Biochem. Biophys. Res. Commun. 366, 963–968 [DOI] [PubMed] [Google Scholar]
- 56.Yamaguchi H., Kitayama J., Takuwa N., Arikawa K., Inoki I., Takehara K., Nagawa H., and Takuwa Y. (2003) Sphingosine-1-phosphate receptor subtype-specific positive and negative regulation of Rac and haematogenous metastasis of melanoma cells. Biochem. J. 374, 715–722 [DOI] [PMC free article] [PubMed] [Google Scholar]
- 57.Ponnusamy S., Selvam S. P., Mehrotra S., Kawamori T., Snider A. J., Obeid L. M., Shao Y., Sabbadini R., and Ogretmen B. (2012) Communication between host organism and cancer cells is transduced by systemic sphingosine kinase 1/sphingosine 1-phosphate signalling to regulate tumour metastasis. EMBO Mol. Med. 4, 761–775 [DOI] [PMC free article] [PubMed] [Google Scholar]
Associated Data
This section collects any data citations, data availability statements, or supplementary materials included in this article.