Abstract
Solvent assisted ionization inlet (SAII) and matrix assisted ionization vacuum (MAIV) were used to rapidly quantify an antipsychotic drug, clozapine, directly from surfaces with minimal sample preparation. This simple surface analysis method based on SAII- and MAIV-mass spectrometry (MS) was developed to allow detection of endogenous lipids, metabolites, and clozapine directly from mouse brain tissue sections. Rapid surface assessment was achieved by SAII with the assistance of heat on the mass spectrometer inlet, and MAIV showed capability on heat-limited instruments with better reproducibility. In addition, isotope dilution and standard addition were used without sample clean-up, and the results correlate well to liquid chromatography (LC)-tandem MS with sample work-up. Using the simple surface methods, standard solutions containing clozapine and deuterated sample (clozapine-d8) at different concentration ratios were used to extract and quantify clozapine from brain tissue sections of drug-treated mouse at different thicknesses. The amount of clozapine extracted by these surface methods was independent of tissue thickness.
Introduction
An ideal analysis method should be fast, simple, able to quantify material with minimal effort, and provide spatial resolution. However, those ideals are difficult to achieve in combination. Characterization methods based on mass spectrometry (MS) have gained popularity in pharmaceutical industry for speed of analysis, sensitivity, selectivity, and the ability to be coupled with separation methods such as liquid chromatography (LC). 1, 2 In addition to identification, rapid quantification of drugs is important in drug discovery. Quantifying drugs and their metabolites in biological tissue is an even more arduous task. MS alone is a semi-quantitative method, since ion intensity values can vary significantly during acquisition. 3 However, the signal ratio with isotope labeled analyte is reasonably reproducible.3 Isotope dilution is commonly used in MS-based quantification methods4,5 (e.g. LC tandem MS6,7). The traditional LC-MS method requires sample work-up,8,9 which can be time and labor-intensive, and removes the analyte form its native environment, such as a surface.
MS has been used to provide chemical information directly from surfaces.10,11 Information on relative amount of analytes from surfaces is achieved by MS imaging12,13 using the mass to charge ratio (m/z) and a color code for the ion abundances detected. In addition, MS imaging provides location of compounds within a surface. Quantification has been reported by spotting internal standard on the tissue section.14,15
Matrix-assisted laser desorption/ionization (MALDI) is widely used in molecular imaging, providing relative amount and spatial information for peptides, proteins, 16, 17 lipids, 18 metabolites,19 etc. from surfaces such as tissue sections. Critical to the success in MALDI-MS is the matrix sample preparation which may result in sample adulteration20 and potential chemical delocalization if the surface wets during matrix application.21 Ambient surface analysis methods, such as desorption electrospray ionization (DESI) 22 and nanospray desorption electrospray ionization (nanoDESI)23 operate without the use of matrix compounds, allowing surface samples to be analyzed at atmospheric pressure with no or minor sample preparation and less chemical background.24–26 For example, the antipsychotic drug clozapine from mouse brain tissue has been imaged using DESI.3,27 Typical resolution is ~200 μm.28 Notable exceptions are those that make use of an organic matrix.29–33 Hours and sometimes days are required for MS imaging especially at high spatial resolution using sophisticated laser focusing setups.29,34,35
Spatial resolution can be useful, but is often not required. If the exact location of surface analytes is not required, a liquid microjunction surface sampling probe can be used to extract analytes employing a liquid junction formed between a probe and the surface in a more rapid manner.36 A solid-phase tissue sampling method achieved by thermal evaporation provided rapid volatile analyte identification capabilities.37 Some of the ionization methods require critical connections and precise alignments of the ionization apparatuses, requiring considerable user expertise to obtain reliable performance.38
The recently developed solvent assisted ionization inlet (SAII) 39 and matrix assisted ionization vacuum (MAIV) 40 produce mass spectra similar to electrospray ionization (ESI) without the use of any external voltage or a laser. SAII has sensitivity comparable to ESI when the position of the capillary which introduces samples to the mass spectrometer inlet is at the “hot spot” inside of the heated inlet.39–42 A recent study showed ESI-like ions can be produced when the analyte solution was pipetted near the entrance aperture of a heated mass spectrometer inlet tube.43,44 MAIV was demonstrated to produce ESI-like ions directly from a surface, e.g. mouse brain tissue sections, by simply spotting a MAIV matrix on tissue and exposing it to vacuum without the requirements of additional heat, voltage, or a laser.40,45
Here, we report the development of SAII and MAIV for rapid surface analysis of the drug clozapine from brain tissue sections of drug-treated mice along with endogenous lipids and other small molecules. Isotope dilution and standard addition were employed for quantification.
Materials and Methods
Materials
Chemicals
Clozapine (MW 326) and deuterated clozapine-d8 (MW 334) standards were purchased from Santa Cruz Biotechnology (Santa Cruz, CA). Methanol (MeOH), ethanol (EtOH), acetone, and HPLC grade water was obtained from EMD chemicals (Gibbstown, NJ) and acetonitrile (ACN) from Fisher Scientific Inc. (Pittsburgh, PA). 3-Nitrobenzonitrile (3-NBN) was purchased from TCI America (Portland, OR, USA). Luxol fast blue was obtained from Sigma Aldrich (St. Louis, MO). All chemicals were used as received.
Mouse brain tissue
Mouse brain tissue sections were cut with a cryostat and mounted on microscopy glass slides. Briefly, mice were injected intraperitoneally with 50 mg kg−1 clozapine and sacrificed 60 minutes post-dosing with isoflurane overdose followed by perfusion of 20 ml of ice cold phosphate buffered saline. Brains were rapidly removed and frozen. Tissue sections were sliced on a Cryostat (Leica) to 10 or 20 μm thicknesses and sections were stored at −80 °C prior to analysis. All animal procedures were approved by the Indiana University Bloomington Institutional Animal Use and Care Committee.
Instrumentation
The LTQ Velos mass spectrometer (Thermo, Bremen, Germany) was used for SAII and LC-ESI studies. For ESI, the voltage was 3 kV, sheath gas was 8, and inlet temperature at 275 °C.46 For SAII, the ESI source of the LTQ Velos instrument was removed for direct access to the inlet as previously described.31 The temperature of the inlet can be adjusted through the commercial temperature control of the inlet. In this study the inlet tube was operated at 200 °C to avoid peak broadening while ensuring sufficient ion intensity. The sheath gas, auxiliary gas, sweep gas, and capillary voltage were all set at 0. The mass spectra were acquired with automatic gain control on with 5 microscans max injection time of 20. For tandem mass spectrometry, collision energy of 35 was applied for collision induced dissociation (CID) to fragment parent ions.
The SYNAPT G2 (Waters, Manchester, UK) mass spectrometer was used for MAIV study. For MAIV on the MALDI source, the commercial intermediate pressure MALDI was used with “LSIV” settings as previously reported.47 Briefly, the plate voltage was set to 0, the laser power was 0 and was not initiated. An extraction voltage of 10 V was applied. For MAIV operating at atmospheric pressure, the LockSpray source was removed and overridden.40 A modified skimmer cone was used as previously introduced to provide better vacuum, with a notch to allow gas flow.48
A nanoAcquity UPLC system (Waters, Milford, MA) equipped with a 1 mm × 50 mm column packed with 1.7 μm C18 BEH particles was used for LC-ESI-MS/MS quantification. A 3 min gradient using ACN/H2O/0.1% formic acid (organic composition from 40% to 95%) was employed similar to a previous study using the same system.41
An optical microscope (Nikon, ECLIPSE, LV 100) was used to determine the diameters of the surface areas analyzed. Luxol fast blue was doped into extracting solvent and matrix solution to enhance the optical microscopic image by leaving the blue color on the extraction area.
Sample Preparation and Clozapine Quantification using LC-ESI-MS/MS
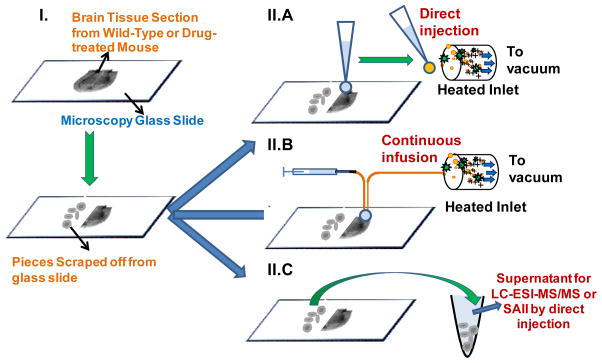
Half of a tissue section was scraped from the glass slide holding the tissue and dissolved in 50 μL MeOH. The mixture was vortexed for 1 min before being loaded in centrifuge for 5 min. The supernatant was used for quantification. The other half was reserved for surface analysis (Scheme 1.I and II.C).
Scheme 1.
Schematic representation of the workflow of SAII and typical LC-tandem MS methods. (I) Half of the brain tissue section from drug-treated mouse was scraped off from the glass slide, the other half was preserved for surface analysis. (II) From the preserved tissue section, surface SAII was performed in (A) discontinuous mode – extracting materials by solvent-droplet hanging at the pipet tip, and (B) continuous mode – extracting by liquid junction formed at the end of two pieces of silica tube. MS and MS/MS were performed in continuous mode. (C) Typical sample work-up was performed with the scraped tissue, the supernatant after vortex and centrifugation was analyzed by either LC-ESI-MS/MS27 or SAII directly injection.
The calibration curve was obtained by LC-ESI-MS/MS using clozapine standard solutions at concentration of 10, 25, 50, 100, and 200 fmol μL−1 plotted against peak area. For sample work-up, 1 μL supernatant was diluted by 20-fold and 1 μL was injected onto the UPLC column. For the comparison with surface SAII quantification, 1 μL MeOH was used to extract material from the tissue section from drug-treated mouse. The 1 μL solution was diluted by 147-fold before injected into UPLC system. All the LC-MS/MS analyses were performed in triplicates.
Surface Sample Introduction Methods based on SAII
Surface SAII in discontinuous mode
Solution of 0.3 μL of MeOH hanging from a pipet tip was touched to a control mouse brain tissue section to allow the droplet to extract material from the surface (Scheme 1. II.A). The MeOH droplet was held still touching the surface of the mouse brain tissue for about 3 seconds before it was drawn back into the tip. The solvent-containing extracted material was subsequently directly transferred into the heated inlet capillary of the LTQ Velos by placing the pipet tip near the entrance aperture where the droplet was drawn immediately into the inlet by the vacuum of the mass spectrometer inducing ionization in the inlet tube.
Surface SAII in continuous mode
Two pieces of 20 cm long fused silica tube (75 μm i.d., 360 μm o.d., Polymicro Technologies, Phoenix, AZ) were taped near the ends at ~90° to keep a distance of about 1 mm between the two ends. Methanol was pumped through one piece of fused silica tube by a syringe pump (Fusion 400, Chemyx Inc., Stafford, TX) at 5 μL min−1 flow from the non-taped end. The non-taped end of the other piece of fused silica tube was inserted about 0.2 mm inside the mass spectrometer inlet. A liquid junction bridge of the solvent was formed between the tips of the silica tubes with the assistance of vacuum in the mass spectrometer. A constant flow of MeOH was created between the tips so that the formed liquid junction droplet touched against the drug-treated mouse brain tissue section. Material from the surface was continuously extracted by the liquid junction, and the solvent containing the extracted material was transferred to the mass spectrometer through the second fused silica tube (Scheme 1. II.B).
Quantification by SAII
Isotope dilution and standard addition were used to quantify clozapine from drug-treated mouse brain tissue. Stock solutions of clozapine and clozapine-d8 were prepared in EtOH and acetone at 1 mg mL−1, respectively. The stock solution was diluted to 20 pmol μL−1 by water, and MeOH was used for further dilutions. Five standard solutions were prepared. In each single solution, the concentration of clozapine-d8 was held constant at 2 pmol μL−1 and the concentration of clozapine was varied. The final clozapine:clozapine-d8 molar ratios were 0:1, 0.5:1, 1:1, 1.5:1, and 2:1.
For the quantification from solution, 0.5 μL of each solution was drawn into the 20 μL pipet tip (Fisher Scientific, Pittsburgh, PA) and directly introduced into the heated inlet tube of the LTQ Velos. Eight repetitive measurements were performed from each clozapine/clozapine-d8 standard and the ion intensities of the singly charged protonated ions from clozapine (m/z 327) and clozapine-d8 (m/z 335) were recorded. The intensity ratio at m/z 327:335 was calculated for each measurement and averaged. The average intensity ratio at m/z 327:335 is plotted versus the concentration ratio of clozapine:clozapine-d8, and the standard deviation was used to represent the error bar.
For the quantification from mouse brain tissue, 1 μL of each solution was drawn into a long-tailed ultra micro gel tip (Genesee Scientific, San Diego, CA) and carefully deposited on the sample surface. About 0.8 μL of the standard solution was picked up by the same pipet tip after ~3 seconds and introduced into the heated inlet. The signals were plotted the same way as using solution directly from the vial. The amount of clozapine extracted from the surface is determined by extending the calibration curve to find the intersection with the X-axis. Both the vehicle and drug-treated mouse brain tissue sections were analyzed with the vehicle mice serving as the control.
Surface Analysis and Quantification by MAIV
MAIV operating from intermediate pressure vacuum
A series of standard mixtures of clozapine:clozapine-d8 at different concentration ratios were used. The concentration ratios were the same as in SAII (0:1, 0.5:1, 1:1, 1.5:1, 2:1), but at double the concentration. The standard clozapine:clozapine-d8 mixture was pre-mixed with a 3-NBN solution made by dissolving 5 mg in 100 μL ACN at 1:1 volume ratio. A solution of 0.5 μL matrix/clozapine:clozapine-d8 mixtures was spotted on the tissue section. The tissue section was loaded into the vacuum of the MALDI source after spotting each standard, and data acquisition was started as soon as the sample plate was indexed in the source. The mass spectrum was acquired for about 2 min. Brain tissue sections from both control and drug-treated mice were analyzed the same way.
MAIV operating from atmospheric pressure
The calibration curve was obtained using control mouse brain tissue sections. A series of standard solution of clozapine:clozapine-d8 was prepared at the concentration ratio of 0:1, 1:1, 2:1, 3:1, with the concentration of clozapine-d8 held at 4 pmol μL−1. The standard clozapine:clozapin-d8 solution was also pre-mixed with the 3-NBN solution. Four 1 μL matrix/clozapine:clozapine-d8 mixtures were spotted on the tissue surface. Half of the tissue section was covered by this procedure. The tissue with half of it covered by the matrix/clozapine:clozapine-d8 mixture was exposed to vacuum. This was accomplished by holding the glass slide against the modified skimmer cone where it was held by the vacuum for 10 minutes. For the quantification from the brain tissue section of drug-treated mouse, half of the tissue section was covered by the mixture of 3-NBN and 4 pmol μL−1 clozapine-d8 at 1:1 volume ratio. The signal intensity ratio at m/z 327:335 was recorded and the amount of clozapine was quantified by standard addition method from the calibration curve.
Results and Discussion
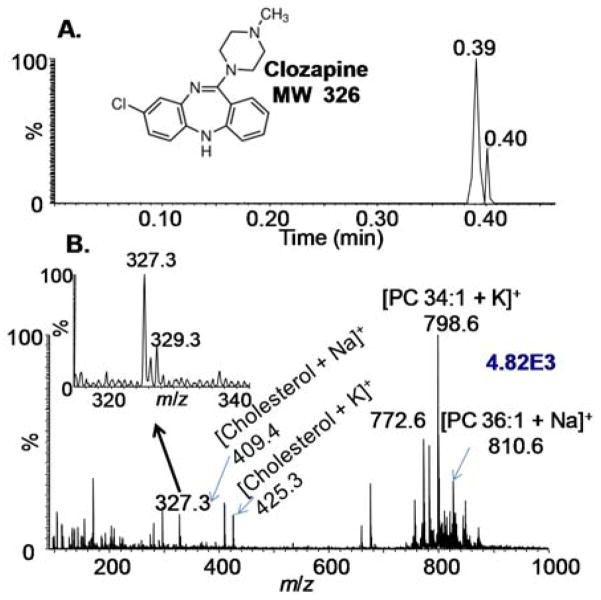
SAII has been reported to produce ESI-like ions by injecting analyte solution into a heated inlet of a mass spectrometer.43,44 For analytes on a surface, such as tissue sections, liquid extraction using proper solvents can be employed prior to SAII. The material on the surface of a 20 μm-thick brain tissue section of a drug-treated mouse was extracted by a MeOH droplet hanging from the pipet tip followed by transfer to the heated inlet tube (Scheme 1.II.A). Data acquisition of the software was initiated before surface extraction, therefore the total ion chronogram (TIC) reflects the entire duration of sample analysis from exposure of solvent to surface to the ionization in inlet, which was only about 25 seconds as shown in Fig. 1A. The mass spectrum having good ion abundances is dominated by phosphatidylcholines along with protonated clozapine and alkali-adducted cholesterol (Fig. 1B). The lipid peaks were assigned according to previously published data49 and no phosphocholine head group (m/z 184) was observed, unlike MALDI.50 Tandem MS (CID) was performed on the most abundant lipid peak at m/z 798. MS2 on the parent ion produced mainly a loss of 59, and MS3 on the major fragment ion at m/z 739 generated a fragment with a loss of 183 (Figure S1). The loss of trimethylamine (Δm/z=59) and phosphocholine head group (Δm/z=183) are characteristic for sodiated phosphatidylcholines. 51 The inset spectrum shows clozapine with its characteristic isotopic distribution. Brain tissue section from a drug-treated mouse, which was from the same batch but had been stored frozen for months at −80 °C, was analyzed in the same manner. The protonated clozapine ions were observed at lower ion abundance, likely because the drug has degraded over time (Figure S2). One of the major clozapine metabolites, clozapine N-oxide,52 was also observed having the proper chlorine isotopic distribution. Sodiated and potassiated cholesterol were assigned similar to an ambient infrared -MALDI surface study.53 The material was sampled directly from the tissue surface at ambient conditions, and the mass analysis was obtained without the requirement of any voltage or extra connections between surface sampling and sample introduction. The analysis is soft enough to maintain the intact analyte structures with less chemical background. Neither cholesterol fragment with the loss of water nor water clusters was detected as observed with ionization methods employing matrix and/or a laser.53 This method is discontinuous as solvent/lipid droplets are analyzed individually, yet it is a very simple sampling and ionization approach.
Figure 1.
Fast surface assessment using a SAII method employing surface extraction by 1 μL of MeOH in discontinuous mode as shown in Scheme 1. II.A. (A) TIC of the entire duration of sample analysis including exposure of solvent to surface to ionization in inlet. (B) Mass spectrum extracted from the TIC with the inset showing the isotopic distribution of protonated clozapine ions. The blue number on the top right corner denotes ion abundance.
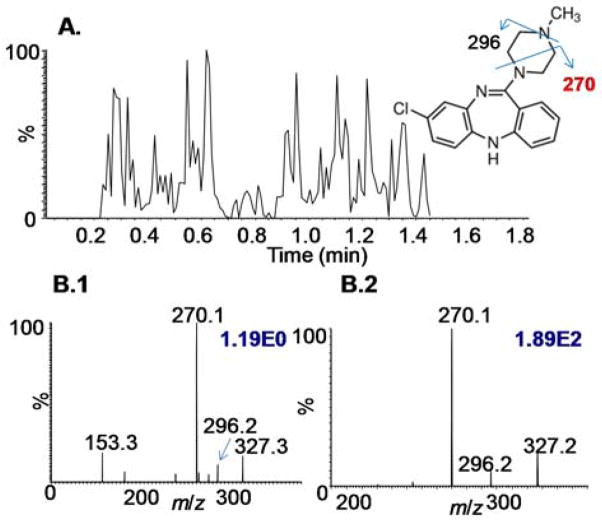
A continuous surface SAII sampling method was achieved by the configuration shown in Scheme 1. II.B. A liquid junction is formed at the mouse brain tissue surface by interfacing two pieces of fused silica tubing. Here, the glass plate containing the mouse brain tissue section was hand held and manually moved over the surface to analyze different areas. The TIC in Figure 2A shows the constant ion production for about 1 min acquisition time. The mass spectrum from time point 0.37–0.86 min was extracted from the TIC (Figure S3) showing similar ions from lipids and clozapine as discussed above, but at lower ion abundance. This may be due to the shorter time the liquid remains on the surface, so that less material is extracted. Structural characterization of clozapine present in the drug-treated mouse brain tissue was confirmed by fragmenting the peak at m/z 327 (Figure 2B.1) using CID. The fragment ions produced at m/z 270 and 296 are identical to those of a purchased standard (Figure 2B.2).27
Figure 2.
Fast surface assessment using the SAII method employing surface extraction by 1 μL of MeOH in continuous mode as shown in Scheme 1. II.B. (A) TIC of the whole analysis for ~1.4 min. (B) SAII-CID-MS of the protonated clozapine ions (1) directly extracted from tissue surface and (2) from synthesized clozapine chemical solution. The blue numbers on the top right corner denote ion abundances.
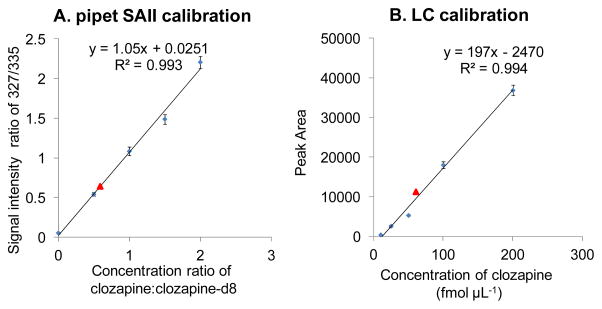
The method development using direct pipetting SAII for quantification of drugs was first established using standard clozapine:clozapine-d8 solutions from vials. The solution of 0.5 μL clozapine and clozapine-d8 mixture at a certain concentration ratio was directly introduced into the inlet of the mass spectrometer. As shown in Figure S4, at a concentration ratio of 0.5:1, the protonated peak height of clozapine (m/z 327) versus clozapine-d8 (m/z 335) is approximately 0.54 (Figure S4A), while a 1:1 concentration ratio results in the ion intensity ratio of approximately 1.08 (Figure S4B). The average of the signal intensity ratio from 8 repetitive measurements of each standard was plotted against the concentration ratio of clozapine:clozapine-d8 in Figure 3A. The good regression coefficient (R2=0.9929) and small error bars demonstrate the reproducibility of the SAII method for quantification. Using this calibration curve, an unknown sample from a tissue section of a drug-treated mouse was analyzed. One μL supernatant from half of the tissue section scraped off the glass slide was mixed with 1 μL of 4 pmol μL−1 clozapine-d8 solution producing a mixture containing 2 pmol μL−1 clozapine-d8. This solution was injected into the heated inlet. A signal intensity ratio of 0.694:1 at m/z 327:335 was obtained, reflecting the concentration of clozapine in the 1 μL extraction solution to be 1.27 pmol μL−1. In comparison, another 1 μL of the same supernatant was further diluted by 20-fold and quantified by LC-MS/MS (Figure 3B). The concentration of the supernatant was determined to be 1.33 pmol μL−1. The total analysis time spent on the SAII approach was only about 1 min for 5 replicates where the LC-MS/MS method took more than 30 min for triplicate analyses.
Figure 3.
Calibration curves of clozapine (A) using SAII by pipetting standard clozapine:clozapine-d8 solutions at different concentration ratio with clozapine-d8 at 2 pmol μL−1, signal intensity ratio is plotted against concentration ratio; and (B) using LC-ESI-MS/MS with standard clozapine solutions at different concentration, peak area of the fragment ion at m/z 270 is plotted against concentration.
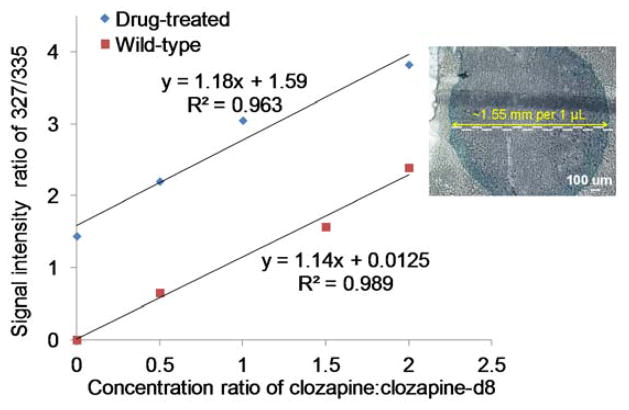
The other half of the 20 μm-thick tissue section was analyzed by surface analysis methods. The same series of standard solution of clozapine:clozapine-d8 was used to extract material from the surface instead of pure MeOH solvent. As a control experiment, the control tissue, for which the mouse was not treated with clozapine before sacrificing, was analyzed first. When the solution of 1 μL clozapin:clozapine-d8 mixture at the concentration ratio of 0.5:1 was used to extract material by contacting the surface for ~ 3 s and then transferred to the mass spectrometer inlet, the signal intensity ratio at m/z 327:335 obtained was 0.52:1 (Figure S5A), indicating no external clozapine was detected after extraction. When the tissue section from drug-treated mouse was extracted by the same standard clozapine:clozapine-d8 mixture, the signal intensity ratio increased to 2.20:1 (Figure S5B). The concentration ratio (X) was plotted against the ion intensity ratio (Y) (Figure 4) with control tissue (red square) and drug-treated tissue (blue triangle). The curve from drug-treated tissue has a significant increase, indicating clozapine was extracted from the surface by the standard solution. Although only one measurement was taken from each standard solution, the linearity (R2=0.9374) was confirmed by the high reducibility of this method (Figure 3A). The amount of clozapine extracted by 1 μL solution was calculated by extending the calibration curve to the x-axis. The intersection shows 2.68 pmol of clozapine was extracted from the surface area of about 1.5 mm in diameter (Figure 4 inset) as determined using optical microscopy. For a comparison with the LC-MS/MS method, one μL pure MeOH was used to extract clozapine from the surface and analyzed by LC-MS/MS after a 147-fold dilution. The amount of clozapine extracted by the 1 μL MeOH was calculated as 2.58 pmol from the calibration curve.
Figure 4.
The right half of a 20 μm brain tissue section from drug-treated mouse was quantified by SAII method in discontinuous mode as shown in Scheme 1. II.A. Solution of 1 μL of each of the four standard clozapine:clozapine-d8 mixtures at different concentration ratios was used for surface extraction and then pipette into the heated inlet of the mass spectrometer. Calibration curves were obtained by plotting the signal intensity ratio against the concentration ratio. A brain tissue section from a normal mouse was used as control. The inset shows an optical microscopy image to illustrate the extracted area. For enhanced image, 1 μL MeOH was doped with Luxol fast blue and the droplet was not removed from surface.
The amount of clozapine quantified from surface extraction of the right half of the tissue section is similar between SAII-MS and LC-MS/MS methods (2.68 pmol using SAII vs. 2.58 pmol using LC-MS/MS from surface extraction), indicating the reliability of the SAII method but at much faster analysis speed. However, the amount from 1 μL solvent extraction on the right half is not reflecting the results obtained from the 1 μL supernatant using traditional sample work-up and LC-MS/MS of the left half of the section (2.68 pmol using SAII from surface extraction vs. 1.33 pmol using LC-MS/MS from supernatant). We hypothesize that only the clozapine on the surface of the tissue section was extracted by the surface extraction method. In contrast, when tissue section was scraped off and vortexed and centrifuged, the extracted clozapine is not limited to the surface. To test our hypothesis, another set of tissue sections that were 10 μm-thick from a drug-treated mouse was analyzed in the same manner. Table 1 shows the comparison of 10 μm and 20 μm-thick tissue sections, using both the typical sample work-up and the novel surface SAII method. Thicker tissue results in more clozapine extracted by vortex and centrifugation. The amount obtained from the 20 μm-thick tissue is approximately twice that of the 10 μm tissue as determined by LC-MS/MS using the traditional tissue work-up. In contrast, the amount of clozapine extracted from the surface is not much different (2.84 pmol for 10 μm and 2.68 pmol for 20 μm). This result indicates that the amount of clozapine determined by surface SAII is the amount per unit area that was extracted, and is not limited by tissue thickness, at least for sections of 10 μm or greater.
Table 1.
Amounts of clozapine quantified by typical LC-ESI-MS/MS (Scheme 1. II.C) and surface SAII in discontinuous mode (Scheme 1. II.A). 10 μm and 20 μm tissue sections were analyzed. For LC-ESI-MS/MS, the left half of the tissue section was scraped off, dissolved in 50 μL MeOH, vortexed and centrifuged, results showed the amount in pmol per μL supernatant. For surface SAII, results showed the amount in pmol per μL solution used for surface extraction.
| Thickness | LC-ESI-MS/MS from scraped tissue Amount of clozapine in 1 μL supernatant |
Surface SAII Amount of clozapine extracted by 1 μL standard solution |
|---|---|---|
| 10 μm | 0.725 pmol | 2.84 pmol |
| 20 μm | 1.33 pmol | 2.68 pmol |
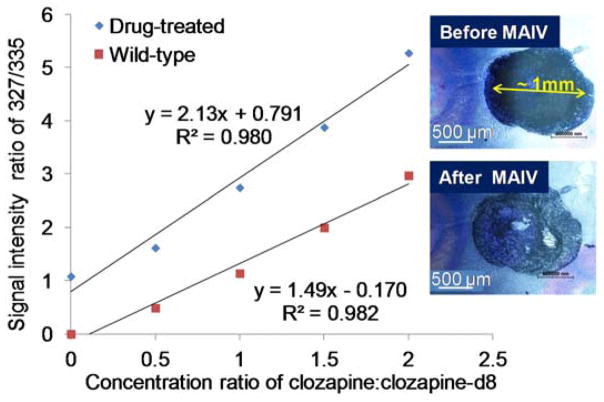
SAII used in surface analysis and quantification is a simple and fast assessment but limited to mass spectrometers equipped with a heated inlet tube. On instruments without a commercially available heated inlet, MAIV has been demonstrated to produce ESI-like ions directly from surfaces, including mouse brain tissue sections.40,45 The quantification of clozapine using MAIV was first achieved on the intermediate pressure vacuum MALDI source of a SYNAPT G2 instrument. The mixture of individual standard clozapine:clozapine-d8 solutions mixed with 3-NBN matrix solution was spotted on the control and drug-treated tissue sections and loaded into the vacuum using a MALDI plate loader but without use of the laser. From each single matrix/clozapine:clozapine-d8 spot, the mass spectrum was extracted over the sublimation period of time (ca. 2 min). An area of about 1 mm2 covered by 3-NBN matrix was analyzed: matrix uncoated parts of the tissue do not produce ions. The signal intensity ratio at m/z 327:355 was plotted against the concentration ratio of clozapine:clozapine-d8 from the standard solution (Figure 5). The amount of clozapine from each spotted area was determined as 1.48 pmol from the plots. Miniaturization can be employed to improve the spatial resolution of this analysis.40
Figure 5.
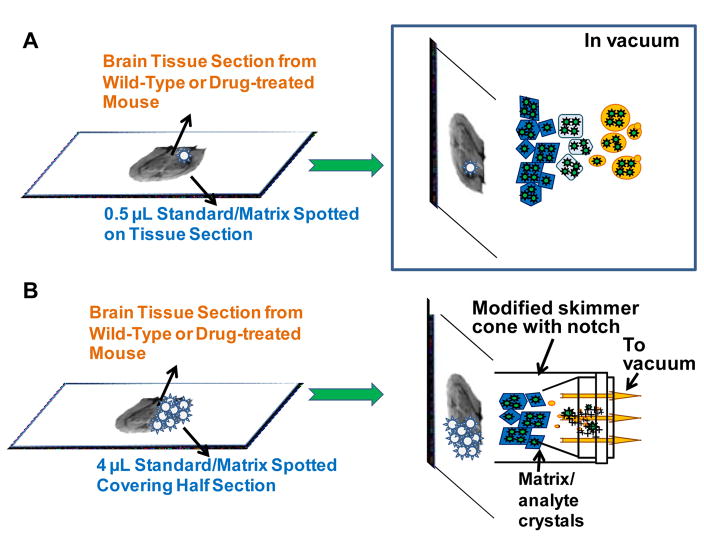
20 μm brain tissue sections from drug-treated and control mice were analyzed by MAIV operating at intermediate pressure. Solution of 0.5 μL 3-NBN/clozapine:clozapine-d8 mixture was spotted on the tissue section and the sample was loaded into the commercially available vacuum chamber (Scheme 2.A). The matrix sublimed in about 2 min. The ion intensities of clozapine and clozapine-d8 were averaged over the 2 min acquisition, and the intensity ratio was plotted against concentration ratio. Insets show the microscopy images of the matrix/clozapine:clozapine-d8 spotted on tissue section before and after MAIV analysis.
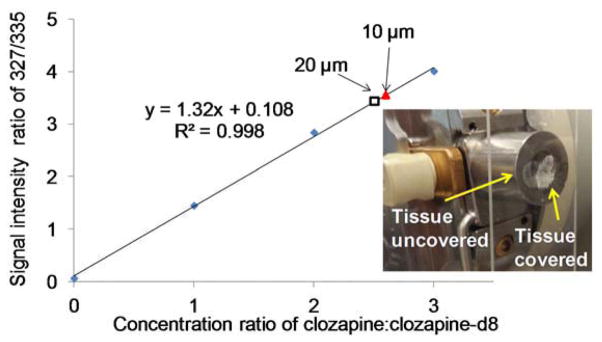
MAIV on the vacuum source produced better linearity (R2=0.9797) than SAII, because the average ion intensity summarized over a longer period of time provides better reproducibility. However, the operation of MAIV on the commercial vacuum MALDI source is time consuming and a significant amount of analyte is potentially wasted in the 2 min loading time.40 Only one matrix/clozapine:clozapine-d8 mixture can be spotted for each loading, otherwise all the spots would sublime simultaneously. To achieve the goal of simpler assessment from the surface, the ESI source was overridden and employed for MAIV operating from atmospheric pressure as described previously.54 The source temperature was held at 80 °C, and a sealed vacuum outer skimmer cone with a notch47 to allow air flow was used for operation. Four 1 μL clozapine:clozapine-d8 solutions mixed with 3-NBN was spotted on a tissue section (conrol and drug-treated, respectively) and covered half of the tissue section completely. The glass slide tissue holder was sealed to the notched cone by the vacuum for a 10 min analysis. The total analysis results of the 10 μm-thick brain tissue from drug-treated mouse are shown in Figure S6 as an example. The matrix sublimed over this 10 min period of time as shown in the TIC (Figure S6.I). Extracted clozapine, the standard clozapine-d8, cholesterol, and lipids were observed from the total mass spectrum and the two-dimensional plot of drift time vs. m/z (Figure S6.II). Particularly, lipids were not directly observed from mouse brain tissue sections in positive mode and the same heat-limited mass spectrometer.32 The nested dataset55 extracted from the two-dimensional plot (Figure S6.II.B insets) allows the identification of clozapine and clozapin-d8 without additional time requirement. The calibration curve was obtained using four standard clozapine:clozapine-d8 mixtures of different concentration ratios on control tissue sections (Figure 6). The amount of clozapine was determined by the standard addition method by spotting four 1 μL 3-NBN/clozapine-d8 mixture on half of the tissue section. The quantification of this method from 10 μm- and 20 μm-thick tissue sections did not show much difference (20.0 pmol for 10 μm and 19.4 pmol for 20 μm), indicating that the same amount of matrix also extracts similar amount of clozapine only from the surface, regardless of the tissue thickness. In comparison to SAII using liquid extraction, the amount of clozapine extracted by MAIV is much higher. This is not only due to the fact that larger area was covered by matrix, but also that more material was extracted for the same unit area when matrix was employed. To further confirm our observation, the tissue after surface extraction by SAII and MAIV was cut through the center breaking the glass slide, and the cross section was examined under the microscope to determine the depth of droplet and matrix penetration (Figure S7). SAII on the 20 μm-thick tissue section, only ~3 μm has the color from the doped Luxol fast blue dye indicating the wet area indicating the surface extracted area in SAII (Figure S7.A). MAIV provides a result with larger amount of clozapine than SAII, indicating that the matrix/clozapine:clozapine-d8 mixture went deeper into the tissue than solvent-extraction. Previous studies have shown that 3-NBN can be destructive to tissue sections,44 and blue color in the microscopy image shows a deeper extraction for about 7 μm (Figure S7.B), more than twice as deep compared to SAII liquid extraction.
Figure 6.
Calibration curve obtained by spotting 4 μL 3-NBN/clozapine:clozapine-d8 mixture on control mouse brain tissue sections. The glass slide holding the half-covered tissue was then sealed to the vacuum on a modified skimmer cone and let sublime for 10 min (Scheme 2.B). Ion intensity ratio was plotted against concentration ratio. The red triangle and hollow square show the results obtained from 10 μm and 20 μm tissue sections, respectively, from the drug-treated mouse using standard addition method. The inset shows a picture of the modified skimmer cone and a half-covered tissue section.
Conclusion
Rapid and efficient surface assessment is achieved by surface SAII and MAIV ionization methods. The surface quantification methods demonstrated in this work are potentially useful where fast analysis is valued, e.g. disease diagnosis or drug screening. One just needs to have the criterion of amounts of analyte per unit area of the surface (instead of per unit weight tissue, or volume) from healthy and diseased/treated tissue. In this case the thickness of the sample (>10 μm) has little impact on the analysis. With this approach, the tissue need not be sectioned to a certain thickness for quantification.
Supplementary Material
Scheme 2.
Schematic representation of workflow of MAIV methods. (A) The solution of 0.5 μL 3-NBN/clozapine:clozapine-d8 mixture was spotted on tissue surface and loaded into the vacuum of an intermediate pressure MALDI source. (B) Four 1 μL 3-NBN/clozapine:clozapine-d8 solution spotted on the tissue surface covering half of the tissue section, and exposed to vacuum of a modified skimmer cone of the overridden ESI source.
Acknowledgments
The authors are grateful for funding from NSF CHE-1411376, ASMS Research Award, DuPont Young Professor Award, Waters Center of Innovation Award, Eli Lilly Young Investigator Award in Analytical Chemistry (to ST), WSU Awards (Rumble and Schaap Fellowship to BW and Faculty Scholar to ST), Undergraduate Summer Stipend Award Michigan Louis Stokes Alliance Minority Participation Program (to CLD), and NIH DA011322 and DA021696 to KM are also acknowledged.
References
- 1.Lee MS, Kerns EH. Mass Spectrom Rev. 1999;18:187–279. doi: 10.1002/(SICI)1098-2787(1999)18:3/4<187::AID-MAS2>3.0.CO;2-K. [DOI] [PubMed] [Google Scholar]
- 2.Fenselau C, Demirev PA. Mass Spectrom Rev. 2001;20:157–171. doi: 10.1002/mas.10004. [DOI] [PubMed] [Google Scholar]
- 3.Vismeh R, Waldon DJ, Teffera Y, Zhao ZY. Anal Chem. 2012;84:5439–5445. doi: 10.1021/ac3011654. [DOI] [PubMed] [Google Scholar]
- 4.Gygi SP, Rist B, Gerber SA, Turecek F, Gelb MH, Aebersold R. Nat Biotech. 1999;17:994–999. doi: 10.1038/13690. [DOI] [PubMed] [Google Scholar]
- 5.Li X, Fang X, Yu Z, Sheng G, Wu M, Fu J, Chen H. Anal Chim Acta. 2012;748:53–57. doi: 10.1016/j.aca.2012.08.040. [DOI] [PubMed] [Google Scholar]
- 6.Keshishian H, Addona T, Burgess M, Kuhn E, Carr SA. Mol Cell Proteomics. 2007;6:2212–2229. doi: 10.1074/mcp.M700354-MCP200. [DOI] [PMC free article] [PubMed] [Google Scholar]
- 7.Vanderford BJ, Snyder SA. Sci Technol. 2006;40:7312–7320. doi: 10.1021/es0613198. [DOI] [PubMed] [Google Scholar]
- 8.Dams R, Huestis MA, Lambert WE, Murphy CM. J Am Soc Mass Spectrom. 2003;14:1290–1294. doi: 10.1016/S1044-0305(03)00574-9. [DOI] [PubMed] [Google Scholar]
- 9.Benijts T, Dams R, Lambert W, De Leenheer A. J Chromatogr A. 2004;1029:153–159. doi: 10.1016/j.chroma.2003.12.022. [DOI] [PubMed] [Google Scholar]
- 10.Jackson SN, Wang HYJ, Woods AS. Anal Chem. 2005;77:4523–4527. doi: 10.1021/ac050276v. [DOI] [PubMed] [Google Scholar]
- 11.McDonnell LA, Heeren RMA. Mass Spectrom Rev. 2007;26:606–643. doi: 10.1002/mas.20124. [DOI] [PubMed] [Google Scholar]
- 12.Stoeckli M, Staab D, Schweitzer A. Int J Mass Spectrom. 2007;260:195–202. [Google Scholar]
- 13.Cornett DS, Reyzer ML, Chaurand P, Caprioli RM. Nat Method. 2007;4:828–833. doi: 10.1038/nmeth1094. [DOI] [PubMed] [Google Scholar]
- 14.Pirman DA, Reich RF, Kiss A, Heeren RMA, Yost RA. Anal Chem. 2013;85:1081–1089. doi: 10.1021/ac302960j. [DOI] [PubMed] [Google Scholar]
- 15.Pirman DA, Kiss A, Heeren RMA, Yost RA. Anal Chem. 2013;85:1090–1096. doi: 10.1021/ac3029618. [DOI] [PubMed] [Google Scholar]
- 16.Caprioli RM, Farmer TB, Gile J. Anal Chem. 1997;69:4751–4760. doi: 10.1021/ac970888i. [DOI] [PubMed] [Google Scholar]
- 17.Stoeckli M, Chaurand P, Hallahan DE, Caprioli RM. Nat Med. 2001;7:493–496. doi: 10.1038/86573. [DOI] [PubMed] [Google Scholar]
- 18.Hankin JA, Barkley RM, Murphy RC. J Am Soc Mass Spectrom. 2007;18:1646–1652. doi: 10.1016/j.jasms.2007.06.010. [DOI] [PMC free article] [PubMed] [Google Scholar]
- 19.Reyzer ML, Hsieh YS, Ng K, Korfmacher WA, Caprioli RM. J Mass Spectrom. 2003;38:1081–1092. doi: 10.1002/jms.525. [DOI] [PubMed] [Google Scholar]
- 20.Krutchinsky AN, Chait BT. J Am Soc Mass Spectrom. 2002;13:129–134. doi: 10.1016/s1044-0305(01)00336-1. [DOI] [PubMed] [Google Scholar]
- 21.Puolitaival SM, Burnum KE, Cornett DS, Caprioli RM. J Am Soc Mass Spectrom. 2008;19:882–886. doi: 10.1016/j.jasms.2008.02.013. [DOI] [PMC free article] [PubMed] [Google Scholar]
- 22.Takats Z, Wiseman JM, Gologan B, Cooks RG. Science. 2004;306:471–473. doi: 10.1126/science.1104404. [DOI] [PubMed] [Google Scholar]
- 23.Roach PJ, Laskin J, Laskin A. Analyst. 2010;135:2233–2236. doi: 10.1039/c0an00312c. [DOI] [PubMed] [Google Scholar]
- 24.Eberlin LS, Ferreira CR, Dill AL, Ifa DR, Cooks RG. BBA-Mol Cell Biol Lipids. 2011;1811:946–960. doi: 10.1016/j.bbalip.2011.05.006. [DOI] [PMC free article] [PubMed] [Google Scholar]
- 25.Wiseman JM, Evans CA, Bowen CL, Kennedy JH. Analyst. 2010;135:720–725. doi: 10.1039/b922329k. [DOI] [PubMed] [Google Scholar]
- 26.Cooks RG, Manicke NE, Dill AL, Ifa DR, Eberlin LS, Costa AB, Wang H, Huang GM, Ouyang Z. Faraday Discuss. 2011;149:247–267. doi: 10.1039/c005327a. [DOI] [PMC free article] [PubMed] [Google Scholar]
- 27.Wiseman JM, Ifa DR, Zhu Y, Kissinger CB, Manicke NE, Kissinger PT, Cooks RG. Proc Nat Acad Sci USA. 2008;105:18120–18125. doi: 10.1073/pnas.0801066105. [DOI] [PMC free article] [PubMed] [Google Scholar]
- 28.Ifa DR, Wu CP, Ouyang Z, Cooks RG. Analyst. 2010;135:669–681. doi: 10.1039/b925257f. [DOI] [PubMed] [Google Scholar]
- 29.Schober Y, Guenther S, Spengler B, Rompp A. Anal Chem. 2012;84:6293–6297. doi: 10.1021/ac301337h. [DOI] [PubMed] [Google Scholar]
- 30.Norris JL, Caprioli RM. Chem Rev. 2013;113:2309–2342. doi: 10.1021/cr3004295. [DOI] [PMC free article] [PubMed] [Google Scholar]
- 31.Richards AL, Lietz CB, Wager-Miller J, Mackie K, Trimpin S. Rapid Commun Mass Spectrom. 2011;25:815–820. doi: 10.1002/rcm.4927. [DOI] [PMC free article] [PubMed] [Google Scholar]
- 32.Richards AL, Lietz CB, Wager-Miller J, Mackie K, Trimpin S. J Lipid Res. 2012;53:1390–1398. doi: 10.1194/jlr.D019711. [DOI] [PMC free article] [PubMed] [Google Scholar]
- 33.El-Baba TJ, Lutomski CA, Wang B, Inutan ED, Trimpin S. Anal Bioanal Chem. 2014;406:4053–4061. doi: 10.1007/s00216-014-7778-8. [DOI] [PubMed] [Google Scholar]
- 34.Chaurand P, Schriver KE, Caprioli RM. J Mass Spectrom. 2007;42:476–489. doi: 10.1002/jms.1180. [DOI] [PubMed] [Google Scholar]
- 35.Jun JH, Song Z, Liu Z, Nikolau BJ, Yeung ES, Lee YJ. Anal Chem. 2010;82:3255–3265. doi: 10.1021/ac902990p. [DOI] [PubMed] [Google Scholar]
- 36.Kertesz V, Van Berkel GJ. J Mass Spectrom. 2010;45:252–260. doi: 10.1002/jms.1709. [DOI] [PubMed] [Google Scholar]
- 37.Schafer KC, Denes J, Albrecht K, Saniszlo T, Balog J, Skoumal R, Katona M, Toth M, Balogh L, Takats Z. Angew Chem Int Ed. 2009;48:8240–8242. doi: 10.1002/anie.200902546. [DOI] [PubMed] [Google Scholar]
- 38.Engwegen JYN, Gast MCW, Schellens JHM, Beijnen JH. Trends Pharmacol Sci. 2006;27:251–259. doi: 10.1016/j.tips.2006.03.003. [DOI] [PubMed] [Google Scholar]
- 39.Pagnotti VS, Chubatyi ND, McEwen CN. Anal Chem. 2011;83:3981–3985. doi: 10.1021/ac200556z. [DOI] [PubMed] [Google Scholar]
- 40.Inutan ED, Trimpin S. Mol Cell Proteomics. 2013;12:792–796. doi: 10.1074/mcp.M112.023663. [DOI] [PMC free article] [PubMed] [Google Scholar]
- 41.Pagnotti VS, Inutan ED, Marshall DD, McEwen CN, Trimpin S. Anal Chem. 2011;83:7591–7594. doi: 10.1021/ac201982r. [DOI] [PubMed] [Google Scholar]
- 42.Pagnotti VS, Chakrabarty S, McEwen CN. J Am Soc Mass Spectrom. 2013;24:186–192. doi: 10.1007/s13361-012-0535-3. [DOI] [PubMed] [Google Scholar]
- 43.Wang B, Inutan ED, Trimpin S. J Am Soc Mass Spectrom. 2012;23:442–445. doi: 10.1007/s13361-011-0320-8. [DOI] [PubMed] [Google Scholar]
- 44.Wang B, Trimpin S. Anal Chem. 2014;86:1000–1006. doi: 10.1021/ac400867b. [DOI] [PubMed] [Google Scholar]
- 45.Inutan ED, Wager-Miller J, Narayan SB, Mackie K, Trimpin S. Int J Ion Mobil Spectrom. 2013;16:145–159. [Google Scholar]
- 46.Webb KJ, Xu T, Park SK, Yates JR., III J Proteome Res. 2013;12:2177–2184. doi: 10.1021/pr400027m. [DOI] [PMC free article] [PubMed] [Google Scholar]
- 47.Inutan ED, Wang B, Trimpin S. Anal Chem. 2010;83:678–684. doi: 10.1021/ac102779e. [DOI] [PubMed] [Google Scholar]
- 48.Lutomski CA, El-Baba TJ, Inutan ED, Manly CD, Wager-Miller J, Mackie K, Trimpin S. Anal Chem. 2014;86:6208–6213. doi: 10.1021/ac501788p. [DOI] [PMC free article] [PubMed] [Google Scholar]
- 49.Laskin J, Heath BS, Roach PJ, Cazares L, Semmes OJ. Anal Chem. 2012;84:141–148. doi: 10.1021/ac2021322. [DOI] [PMC free article] [PubMed] [Google Scholar]
- 50.Harvey DJ. J Mass Spectrom. 1995;30:1333–1346. [Google Scholar]
- 51.Jackson SN, Wang HY, Wood AS. J Am Soc Mass Spectrom. 2005;16:2052–2056. doi: 10.1016/j.jasms.2005.08.014. [DOI] [PubMed] [Google Scholar]
- 52.Baldessarini RJ, Centorrino F, Flood JG, Volpicelli SA, Hustonlyons D, Cohen BM. Neuropsychopharmacology. 1993;9:117–124. doi: 10.1038/npp.1993.50. [DOI] [PubMed] [Google Scholar]
- 53.Shrestha B, Nemes P, Nazarian J, Hathout Y, Hoffman EP, Vertes A. Analyst. 2010;135:751–758. doi: 10.1039/b922854c. [DOI] [PubMed] [Google Scholar]
- 54.Trimpin S, Inutan ED. Anal Chem. 2013;85:2005–2009. doi: 10.1021/ac303717j. [DOI] [PubMed] [Google Scholar]
- 55.Trimpin S, Tan B, O’Dell DK, Bohrer BC, Merenbloom SI, Pazos MX, Clemmer DE, Walker JM. Int J Mass Spectrom. 2009;287:58–69. [Google Scholar]
Associated Data
This section collects any data citations, data availability statements, or supplementary materials included in this article.


