

Abstract
Based on the Huttenlocher lecture, this article describes the need for a more integrative scientific paradigm for addressing important questions raised by key observations made over 2 decades ago. Among these are the early descriptions by Huttenlocher of variability in synaptic density in cortex of postmortem brains of children of different ages and the almost simultaneous reports of cortical volume reductions on MR imaging in children and adolescents. In spite of much progress in developmental neurobiology, developmental cognitive neuroscience, and behavioral and imaging genetics, we still do not know how these early observations relate to each other. It is argued that large scale, collaborative research programs are needed to establish the associations between behavioral differences among children and imaging biomarkers, and to link the latter to cellular changes in the developing brain. Examples of progress and challenges remaining are illustrated with data from the Pediatric Imaging, Neurocognition, and Genetics Project (PING).
Keywords: Behavioral phenotype, Magnetic resonance imaging, Brain development, Cortical surface area, Cortical thickness, Synaptic pruning
1. Introduction
Without much risk of controversy, one can safely assume that we all want more people in our society to learn, develop expertise, and innovate; fewer people to fail to thrive or to become dependent on damaging substances or behaviors; and for more people to experience a greater sense of well being. But we would also agree that some people in our society learn more, create more, become more emotionally and physically resilient, and have more fun. The question is: Why? For answers to this question we can achieve very little consensus. Is it because people are constitutionally endowed with different personal assets – native intelligence, motivation, optimism, capacity for pleasure? Is it because of formative experiences that either enhance or diminish their lives? We can describe these differences among people as behavioral phenotypes. They can be skills (such as calculation or literacy), levels of expertise, knowledge, creativity, emotional or social biases, likes and dislikes; they are, in short, relatively persistent traits and habits – individuality, if you like. Questions about the origins of differences among people are of intrinsic interest to many, but from a biomedical perspective, the incentive to study them comes from the well-documented observation that many seriously adverse outcomes evolve disproportionately in the context of specific behavioral phenotypes. Functional “risk phenotypes” have been linked to many behavioral disorders, including substance use disorders (Volkow, 2005, Clark et al., 2013), affective disorders (Klein et al., 2011), psychosis (Brent et al., 2014), ADHD (Castellanos and Tannock, 2002), dyslexia (Peterson and Pennington, 2012), and dyscalculia (Butterworth et al., 2011). One could say that from conception to the onset of these disorders, evolving risk phenotypes are simply forms of individuality, but a deeper understanding of the divergence of high-risk from low-risk phenotypes eludes us. This article will describe some lines of evidence relevant to these issues, including work from behavioral genetics, neurogenetics, and cognitive neuroscience, and will pose important questions that we must answer in future research. Finally, impediments to progress in the field, and some recommendations for how to reduce them, are outlined.
What do we know about the origins of behavioral phenotypes? Studies of families and especially twin studies suggest that many are heritable. For example, scores from intelligence tests, performance on cognitive tasks, and self-report scales measuring personality have consistently exhibited moderate heritability in twin studies (Bartels et al., 2002, Rettew et al., 2006, Kremen et al., 2007), as have measures of academic skills such as reading and calculation (Luo et al., 2003). These observations highlight the influence of genetic factors on developing behaviors, but do not identify them. A few behavioral phenotypes have been examined in large, genome wide association studies (GWAS), and surprisingly, given reported high estimates of heritability, these studies initially revealed few replicable associations with specific genetic variants, and those variants identified accounted for only very small proportions of the phenotypic variability (Butcher et al., 2008, Calboli et al., 2010, Rietveld et al., 2013, Rietveld et al., 2014). However, more recent studies have applied novel methods that exploit GWAS results to estimate heritability attributable to common genetic variants in aggregate (so called “chip heritability”), and these suggest that substantial variability in behavioral phenotypes may indeed be explained by common variants, but the genetic architecture of these traits is likely to be highly polygenic, and extremely complex. So, in summary, genetic differences probably do play a large role in engendering behavioral individual differences, but it appears that thousands of variants may in some way influence these phenotypes, each with a very small additive effect (Purcell et al., 2009, Gibson, 2010, Davies et al., 2011). But how might such behavioral effects of genetic variation be mediated? One possibility might be via influences on the developing neural architecture.
A number of studies have examined the heritability of brain imaging phenotypes, again mostly using twin designs. Global measures, such as brain volume (Baaré et al., 2001), gray matter volume (Baaré et al., 2001), and both surface area and thickness of the cortex (Panizzon et al., 2009, Eyler et al., 2011) exhibit even higher levels of heritability, sometimes over .9, with heritability estimates of regional measures significant but more modest. Interestingly, cortical surface area and mean thickness of the cortex, both with estimated heritability in the .8–.9 range, nevertheless exhibited no evidence for genetic correlation in a study of middle-aged male twins (Panizzon et al., 2009), suggesting that the genetic factors influencing variability of these brain phenotypes are essentially nonoverlapping. A series of subsequent analyses of imaging data from this study examined more closely the genetic architecture of individual difference variability in cortical regionalization, that is, individual differences in the relative sizes of different cortical regions.
Work with rodent models has shown that arealization of the developing cortex is linked to gradients of secreted morphogens and expression of transcription factors in the neocortical proliferative zone during the embryonic period (Mallamaci and Stoykova, 2006, O’Leary et al., 2007). Transgenic models have shown that alterations of these gradients are associated with different relative sizes of sensorimotor regions in the later developing cortex. Now that surface-based methods are available for examining the relative sizes of human cortical regions more precisely, one might ask whether genetic variation gives rise to individual differences in human cortical regionalization. Using data from 400 middle-aged male veterans from the Vietnam Era Twin Study cohort, Chen et al. (2012) applied conventional twin methodology to compute the vertex-to-vertex genetic correlations among measures of cortical surface expansion at 2500 vertices (after smoothing). This large matrix of genetic correlations was then further analyzed using a data-driven, fuzzy clustering method to identify 12 sets (or clusters) of vertices with relatively higher genetic inter-correlations and relatively lower genetic correlations with other sets (or clusters). These clusters are color-coded in Fig. 1 – and they represent regions of the cortex where the twin data suggest that individual differences in relative surface area expansion are related to distinct sets of underlying genetic factors. Interestingly, this analysis yields a novel method for defining cortical parcels, one that is driven by analysis and simplification of the genetic architecture. After this analysis of cortical surface area variability was published, a similar analysis of genetic correlations for vertex-wise measures of cortical thickness was performed. The results of this analysis (Chen et al., 2013) also revealed regional clustering of genetic inter-correlations, and the 12-cluster solution resembled the regional pattern for surface area expansion. However, the dominant patterns of genetic inter-correlation for thickness measures (as expressed in the 2–4 cluster solutions) differed substantially from those for surface area, and as previously reported for total surface area and mean cortical thickness (Panizzon et al., 2009), the genetic correlations between areal expansion and thickness within comparable genetic “clusters” were also very low. These results suggest that genetic factors strongly influence both global area and thickness of the cortex as well as regional differences in these biomarkers; however, the overlap in genetic factors contributing to the high heritability of area and thickness of the cortex is negligible.
Fig. 1.
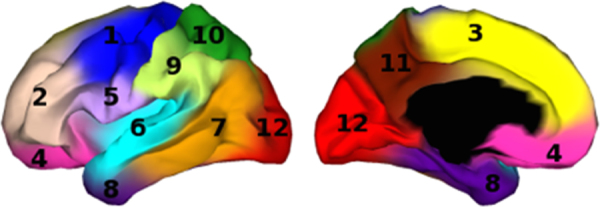
Adapted from Chen et al. (2012), showing the result of the 12-cluster solution for a clustering algorithm performed on the matrix of vertex-wise genetic correlations computed for cortical surface area expansion in a large sample of middle-aged male twin pairs.
Attempts to identify specific genetic variants that may contribute to the heritability of imaging phenotypes have been slow to appear because of the paucity of large studies with comparable brain imaging data. In recent years, however, larger studies with imaging and genotyping have been conducted. Early attempts to identify variants with effects strong enough to survive GWAS significance criteria either failed or led to associations with low replicability, however a few studies have now reported findings in discovery and replication samples. Bakken et al. (2012) performed GWAS to identify specific variants associated with the proportional surface area of the visual cortex. One variant survived GWAS criteria and replicated in two independent samples. This variant was in a regulatory region of a gene that is highly expressed in the occipital cortex (GPCPD1). Hibar et al. (2013) identified a variant related to lenticular nucleus size that was also replicated in an independent sample. Even these important GWAS studies, however, examined fewer individuals than have been studied in most successful GWAS studies of other complex human phenotypes, including several behavioral phenotypes. Recently, the important Enhancing Neuro Imaging Genetics through Meta-Analysis (ENIGMA) project has begun to aggregate imaging genomics data across many studies worldwide to facilitate the search for specific variants related to imaging phenotypes. In an early ENIGMA report on GWAS of volumes of subcortical structures in over 30 thousand individuals, Hibar et al. (2015) report that several variants contributing to these volumes survived stringent GWAS criteria and replicated across samples. So far, however, these early reports suggest that, like heritable behavioral phenotypes, neuroimaging phenotypes may have highly complex genetic architecture, with few variants exerting large effects on the phenotypes, but perhaps many variants contributing strongly in aggregate.
Together these results suggest that substantial individual differences in the relative sizes of and average thickness in different functional regions of the cortex are genetically mediated to a significant degree, that across regions they are influenced by different sets of genetic factors, and that genetic factors influencing cortical regionalization show little overlap with those influencing thickness variability across the cortex. In other words, the patterns suggest that the genetic architecture of the cortex is exceedingly complex, and each phenotype is likely to be mediated by a different large set of (probably small additive) genetic effects. An important question, of course, is whether these differences are associated with individual differences in behavioral phenotypes.
2. Knowing things and becoming an individual take time: the time scale of the research matters
Whatever the factors that give rise to them, genetic or otherwise, of one thing we can be certain: most behavioral phenotypes do not emerge at a particular point in time, but gradually, through the cumulative effects of factors influencing them over the life of the individual.
As an example, the left-hand graph in Fig. 2 shows the long time course of developing calculation skills in children between ages 5 and 16. Such a protracted increase in calculation skills is consistent with the expected influence of instruction and practice in formal and informal learning environments. Perhaps more surprising is that even the basic capacity to inhibit a primed motor response (shown in the figure's right panel) exhibits a similarly protracted course of development. But why do behavioral phenotypes diverge during development? Why, for example, do some children from this study at age 14 exhibit calculation skills more typical of the average 9 year old, and some children at 9 exhibit motor inhibitory functions more typical of 15 year olds? Again, there is evidence for some degree of genetic mediation of variability on both of these kinds of skills, but developing calculation skills are clearly modified by the instruction and learning experiences of children, and by other cultural factors, and even performance on a simple motor inhibitory task like this improves with practice.
Fig. 2.

Scatterplots showing the differences by age on the raw score of the Woodcock-Johnson Calculation scale (left) and on the stop-signal reaction time computed from the stop signal task (right). The data were acquired as site-specific “auxiliary” assessments in the UC San Diego PING cohort. Shown are smooth functions of age and highlighted are points for participants whose scores are atypical for their own age, and more similar to those of younger or older participants.
For simplicity's sake, we might begin with this basic conceptual model (Fig. 3) for an emerging behavioral phenotype in a developing child: that it represents some function of the effects exerted by (1) the hypothetical domain-relevant neural genotype; and sometimes by (2) environmental effects on the neural apparatus relevant to the skill or domain (e.g., in cases in which damage or toxic exposure to the brain occurs); but, more generally, also by (3) cumulative experiences throughout development encountering and manipulating material in the domain; and finally by (4) interactions between these factors. Much ongoing research in human developmental neuroscience is aimed at improving models like this one. However if we are ever to achieve our translational aims – that is, to prevent adverse outcomes and lift the trajectories of well-being in at-risk individuals in our society – then we must strive to answer some big questions that strike at the heart of the matter. We might ask: To what degree, and via which biological mechanisms, does common genetic variation constrain – or bias – functions of maturing circuits in the human brain? And to what degree, and under which circumstances, are there consequences (of these gene effects) for experience-dependent developmental processes, or for responses of the developing brain to neuroactive environmental factors (such as trauma, toxicity, drug exposure, etc.)?
Fig. 3.

Basic conceptual model of effects influencing an emerging behavioral phenotype cumulatively over time.
3. Can observing the biological development of the human brain help answer these questions?
Only 2 decades ago it seemed unlikely to many that more knowledge about the biological development of the brain across the postnatal period would provide further insight into the nature of individual differences – in part because the time course of the evolution of these complex behavioral phenotypes seemed much more protracted than what was thought of as a foreshortened period of the brain's biological development. It was assumed by many that although early events might fix the range of outcomes to some extent, everything changing in the school age years and beyond was necessarily due to learning in a biologically mature brain. This view began to change with the advent of noninvasive brain imaging.
On this occasion, when we honor Peter Huttenlocher, we revisit one of the first papers published in this area 23 years ago (Jernigan et al., 1991); not, certainly, because it is a particularly interesting paper by today's standards, on the contrary, it will serve to illustrate how far we have come in those 2 decades; but it is one of the earliest imaging papers to cite Peter Huttenlocher's remarkable observations. In those days, Jernigan was applying early “semi-automated” morphometry methods developed in her lab to analyze MR imaging data. The regions of interest (ROIs) for examining the cortex were essentially stereotactically-defined quadrants of the cerebrum, and are a long way back from the sophisticated surface-based methods we apply in our work today. By performing tissue segmentation based on dual echo MR images, Jernigan et al. measured cortical gray matter volumes in these large ROIs; and in a modest sample of 39 young people ranging in age from 7 to 35, observed highly significant, and linear, decreases in the cortical gray matter volumes (adjusted for volumes of the supratentorial cranial vault) in the two dorsal regions, with no real evidence of change in the ventral areas. Obviously, we know a lot more about the age functions and anatomical pattern of these apparent changes in gray matter volume now, but at the time they were quite surprising to many people; and the biological explanation for them was far from clear. Since the one largely postnatal phenomenon of which we were all aware was the protracted course of myelination and oligodendrocyte maturation (Yakovlev and Lecours, 1967), we, and others, speculated that signal changes associated with the newly generated myelin sheaths of axons coursing beneath the cortex, or even intracortically, might contribute to these apparent volume reductions in cortical gray. In other words, the apparent cortical gray matter reductions might represent the shifting signal characteristics of immature tissue comprised of more lightly myelinated axons (i.e., resembling gray matter) to the signal characteristics of tissue comprised of more fully myelinated axons. But we also had just become aware of Huttenlocher's observations suggesting synaptic pruning in what seemed to be an anatomically heterochronous pattern across the cortex (Huttenlocher and de Courten, 1987, Huttenlocher, 1990, Huttenlocher and Dabholkar, 1997). We therefore speculated that our observations and those reported by Huttenlocher might in both cases reflect some later process of maturation in the dorsal cortical regions during adolescence. Before we move into the modern era of neuroimaging, we would emphasize one other result from this early paper, rarely mentioned in the subsequent literature, that seemed to suggest that the mechanisms underlying these apparent cortical volume changes probably involved both loss of tissue volume as well as changing signal contrast on MRI. That was the observation that CSF volume increased in the adjacent subarachnoid space in a very similar anatomical pattern to the cortical volume reductions, as though nearby tissue loss resulted in expansion of this space, ex vacuo.
These early observations demonstrated that the neural architecture itself, like the behavioral phenotypes, continued to show dynamic age-related change over a similarly protracted period of development. Furthermore, imaging highlighted the considerable individual difference variability in brain morphology present across the entire age range, for example, the apparent differences in regionalization of the cortex, sometimes reflected in sulcal and gyral patterns, that were later the subject of the Bakken et al. and Chen et al. studies reviewed above. However, little was known about whether the differences in brain morphology might be mirrored in any way in the behavioral variability, particularly in typically developing children.
4. The Pediatric Imaging, Neurocognition, and Genetics (PING) Project
Since these early observations, much elegant imaging work has been done revealing robust indices of ongoing biological development of the brain that can be monitored noninvasively in children. Many of these neurodevelopmental biomarkers and functional imaging phenotypes show very protracted trajectories of change with age and exhibit regional variation. Though a number of studies have now examined age-effects on measures of cortical architecture during the postnatal years, and a few have included longitudinal data, details about the pattern of change have been inconsistent, probably in part because of modest sample sizes, different age-ranges examined, and variable imaging protocols and analysis methods. Recently, investigators throughout the country collaborated on the large, multisite Pediatric Imaging, Neurocognition, and Genetics (PING) project in which well over 1000 children were studied. This imaging genetics study of children between the ages of 3 and 20 enrolled participants at 10 sites throughout the US. The design was cross-sectional and involved only a limited number of developmental and cognitive phenotypes, but the dataset is now shared freely with the research community and has been accessed by people all around the world, through a web-based tool called the PING Portal (pingstudy.ucsd.edu). Users can apply for access by filing a data use request and a data use agreement on the Portal. Approved users can download the dataset for offline analysis and/or explore the data using advanced interactive statistical and visualization utilities in the Data Exploration Module (Brown et al., 2012, Bartsch et al., 2014, Jernigan et al., 2015).
This dataset provides several advantages for defining postnatal changes on imaging phenotypes, including: the large number of participants studied with harmonized and standardized methods; the wide age range of the participants (and therefore the long developmental trajectories that can be estimated); and the availability of genome-wide genotyping, which among other things made it possible to compute sensitive measures of genetic ancestry, in the form of 6 “genetic ancestry factors” (Alexander et al., 2009, Jernigan et al., 2015). Thus in this dataset it has been possible to estimate age-differences and extrapolated trajectories while holding constant the scanner used, socioeconomic status of the family, and genetic ancestry, variables that could otherwise introduce cohort effects in a cross-sectional study. Application of extended FreeSurfer methods for computational morphometry produced a set of cortical biomarkers that, for example, isolated variability in surface area from variability in apparent cortical thickness.
Fig. 4 shows plots produced with the Data Exploration Module of the PING Portal of age-differences (and smooth functions of age) for two global cortical phenotypes, total surface area and mean thickness (across the entire cortical surface). The effect of age on surface area is nonmonotonic; surface area expands during early childhood years, and expansion decelerates during middle childhood giving way to gradual contraction during adolescence and thereafter. In contrast, the apparent thickness of the cortex exhibits (mostly linear) monotonic decrease across the entire range, from 3 to 21 years.
Fig. 4.

Smooth functions of age and residualized data points from generalized additive models. Cortical surface area expands then contracts gradually (top), but apparent cortical thickness decreases continuously (bottom). Model covariates include: gender, scanner, socioeconomic status, and genetic ancestry.
With other features of the Portal one can estimate these effects at each vertex on the (tessellated) surface of the cortex, and create visualizations that code, for each vertex, an age-specific estimate of annualized rate of change. These estimates of rate of change were calculated from the PING data using a generalized additive model (GAM) implemented with the R-package “mgcv”. For each vertex a GAM estimated a smooth function of age (like the one shown above for total surface area), controlling for scanner, gender, SES (family income and highest parental education), and a set of six genetic ancestry factors. The predicted values obtained from the age model were sampled at regular intervals (100 equally spaced intervals across the age range). Instantaneous rates of change were calculated from the sampled values using the method of finite differences and normalized to produce estimates for annualized rates of change in surface area and thickness at each vertex.
Rate of change maps for surface area are shown in Fig. 5 and confirm that the global pattern is observed across the entire cortical surface, i.e., early expansion followed by contraction during adolescence. However, there is some evidence that different regions may exhibit different trajectories. Note that the maps of change at ages 4 and 6 are coded differently than those at ages 8 and above to better visualize regional variability in the generally higher rates of expansion at these earlier ages.
Fig. 5.

Vertex-wise maps of estimates of rate of change in cortical area calculated using a generalized additive model (GAM) implemented with the R-package “mgcv”. For each vertex a GAM estimated a smooth function of age, controlling for scanner, gender, SES, and genetic ancestry factors. Predicted values were sampled at 100 regular intervals across the age range, instantaneous rates of change were calculated using the method of finite differences, and values were normalized to produce estimates for annualized rates of change at each vertex.
To further highlight regional differences we computed the smooth age functions from the GAM models for 3 larger ROIs generated by the 12-cluster genetic parcellation of surface area (shown in Fig. 1 above adapted from Chen et al., 2012). Shown in Fig. 6 are the trajectories for (covariate-adjusted) mean expansion coefficients for parcels in the dorsolateral prefrontal cortex (blue), dorsomedial frontal cortex (red), and occipital cortex (green); labeled as parcels 2, 3, and 12, respectively. Comparing the models visually suggests that early to middle childhood expansion is more rapid in the dorsolateral prefrontal than in the occipital parcel.
Fig. 6.

Shown are the age trajectories of the (covariate-adjusted) mean areal expansion coefficients for genetic parcels in the dorsolateral prefrontal cortex (blue), dorsomedial frontal cortex (red), and occipital cortex (green); labeled as parcels 2, 3, and 12, respectively in Fig. 1. Early to middle childhood expansion appears to be more rapid in the dorsolateral prefrontal parcel than in the occipital parcel. (For interpretation of the references to color in figure legend, the reader is referred to the web version of the article.)
Rate of change maps for measures of apparent cortical thickness are shown in Fig. 7. Thinning of the cortex appears to be present across the entire cortex and across the entire age range from 3 to 21, contrasting with some previous reports of early childhood cortical thickening. If anything, thinning may be accelerated in the pre-adolescent children. Again, the maps suggest some degree of regional heterochronicity in apparent thinning of the cortex, as highlighted by comparing the smooth age functions from the GAMs for the genetically-derived parcels (note that mean thickness measures in ROIs derived from the surface area genetic parcels are used for consistency with Fig. 6). Shown in Fig. 8 are the trajectories for covariate-adjusted mean cortical thickness measures for the parcels in the dorsolateral prefrontal cortex (blue), dorsomedial frontal cortex (red), and occipital cortex (green); labeled as parcels 2, 3, and 12, respectively, in Fig. 1. The age functions vary slightly, suggesting that unlike in the frontal parcels, where the rate of thinning appears to be fairly constant, thinning may decelerate slightly after age 10 in the occipital parcel.
Fig. 7.

Vertex-wise maps of estimates of rate of change in cortical thickness calculated using a generalized additive model (GAM) implemented with the R-package “mgcv”. For each vertex a GAM estimated a smooth function of age, controlling for scanner, gender, SES, and genetic ancestry factors. Predicted values were sampled at 100 regular intervals across the age range, instantaneous rates of change were calculated using the method of finite differences, and values were normalized to produce estimates for annualized rates of change at each vertex.
Fig. 8.

Shown are the age trajectories of (covariate-adjusted) mean thickness within genetic parcels in the dorsolateral prefrontal cortex (blue), dorsomedial frontal cortex (red), and occipital cortex (green); labeled as parcels 2, 3, and 12, respectively in Fig. 1. While rate of thinning appears to be relatively constant across the age range in the frontal parcels, thinning appears to decelerate somewhat after age 10 in the occipital parcel. (For interpretation of the references to color in figure legend, the reader is referred to the web version of the article.)
In summary, these results from PING illustrate the advantages of a more integrative, data-sharing approach to research that, in this case, yields more definitive estimates of parameters that relate imaging biomarkers to brain development. They highlight the distinct trajectories that relate age to cortical surface area and apparent cortical thickness, and they suggest that both the nonmonotonic surface area function and the monotonic function for apparent thickness may exhibit some regional heterochronicity. However, while apparent differences among the regional trajectories are intriguing, the statistical reliability of these regional patterns is more difficult to assess and may require even larger samples, and certainly longitudinal data, for confirmation.
These models describe the modal developmental course of surface area expansion (and contraction) and of apparent cortical thinning, but one might ask: what do we know about individual differences in these processes of cortical development and how might they relate to behavioral differences? In recent years a number of observations in children have associated individual differences in the cortical architecture with individual differences in behavioral phenotypes, and a few suggest that trajectories of biological maturation in specific neural systems may themselves map onto emerging phenotypes. For example, beginning with Sowell et al. (2001) using early global regional measures, and more recently by investigators using surface-based methods (Tamnes et al., 2010, Porter et al., 2011, Squeglia et al., 2013), regressive changes (volume loss or thinning) of the cortex has been associated with better performance on memory, cognitive, and executive functions in developing children and adolescents. These results would seem to suggest that more mature cortical phenotypes are mirrored in more mature performance profiles during development, since thinner cortex is rarely associated with performance improvements in other contexts. In other words, they suggest that phase advance of apparent cortical thinning might be associated with precocious functional development.
Cortical surface area phenotypes have only rarely been correlated with behavioral measures in developing children, but in two reports from the PING study, such associations have been found. Fjell et al. (2012) observed, in the 5–12 year old children, an association between greater (relative) cortical expansion in the anterior cingulate region and better performance on a flanker task, the latter measured as reduced effects of incongruent cues on reaction time. This association was independent of age. Since this region continues to expand in surface area over the 5–12 year age range (Fig. 5, Fig. 6), one explanation is that earlier anterior cingulate surface area expansion is associated with greater functional maturity of circuitry involved in response conflict resolution on this task. An alternative explanation is that individuals with relatively larger anterior cingulate, e.g., through regionalization effects, regardless of their developmental status, are more adept at such tasks. That the associations seemed to be absent in older individuals in the study is more consistent with the former than the latter interpretation, but these null effects in older participants could also be due to differences in measurement sensitivity or other factors.
A second PING study (Newman et al., 2015) revealed a surface area phenotype related to high self-reported levels of generalized anxiety in 287 PING participants aged 7–20 years. Independent of age, gender, and genetic ancestry factors, anxiety was negatively associated with relative cortical surface area of the ventromedial prefrontal cortex, as well as with global cortical thickness, and these associations significantly diminished with age. The two cortical phenotypes contributed additively to the prediction of anxiety. These findings suggest that higher levels of anxiety, even in typically-developing children, may be characterized by both delayed expansion of the ventromedial prefrontal cortex and an altered trajectory of global cortical thinning.
5. Answering the big questions
Though these early clues about neural correlates of individual differences in children are intriguing, unfortunately, many important questions remain about what they mean and why they occur. For example, for most of the associations reported here there is no direct evidence for or against a role of genetic factors in mediating them, though such effects are plausible given the findings in twin studies. Even when genetic factors can be implicated, it is not clear whether this represents variable functional constraint within the circuitry of different individuals, or effects of functional “biases” rather than constraints per se. In either case, it is unclear when such constraining or biasing effects were exerted during the functional development of the relevant neural systems. Thus, we still have little understanding of the meaning of the associations, and therefore they provide little guidance toward promising routes for intervention.
An important question, with clear translational implications, is whether the associations are mediated to a greater degree by direct effects of genetic variation on developing neural systems, by direct effects of experience through neuroadaptive, or activity-dependent, processes, or by indirect effects of genetic factors, mediated by experience, through gene-experience correlations? Note that to the degree that the answer is the latter, even phenotypes with high heritability are likely to exhibit robust effects of intelligent behavioral (or other environmental) interventions. Information about possible gene-experience correlations is lacking, at least in part, because of the absence of large-scale, genetically-informed studies of behavioral phenotypes with sufficiently comprehensive assessments of putative experiential and environmental mediators. Almost certainly, the most definitive answers to these questions will require longitudinal observations.
To answer these and other questions will require more complete neurobiological descriptions of human brain development. A significant part of the problem stems from the fact that we do not yet know what the imaging biomarkers represent at a cellular level. Focusing on the “developmental” signals we can monitor in maturing human cortex, we could ask: What differences in the architecture of the cortex attend early cortical surface expansion and later contraction? Could these changes reflect widening or narrowing of cortical columns as might attend expanding and contracting dendritic mass? Although investigators have often hypothesized that synaptic pruning might be related to cortical thinning during development, recent studies of human postmortem material suggest a different pattern of nonmonotonic change in synaptic density and dendritic extent, i.e., protracted increases into childhood with more modest but similarly protracted decreases through adolescence and adulthood (Glantz et al., 2007, Petanjek et al., 2011, Webster et al., 2011). The time courses reported in these studies are more similar to the age differences in surface area than thickness. Other possible contributors to surface area are late maturation of neuronal or glial morphological phenotypes, or even ongoing proliferation and differentiation of glial or microglial populations. Similar questions remain about the biological alterations that we measure as apparent cortical thinning. Although a role for intracortical and subcortical myelination is often suggested, direct evidence is lacking. In summary, a critical priority for advancing human developmental science should be establishing which cellular changes in the neural architecture attend the changes in imaging biomarkers that allow us to monitor biological development of the brain noninvasively.
Equally important questions remain about the functional dynamics driving these changes. More information about changing levels and regional distribution of gene expression in the human brain across the developmental age range could provide important clues about the underlying biology. However, longitudinal studies that include careful assessment of plausible experiential moderators of neurodevelopmental processes, and, ideally, prospective behavioral intervention studies, are also needed to examine the role of activity-dependent processes. Further study is needed to determine which among the genetically mediated associations are due to effects of early patterning (e.g., that may be present throughout the lifespan), and which to genetic effects on the time course of brain development; and of the latter, which exert temporary effects on brain and behavioral development and which exert persisting effects. Among the demonstrated experiential effects (i.e., of practice, training, or emotion), it remains to determine how robust these effects are, how persistent they are, and which specific neural circuits they affect.
6. Fragmentation in the science of the developing mind and brain
We would argue that in order to answer these questions we need to take the research to a different level, and that a significant impediment to that aim is an unfortunate degree of fragmentation in developmental science generally, and in the science of the developing human mind and brain in particular. Human developmental neuroscience, developmental psychology, child psychiatry, pediatric neurology, education research, and other relevant branches of developmental science are siloed, with few unifying or integrative structures. Support for the research is provided through many small programs distributed across multiple institutes, agencies, and foundations. And unfortunately the behavioral disciplines are even further isolated from basic developmental neurobiology, in spite of the fact that both have much to gain from closer integration.
Above we posed the following as examples of big questions at the heart of our understanding of behavioral phenotypes: To what degree, and via which biological mechanisms, does common genetic variation constrain – or bias – functions of maturing circuits in the human brain? And to what degree, and under which circumstances, are there consequences (of these gene effects) for experience-dependent developmental processes, or for responses of the developing brain to neuroactive environmental factors (such as trauma, toxicity, drug exposure, etc.)? So how do we achieve the integration needed to answer big questions with this degree of complexity? First, by beginning to accumulate large, informative, high-dimensional datasets for sharing, populated with harmonized assessments of developing children obtained repeatedly over time as they mature. These studies must attempt to capture genetic and epigenetic variability, and include noninvasive imaging and other neurophysiological measures sensitive to differences in the neural architecture and to the status of the brain's biological development. They should also include measures of the activity within maturing neural systems as well as behavioral and experiential assessments. These assessments must go beyond conventional forms of formal testing, observation, and parent and self-report methods to include innovative methods for sampling behavior and the environment with mobile devices and “quantified life apps”. It cannot be emphasized enough that we must collect richer data detailing the behaviors and experiences of children, and the physical, social, and cultural contexts in which those experiences occur. Data repositories populated with observations like these would yield high scientific dividends for decades, as new methods and conceptual approaches were applied to them over time.
Whenever opportunities exist we should embed translational arms within these large-scale, longitudinal studies. Translation can mean implementation of models derived from observational (or theoretical) work in applications that would intervene in the observed process, as well as transfer from basic to clinical, or from clinical to basic, research; and for human developmental neuroscience all of these forms of translation are needed. First, we should consider implementing the prototyping, testing, and modification of novel interventions for mitigating risks in struggling or other high-risk groups, as well as interventions for enhancing learning and growth more generally, in “high-information” cohorts of longitudinal studies. Thus the additional behavioral, developmental, neurobiological, and genetic information already available for these participants could be leveraged in models of the effects of the interventions. The availability of elective interventions, delivered, for example, in after-school or summer programs held in the same venues as ongoing longitudinal studies, or via web-based interactive applications, could also help to consolidate longer-term relationships with families, and would serve as a catalyst for more interdisciplinary work on translation, e.g., involving teams of developmental scientists, teachers, and clinicians. At a scientific level, these studies would not only accelerate progress toward more effective prevention and mitigation of adverse developmental outcomes, they would address critical remaining questions about the role of experience-dependent processes, and their interactions with other factors, during development.
Finally, a more integrative science would involve nested basic science programs explicitly designed to bridge gaps between the results from noninvasive studies in children and those from parallel studies of relevant cellular and molecular phenomena in animals, and in human postmortem and in vitro tissue. Interdisciplinary teams should propose studies designed collaboratively by scientists studying human development with others studying animal models. The aims of these studies would be to create new bridging behavioral paradigms for cross-species comparisons and to develop animal models of human developmental biomarkers by applying noninvasive methods parallel to those used in children. Developmental neurobiologists, working more directly and closely with human developmental neuroscientists, should be encouraged to generate novel hypotheses about the neurobiological sources of many robust developmental signals that we now monitor with noninvasive assessments. More comprehensive data from human pediatric postmortem material is a critical need, and should be given high priority; but, again, this work would have larger impact if linked directly to noninvasive biomarkers, for example by retrieving relevant in vivo imaging or neurophysiological data or applying postmortem imaging protocols for bridging the gap. Modeling of effects within these new cross-level, multimodality datasets will present significant challenges, and computational scientists with both the biostatistical expertise to implement appropriate mixed-models and sufficient domain knowledge to contribute to the interpretation of the effects must be trained and recruited to a new, more integrative developmental science.
In order to achieve these goals, our sponsors also have a role to play, by:
-
•
Creating structures for integrating and leveraging resources within NIH and through collaboration with NSF, Department of Education, and private sponsors.
-
•
Offering new mechanisms for funding of multi-PI, multidisciplinary collaborations (cross-level, cross species, observations + interventions).
-
•
Providing support for infrastructure and informatics specifically designed for developmental data.
-
•Revising review criteria to incentivize:
-
∘Method harmonization across studies
-
∘Early data release and sharing
-
∘Integrative elements within programs
-
∘
7. Conclusion
In conclusion, the remarkable progress made in developmental cognitive neuroscience in the last two decades is undeniable and very exciting – but progress toward answering our “big questions” will languish unless we demand and create a more integrative science of the developing mind and brain. Certainly the most daunting challenge we face is the enormous complexity of the subject, but this challenge is all the greater when we are hamstrung by an unnecessary degree of fragmentation in our field. No societal campaign is more universally embraced than the pledge to ensure that each child can “reach his or her own potential”, but there is no consensus about how to accomplish this, and this situation reflects a sobering fact: Insufficient evidence exists to reconcile contradictory assumptions and predictions. The answers to our questions are not beyond our reach, but they may be coming more slowly because we are not deploying our scientific assets in the most powerful way to answer the most important questions. We should change that.
Footnotes
Based on the Huttenlocher Lecture by Terry Jernigan – Flux, September, 2014.
References
- Alexander D.H., Novembre J., Lange K. Fast model-based estimation of ancestry in unrelated individuals. Genome Res. 2009;19:1655–1664. doi: 10.1101/gr.094052.109. [DOI] [PMC free article] [PubMed] [Google Scholar]
- Baaré W.F., Hulshoff Pol H.E., Boomsma D.I., Posthuma D., de Geus E.J., Schnack H.G. Quantitative genetic modeling of variation in human brain morphology. Cereb. Cortex (New York, NY: 1991) 2001;11(9):816–824. doi: 10.1093/cercor/11.9.816. [DOI] [PubMed] [Google Scholar]
- Bakken T.E., Roddey J.C., Djurovic S., Akshoomoff N., Amaral D.G., Bloss C.S. Association of common genetic variants in GPCPD1 with scaling of visual cortical surface area in humans. Proc. Natl. Acad. Sci. U. S. A. 2012;109(10):3985–3990. doi: 10.1073/pnas.1105829109. [DOI] [PMC free article] [PubMed] [Google Scholar]
- Bartels M., Rietveld M.J.H., Van Baal G.C.M., Boomsma D.I. Genetic and environmental influences on the development of intelligence. Behav. Genet. 2002;32(4):237–249. doi: 10.1023/a:1019772628912. [DOI] [PubMed] [Google Scholar]
- Bartsch H., Thompson W.K., Jernigan T.L., Dale A.M. A web-portal for interactive data exploration, visualization and hypothesis testing. Front Neuroinform. 2014;8(25) doi: 10.3389/fninf.2014.00025. eCollection 2014. [DOI] [PMC free article] [PubMed] [Google Scholar]
- Brent B.K., Seidman L.J., Thermenos H.W., Holt D.J., Keshavan M.S. Self-disturbances as a possible premorbid indicator of schizophrenia risk: a neurodevelopmental perspective. Schizophr. Res. 2014;152(1):73–80. doi: 10.1016/j.schres.2013.07.038. [DOI] [PMC free article] [PubMed] [Google Scholar]
- Brown T.T., Kuperman J.M., Chung Y., Erhart M., McCabe C., Hagler D.J., Jr. Neuroanatomical assessment of biological maturity. Curr. Biol. 2012;22(18):1693–1698. doi: 10.1016/j.cub.2012.07.002. PMCID: PMC346108. [DOI] [PMC free article] [PubMed] [Google Scholar]
- Butcher L.M., Davis O.S.P., Craig I.W., Plomin R. Genome-wide quantitative trait locus association scan of general cognitive ability using pooled DNA and 500 K single nucleotide polymorphism microarrays. Genes Brain Behav. 2008;7(4):435–446. doi: 10.1111/j.1601-183X.2007.00368.x. [DOI] [PMC free article] [PubMed] [Google Scholar]
- Butterworth B., Varma S., Laurillard D. Dyscalculia: from brain to education. Science (New York, NY) 2011;332(6033):1049–1053. doi: 10.1126/science.1201536. [DOI] [PubMed] [Google Scholar]
- Calboli F.C.F., Tozzi F., Galwey N.W., Antoniades A., Mooser V., Preisig M. A genome-wide association study of neuroticism in a population-based sample. PLoS ONE. 2010;5(7):e11504. doi: 10.1371/journal.pone.0011504. [DOI] [PMC free article] [PubMed] [Google Scholar]
- Castellanos F.X., Tannock R. Neuroscience of attention-deficit/hyperactivity disorder: the search for endophenotypes. Nat. Rev. Neurosci. 2002;3(8):617–628. doi: 10.1038/nrn896. [DOI] [PubMed] [Google Scholar]
- Chen C.H., Gutierrez E.D., Thompson W., Panizzon M.S., Jernigan T.L., Eyler L.T. Hierarchical genetic organization of human cortical surface area. Science (New York, NY) 2012;335(6076):1634–1636. doi: 10.1126/science.1215330. [DOI] [PMC free article] [PubMed] [Google Scholar]
- Chen C.H., Fiecas M., Gutiérrez E.D., Panizzon M.S., Eyler L.T., Vuoksimaa E., Thompson W.K., Fennema-Notestine C., Hagler D.J., Jr., Jernigan T.L., Neale M.C., Franz C.E., Lyons M.J., Fischl B., Tsuang M.T., Dale A.M., Kremen W.S. Genetic topography of brain morphology. Proc. Natl. Acad. Sci. U. S. A. 2013;110(October (42)):17089–17094. doi: 10.1073/pnas.1308091110. PubMed PMID: 24082094; PubMed Central PMCID: PMC3801007. [DOI] [PMC free article] [PubMed] [Google Scholar]
- Clark D.B., Chung T., Pajtek S., Zhai Z., Long E., Hasler B. Neuroimaging methods for adolescent substance use disorder prevention science. Prev. Sci. 2013;14:300–309. doi: 10.1007/s11121-012-0323-0. [DOI] [PMC free article] [PubMed] [Google Scholar]
- Davies G., Tenesa A., Payton A., Yang J., Harris S.E., Liewald D. Genome-wide association studies establish that human intelligence is highly heritable and polygenic. Mol. Psychiatry. 2011;16(10):996–1005. doi: 10.1038/mp.2011.85. [DOI] [PMC free article] [PubMed] [Google Scholar]
- Eyler L.T., Prom-Wormley E., Panizzon M.S., Kaup A.R., Fennema-Notestine C., Neale M.C. Genetic and environmental contributions to regional cortical surface area in humans: a magnetic resonance imaging twin study. Cereb. Cortex. 2011 doi: 10.1093/cercor/bhr013. [DOI] [PMC free article] [PubMed] [Google Scholar]
- Fjell A.M., Walhovd K.B., Brown T.T., Kuperman J.M., Chung Y., Hagler D.J., Jr., Venkatraman V., Roddey C., Erhart M., McCabe C., Akshoomoff N., Amaral D.G., Bloss C.S., Libiger O., Darst B.F., Schork N.J., Casey B.J., Chang L., Ernst T.M., Gruen J.R., Kaufmann W.E., Kenet T., Frazier J., Murray S.S., Sowell E.R., van Zijl P., Mostofsky S., Jernigan T.L., Dale A.M., for the Pediatric Imaging, Neurocognition, and Genetics Study Multi modal imaging of the self-regulating developing brain. Proc. Natl. Acad. Sci. U. S. A. 2012;109(November (48)):19620–19625. doi: 10.1073/pnas.1208243109. PMCID: 3511748. [DOI] [PMC free article] [PubMed] [Google Scholar]
- Gibson G. Hints of hidden heritability in GWAS. Nat. Genet. 2010:558–560. doi: 10.1038/ng0710-558. [DOI] [PubMed] [Google Scholar]
- Glantz L.A., Gilmore J.H., Hamer R.M., Lieberman J.A., Jarskog L.F. Synaptophysin and postsynaptic density protein 95 in the human prefrontal cortex from mid-gestation into early adulthood. Neuroscience. 2007;149(3):582–591. doi: 10.1016/j.neuroscience.2007.06.036. [DOI] [PMC free article] [PubMed] [Google Scholar]
- Hibar D.P., Stein J.L., Ryles A.B., Kohannim O., Jahanshad N., Medland S.E. Genome-wide association identifies genetic variants associated with lentiform nucleus volume in N = 1345 young and elderly subjects. Brain Imaging Behav. 2013;7(2):102–115. doi: 10.1007/s11682-012-9199-7. PMID: 22903471. [DOI] [PMC free article] [PubMed] [Google Scholar]
- Hibar D.P., Stein J.L., Renteria M.E., Arias-Vasquez A., Desrivières S., Jahanshad N. Common genetic variants influence human subcortical brain structures. Nature. 2015;520(7546):224–229. doi: 10.1038/nature14101. Epub 2015 Jan 21. PMID: 25607358. [DOI] [PMC free article] [PubMed] [Google Scholar]
- Huttenlocher P.R., Dabholkar A.S. Regional differences in synaptogenesis in human cerebral cortex. J. Comp. Neurol. 1997;387(October (2)):167–178. doi: 10.1002/(sici)1096-9861(19971020)387:2<167::aid-cne1>3.0.co;2-z. PubMed PMID: 9336221. [DOI] [PubMed] [Google Scholar]
- Huttenlocher P.R. Morphometric study of human cerebral cortex development. Neuropsychologia. 1990;28(6):517–527. doi: 10.1016/0028-3932(90)90031-i. Review. PubMed PMID: 2203993. [DOI] [PubMed] [Google Scholar]
- Huttenlocher P.R., de Courten C. The development of synapses in striate cortex of man. Hum. Neurobiol. 1987;6(1):1–9. PubMed PMID: 3583840. [PubMed] [Google Scholar]
- Jernigan T.L., Trauner D.A., Hesselink J.R., Tallal P.A. Maturation of human cerebrum observed in vivo during adolescence. Brain: J. Neurol. 1991;114(Pt 5):2037–2049. doi: 10.1093/brain/114.5.2037. [DOI] [PubMed] [Google Scholar]
- Jernigan T.L., Brown T.T., Hagler D.J., Jr., Akshoomoff N., Bartsch H., Newman E. The Pediatric Imaging, Neurocognition, and Genetics (PING) Data Repository. NeuroImage. 2015 doi: 10.1016/j.neuroimage.2015.04.057. PMID: 25937488. [DOI] [PMC free article] [PubMed] [Google Scholar]
- Klein D.N., Kotov R., Bufferd S.J. Personality and depression: explanatory models and review of the evidence. Clin. Psychol. 2011;7:269–295. doi: 10.1146/annurev-clinpsy-032210-104540. [DOI] [PMC free article] [PubMed] [Google Scholar]
- Kremen W.S.W., Jacobsen K.C.K., Xian H.H., Eisen S.A.S., Eaves L.J.L., Tsuang M.T.M., Lyons M.J.M. Genetics of verbal working memory processes: a twin study of middle-aged men. Neuropsychology. 2007;21(5):569–580. doi: 10.1037/0894-4105.21.5.569. [DOI] [PubMed] [Google Scholar]
- Luo D., Thompson L.A., Detterman D.K. Phenotypic and behavioral genetic covariation between elemental cognitive components and scholastic measures. Behav. Genet. 2003;33(3):221–246. doi: 10.1023/a:1023438323100. [DOI] [PubMed] [Google Scholar]
- Mallamaci A., Stoykova A. Gene networks controlling early cerebral cortex arealization. Eur. J. Neurosci. 2006;23(4):847–856. doi: 10.1111/j.1460-9568.2006.04634.x. [DOI] [PubMed] [Google Scholar]
- Newman E., Thompson W.K., Bartsch H., Hagler D.J., Jr., Chen C.-H., Brown T.T., Kuperman J.M., McCabe C., Chung Y., Libiger O., Akshoomoff A., Bloss C.S., Casey B.J., Chang L., Ernst T.M., Frazier J.A., Gruen J.A., Kennedy D.N., Murray S.S., Sowell E.R., Schork N., Kenet T., Kaufmann W.E., Mostofsky S., Amaral D.G., Dale A.M., Jernigan T.L., for the Pediatric Imaging, Neurocognition, and Genetics Study Anxious children exhibit an altered pattern of cortical maturation. Brain Struct. Funct. 2015 [Google Scholar]
- O’Leary D.D.M., Chou S.-J., Sahara S. Area patterning of the mammalian cortex. Neuron. 2007;56(2):252–269. doi: 10.1016/j.neuron.2007.10.010. [DOI] [PubMed] [Google Scholar]
- Panizzon M.S., Fennema-Notestine C., Eyler L.T., Jernigan T.L., Prom-Wormley E., Neale M. Distinct genetic influences on cortical surface area and cortical thickness. Cereb. Cortex (New York, NY: 1991) 2009;19(11):2728–2735. doi: 10.1093/cercor/bhp026. [DOI] [PMC free article] [PubMed] [Google Scholar]
- Petanjek Z., Judas M., Šimic G., Rasin M.R., Uylings H.B.M., Rakic P., Kostović I. Extraordinary neoteny of synaptic spines in the human prefrontal cortex. Proc. Natl. Acad. Sci. U. S. A. 2011;108(32):13281–13286. doi: 10.1073/pnas.1105108108. [DOI] [PMC free article] [PubMed] [Google Scholar]
- Peterson R.L., Pennington B.F. Developmental dyslexia. Lancet. 2012;379(9830):1997–2007. doi: 10.1016/S0140-6736(12)60198-6. [DOI] [PMC free article] [PubMed] [Google Scholar]
- Porter J.N., Collins P.F., Muetzel R.L., Lim K.O., Luciana M. Associations between cortical thickness and verbal fluency in childhood, adolescence, and young adulthood. NeuroImage. 2011;55(4):1865–1877. doi: 10.1016/j.neuroimage.2011.01.018. [DOI] [PMC free article] [PubMed] [Google Scholar]
- Purcell S.M., Wray N.R., Stone J.L., Visscher P.M., O’Donovan M.C., Sullivan P.F. Common polygenic variation contributes to risk of schizophrenia and bipolar disorder. Nature. 2009;460(7):748–752. doi: 10.1038/nature08185. [DOI] [PMC free article] [PubMed] [Google Scholar]
- Rettew D.C., Vink J.M., Willemsen G., Doyle A., Hudziak J.J., Boomsma D.I. The genetic architecture of neuroticism in 3301 Dutch adolescent twins as a function of age and sex: a study from the Dutch twin register. Twin Res. Hum. Genet. 2006;9(1):24–29. doi: 10.1375/183242706776403028. [DOI] [PMC free article] [PubMed] [Google Scholar]
- Rietveld C.A., Medland S.E., Derringer J., Yang J., Esko T., Martin N.W. GWAS of 126,559 individuals identifies genetic variants associated with educational attainment. Science (New York, NY) 2013;340(6139):1467–1471. doi: 10.1126/science.1235488. [DOI] [PMC free article] [PubMed] [Google Scholar]
- Rietveld C.A., Conley D., Eriksson N., Esko T., Medland S.E., Vinkhuyzen A.A.E. Replicability and robustness of genome-wide-association studies for behavioral traits. Psychol. Sci. 2014;25(11):1975–1986. doi: 10.1177/0956797614545132. [DOI] [PMC free article] [PubMed] [Google Scholar]
- Squeglia L.M., Jacobus J., Sorg S.F., Jernigan T.L., Tapert S.F. Early adolescent cortical thinning is related to better neuropsychological performance. J. Int. Neuropsychol. Soc. 2013;19(09):962–970. doi: 10.1017/S1355617713000878. [DOI] [PMC free article] [PubMed] [Google Scholar]
- Sowell E.R., Delis D., Stiles J., Jernigan T.L. Improved memory functioning and frontal lobe maturation between childhood and adolescence: a structural MRI study. J. Int. Neuropsychol. Soc. 2001;7(3):312–322. doi: 10.1017/s135561770173305x. [DOI] [PubMed] [Google Scholar]
- Tamnes C.K., Ostby Y., Walhovd K.B., Westlye L.T., Due-Tønnessen P., Fjell A.M. Neuroanatomical correlates of executive functions in children and adolescents: a magnetic resonance imaging (MRI) study of cortical thickness. Neuropsychologia. 2010;48(9):2496–2508. doi: 10.1016/j.neuropsychologia.2010.04.024. [DOI] [PubMed] [Google Scholar]
- Volkow N.D. What do we know about drug addiction? Am. J. Psychiatry. 2005;162:1401–1402. doi: 10.1176/appi.ajp.162.8.1401. [DOI] [PubMed] [Google Scholar]
- Webster M.J., Elashoff M., Weickert C.S. Molecular evidence that cortical synaptic growth predominates during the first decade of life in humans. Int. J. Dev. Neurosci. 2011;29(3):225–236. doi: 10.1016/j.ijdevneu.2010.09.006. [DOI] [PubMed] [Google Scholar]
- Yakovlev P.I., Lecours A.R. The myelogenetic cycles of regional maturation of the brain. In: Minkowski A., editor. Regional Development of the Brain in Early Life. Blackwell Oxford; 1967. pp. 3–70. [Google Scholar]