Abstract
The cornea is a highly specialised tissue with a unique set of biomechanical properties determined by its complex structure. The maintenance of these mechanical properties is fundamental to maintain clear vision as the cornea provides the majority of the focussing power of the eye. Changes to the biomechanics of the cornea can occur during ageing, disease, and trauma, or as a result of surgery. Recently there has been increased interest in the mechanical properties of the cornea as knowledge of these properties has significant implications for the improvement of current ocular treatments including PRK and LASIK, and for the diagnosis and tracking of corneal diseases and therapy such as keratoconus and crosslinking. Biomechanics are also important for the development of artificial corneal replacements. This paper describes the use of a novel, non-destructive lateral electronic speckle pattern shearing interferometer (ESPSI). The data generated via this technique give a full-field view of the mechanical response of the cornea under simulated physiological loading conditions, and enables strain and displacement to be determined in three planes. The technique allows corneal stiffness to be quantified and enables changes and non-homogeneities that occur due to surgery or disease to be detected.
Introduction
The cornea is a complex highly specialised biological tissue with a unique structure that exhibits both transparency and high tensile strength. It has evolved to allow light to pass through and to focus on the retina. It provides a barrier to protect the eye from disease and maintain shape whilst subject to the forces of intraocular pressure (IOP) and those of fluctuating cardiac cycle.
Advances in static measurement techniques have resulted in a literature describing corneal tissue architecture from a microscopic to a nanoscopic scale. The use of X-rays,1 scanning electron microscopy,2 non-linear microscopy techniques,3 transmission electron microscopy,2 and polarisation-sensitive optical coherence tomography4 amongst others have enabled detailed imaging of the corneal collagen architecture. However, owing to the complexity of the structure, its anisotropy, and its non-linear response to loading,5 it is not possible to understand and/or predict the mechanical behaviour using these methods.
In comparison with static data, little information currently exists detailing the dynamic behaviour of the cornea and there is still a lack of understanding as to the specific mechanical properties that govern the corneal behaviour and how it deforms under physiological pressure changes.
Quantification of corneal mechanical properties
Quantifying the corneal mechanical properties remains challenging, as like other biological materials the cornea exhibits a viscoelastic and non-linear response to loading.6 The response can differ dependent on the loading history, magnitude of the applied load, strain rate, maximum strain, nature of loading (continuous or cyclical), recovery time between loading cycles, and tissue properties such as hydration levels, temperature, freshness, and storage conditions.7
Several in vitro attempts have been made to measure the mechanical response of the cornea to loading, and a number of mechanical parameters have been quantified including Young's modulus,8, 9 shear modulus,10 and Brillouin modulus.11 Young's modulus is commonly used assuming that the response of the cornea is governed by the tensile strength of the collagen fibres. However, a large range of values of Young's modulus have been reported varying from 0.1 to 57 MPa.12 This can in part be explained by the viscoelastic nature of the cornea, however, there are many drawbacks to some of the techniques currently used such as strip extensometry, which affect the reliability of data and its usefulness when considering in vivo behaviour.
Common problems with existing techniques include exposing the cornea to pressure ranges not representative of physiological pressures in magnitude, time base, or direction. In vivo the cornea is dome like and heterogeneous in structure in both x, y and z planes.13 Clearly strip extensometry involving isolation of discrete elements from the dome give little reality when related to the mechanical properties of the in vivo system.
Laser interferometry
Electronic speckle pattern interferometry (ESPI) and ESPSI are versatile techniques that have been used within the engineering industry for a number of years to quantify material properties, detect structural non-homogeneities in composite structures,14, 15 and predict failure modes. They have also recently been used for in vitro testing of the loading response of hard biological materials including the femur16 and the jaw.17
Laser interferometry has many advantages regarding its use as a tool to quantify the mechanical response of corneal tissue, this has been demonstrated in several studies. ESPI has been used to examine the effects of microkeratome incisions on the biomechanical behaviour of the cornea.18 Radial speckle shearing interferometry has been used to show the effect of using different parameters during LASIK surgery such as depth and angles of incisions.19 It has also been used to determine the changes in Young's modulus of the cornea during ageing20 and following crosslinking.21 It is non-contact, non-destructive, provides data in real time, and is highly sensitive; the sensitivity can be optimised so the cornea is loaded at pressures within the physiological range. It is also a full-field measurement technique therefore the corneal response to loading can be viewed across the whole surface, enabling defects, non-homogeneities, and irregularities in behaviour (that may be missed using less-sensitive, point-based techniques) to be identified.
A specific lateral shearing interferometry technique capable of mapping the strain on the surface of the cornea under hydrostatic loading is discussed in this paper.
Lateral electronic speckle pattern shearing interferometry
Lateral sensitivity was selected as opposed to radial that has been used in previous studies, because with radial shear data were not obtained for the central region of the measurement due to the shear being zero at this point, and therefore important information was lost for this area, with lateral shear uniform sensitivity is achieved across the entire surface.
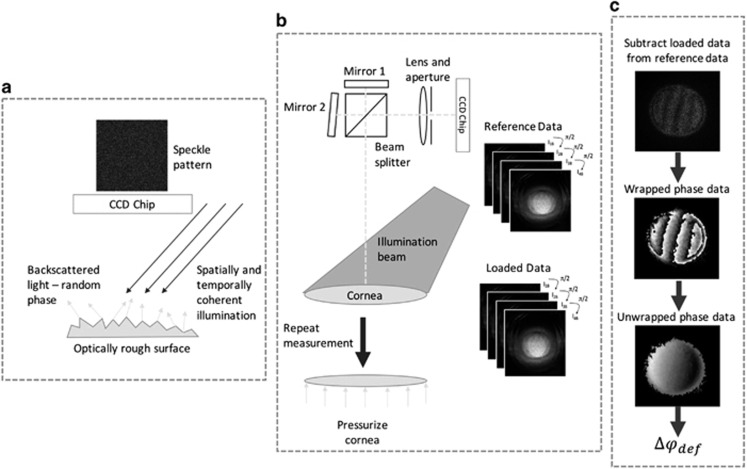
The working principles for lateral ESPSI are summarised in Figure 1. Full details have been discussed elsewhere.22
Figure 1.
Summary of the working principle of ESPSI. (a) Spatially and temporally coherent light is used to illuminate the surface of the object, if the surface of the object is rough (height variations >λ/4) the light scattered from the object has a random phase, constructive and destructive interference of this light results in a speckle pattern, which is captured on a charge-coupled device (CCD) chip; (b) the object beam is split into two parts via a beam splitter—one of these beams is transformed laterally and the beams are combined on the surface of the CCD chip. A unique speckle pattern is captured from the object in its reference state and stored, the object is then loaded and a second speckle pattern in captured, phase stepping is used during data capture so quantitative data can be extracted; (c) the loaded speckle phase data are subtracted from the reference speckle phase data in real time resulting in subtraction fringes. A wrapped phase map is generated from the phase stepped data, these wrapped data are then unwrapped to give the absolute phase change due to deformation (Δφdef) for each pixel in the image plane.
Data generated using ESPSI give the phase change due to deformation (Δφdef), this appears visually as a series of interference fringes and relates to the rate of displacement (strain) that has occurred in the object due to loading via the following equations:23
where λ is the wavelength of the illumination source, θ is the illumination angle,  are the in-plane (IP) strain components for horizontal and vertical shear, respectively,
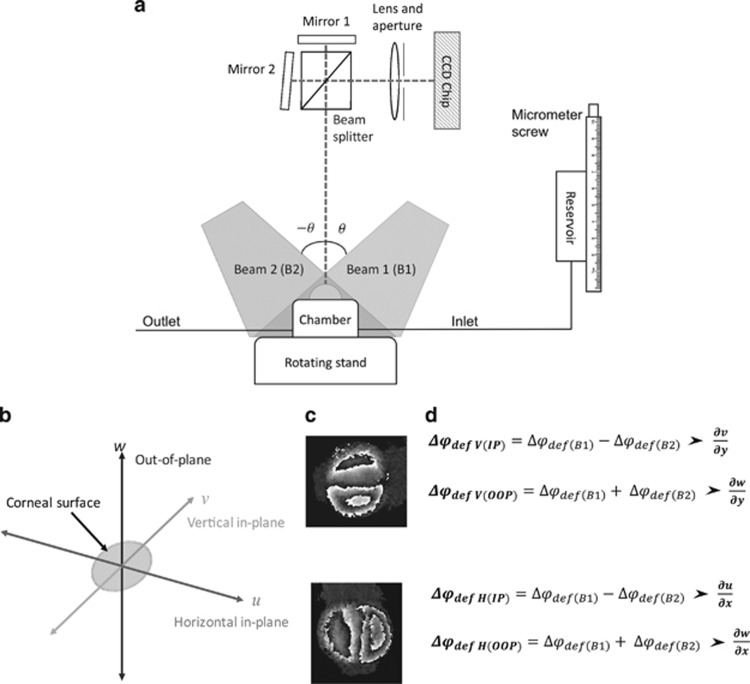
  are the out-of-plane (OOP) strain components, and δx and δy are the magnitudes of horizontal and vertical shear, respectively. To quantify the components of IP and OOP strain a specific set-up (Figure 2) has been designed so the object can be illuminated at equal and opposite illumination angles,24 manipulation of the data gathered from each of these illumination angles allows the IP and OOP strain components to be separated and quantified.25
Figure 2.
Dual beam interferometry system to separate components of IP and OOP strains. (a) A simplified version of test rig, data are collected individually from illumination with beam 1 and then beam 2 over two measurement cycles. The rotating stand enables rotation through 90° to obtain sensitivity in both the horizontal and vertical planes ensuring δx=δy. (b) The direction of different planes with reference to the corneal surface. (c) An example of wrapped interference fringes for vertical and horizontal shear. (d) Equations demonstrating how phase data from different illumination angles are manipulated to give separate components of strain.
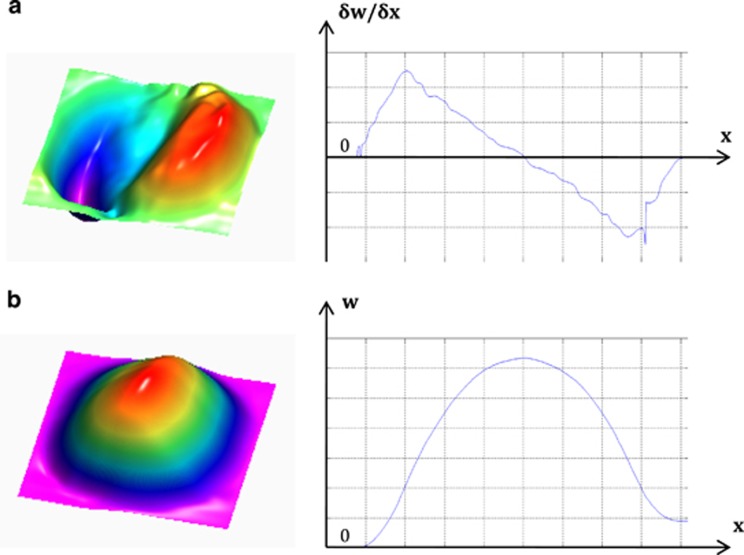
The test rig (Figure 2) was designed so the object can rotate through 90° allowing the sensitivity direction to be changed easily from horizontal to vertical without changing the position of the camera or the illumination source. This enables the specific strain components to be determined in three planes. Corneal displacement can also be determined in each of the planes by integration of the phase data, an example of this is given in Figure 3.
Figure 3.
(a) OOP  surface plot and line plot along the x axis for central y axis position; (b) OOP displacement (w) surface plot and line plot along the x axis for central y axis position.
ESPSI and loading rig set-up
The interferometer consisted of a divergent square illumination beam (λ=532 nm), shaped with holographic optics (Laser Optical Engineering, LOE Ltd, Derbyshire, UK) to provide uniform illumination. The imaging system included a camera (CMOS Aptina MT9P031, Basler AG, Ahrensburg, Germany) and an externally controlled shearing head able to adjust the magnitude of shear. Analysis software (Defect Detect LOE Ltd, Derbyshire, UK) was used to capture the images and produce the phase data for each measurement in real time. A wrapped phase data file was generated for each measurement set.
A stainless-steel artificial anterior chamber was used to clamp the corneal samples. The chamber was filled from a tank the height of which was changed via a micrometre screw to an accuracy of 0.005 mm measured using a digital gauge (Swiss Precision Instruments, Inc., Garden Grove, CA, USA). A pressure transducer was attached at the outlet and positioned at the same height as the sample to measure the hydrostatic pressure in the chamber to an accuracy of 0.005 mm H2O. Phosphate-buffered saline (PBS, Sigma-Aldrich, Dorset, UK, ρ=0.995 g/ml at 25 °C) was used to pressurise the samples.
Corneal–scleral buttons were mounted into the chamber and set to an initial pressure of 16 mm Hg (217.5 mm H2O), which is within the average reported IOP for the human eye,26, 27 for the eye for 30 min before recording of the first measurement to allow for any stress relaxation to occur and ensuring that the samples were inflated to their natural curvature. The 3–7-μm glass spheres (Potters Industries LLC, Potters Europe Ltd., Barnsley, UK) were randomly distributed onto the sample surface to ensure adequate backscattering of light while not interfering with the response of the cornea. The height of the tank was changed by 1–5 mm in 0.5-mm increments and phase data were recorded at each height. The small pressure change was selected as it is well within the physiological pressure changes experienced by the cornea in vivo and demonstrates the high sensitivity of the technique while reducing the effects of any small changes that could occur in the strain rate or relaxation time during experiments. The measurement process was repeated four times at each height to collect data for horizontal and vertical sensitivity for each of the illumination directions.
Data
Tests on rubber sample
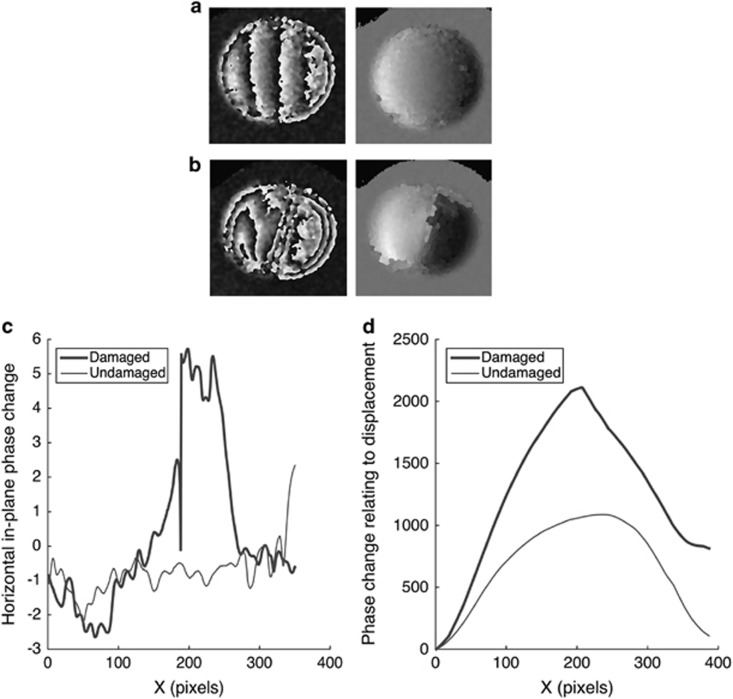
To demonstrate the suitability of the technique to detect defects and give an example of the data that can be generated using this method and its validity, initial testing was done on a simulation cornea made from cured rubber latex. Testing was first carried out on an ‘undamaged' rubber sample, a superficial cut was then made to the sample and the testing procedure was repeated for the ‘damaged' sample. The unwrapped and wrapped phase maps from these tests are given in Figure 4 along with plots giving the horizontal IP strain component alone the central line and the relative displacement change between the two samples.
Figure 4.
Comparison of undamaged and damaged samples. (a) Wrapped and unwrapped phase maps of undamaged sample under hydrostatic pressure of 29.4 Pa; (b) wrapped and unwrapped phase maps of sample with superficial cut under hydrostatic pressure of 29.4 Pa; (c) plot comparing the horizontal in-plane phase change component (proportional to horizontal in-plane strain) owing to a pressure increase of 29.4 Pa for undamaged and damaged samples along the x-axis for central y-axis position; (d) plot comparing the intergrated in-plane phase change component (proportional to in-plane displacement) owing to a pressure increase of 29.4 Pa for undamaged and damaged samples along the x-axis for central y-axis position.
Under a pressure increase of 29.4 Pa the interference fringes on the wrapped interferogram of the undamaged sample appeared relatively symmetrical in distribution (Figure 4a), this indicates uniform strain distribution, which is expected due to the isotropy of the sample. After a superficial cut was introduced the number of fringes on the wrapped interferogram increased (Figure 4b) and they became non-uniform in distribution and direction with a higher concentration around the area of damage indicating higher strain in this area and non-uniform deformation with some twisting.
The IP strain component  in the undamaged sample was constant across the sample indicating uniform deformation (Figure 4c). In the damaged sample
  was significantly higher in the area of damage indicating higher strain and therefore deformation in the region where the cut had been introduced (Figure 4c).
The IP displacement map shows the displacement profile for the central line in the sample (Figure 4d). In the undamaged sample the displacement profile is smooth and represents uniform bulging (Figure 4d). In the damaged sample the displacement is much greater with a steeper peak where the damage is (Figure 4d), indicating weakening of the sample due to the presence of the damage.
Tests on cornea
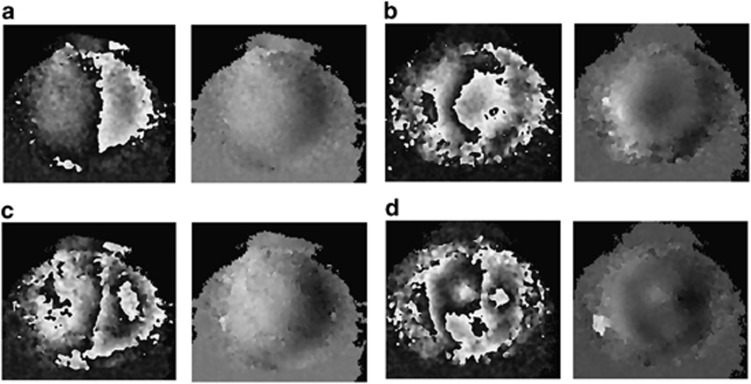
The testing procedure was repeated on a fresh porcine cornea. Initially the undamaged sample was tested. It was then removed from the chamber and a superficial cut was made on the right side surface of the cornea at approximately the centre line from the edge towards the centre point and the tests were repeated. The resulting wrapped and unwrapped interferograms are shown in Figure 5.
Figure 5.
(a) Wrapped and unwrapped interferograms of an undamaged pig cornea due to 9.8 Pa hydrostatic pressure increase; (b) Wrapped and unwrapped interferograms of a pig cornea with a superficial cut on the surface due to 9.8 Pa hydrostatic pressure increase; (c) Wrapped and unwrapped interferograms of an undamaged pig cornea due to 19.6 Pa hydrostatic pressure increase; (d) Wrapped and unwrapped interferograms of a pig cornea with a superficial cut on the surface due to 19.6 Pa hydrostatic pressure increase.
Despite the low increase in pressure (less than one-tenth of that experienced by the cornea resulting from cardiac cycle) differences in the response of the cornea to loading could be observed after the introduction of a superficial cut to the surface. For the undamaged cornea (Figures 5a and c) the fringes in the wrapped image are relatively symmetrical and straight, however, for the damaged cornea (Figures 5b and d) the fringes are non-uniform and not symmetrical indicating non-uniform deformation, which has occurred as a result of damage to the surface.
Conclusions
The technique discussed is capable of tracking the dynamic response of the cornea to physiological loads with pixel resolution and gives full-field data regarding strain and displacement that occurs on the corneal surface. The high sensitivity and full-field nature of the technique means it is capable of detecting changes in the biomechanical responses of the cornea resulting from the structural damage associated with surgery. The xy location of such changes is of great importance in determining points of weakness and their implications for designing future surgery. In essence, it has the potential to increase understanding of the mechanical behaviour of the normal cornea and how it changes with disease, and therefore may help improve diagnosis and treatment. Second, these measurements will be fundamental in the development of computer-simulated models of the cornea. Third, such measurements in vivo would allow the diagnosis of patients with highly elastic corneas who should perhaps not undergo laser surgery as such procedures may result in ectasia in such individuals. Finally, a detailed strain map of patients with pathological conditions, such as keratoconus would allow the development of topographic treatments using techniques such as riboflavin- and UV-based crosslinking. The clinical environment is extremely receptive and waiting for a clinical version of the device used in this study.
Acknowledgments
We thank NIHR Biomedical Research Centre at Moorfields Eye Hospital NHS Foundation Trust and UCL Institute of Ophthalmology.
The authors declare no conflict of interest.
Footnotes
This work was presented at the Cambridge Ophthalmological Symposium 2015.
References
- 1Meek KM, Boote C. The use of X-ray scattering techniques to quantify the orientation and distribution of collagen in the corneal stroma. Prog Retin Eye Res 2009; 28(5): 369–392. [DOI] [PubMed] [Google Scholar]
- 2Komai Y, Ushiki T. The three-dimensional organization of collagen fibrils in the human cornea and sclera. Invest Ophthalmol Vis Sci 1991; 32(8): 2244–2258. [PubMed] [Google Scholar]
- 3Aptel F, Olivier N, Deniset-Besseau A, Legeais JM, Plamann K, Schanne-Klein MC et al. Multimodal nonlinear imaging of the human cornea. Invest Ophthalmol Vis Sci 2010; 51(5): 2459–2465. [DOI] [PubMed] [Google Scholar]
- 4Pircher M, Hitzenberger CK, Schmidt-Erfurth U. Polarization sensitive optical coherence tomography in the human eye. Prog Retin Eye Res 2011; 30(6): 431–451. [DOI] [PMC free article] [PubMed] [Google Scholar]
- 5Kotecha A. What biomechanical properties of the cornea are relevant for the clinician? Surv Ophthalmol 2007; 52(Suppl 2): S109–S114. [DOI] [PubMed] [Google Scholar]
- 6Glass DH, Roberts CJ, Litsky AS, Weber PA. A viscoelastic biomechanical model of the cornea describing the effect of viscosity and elasticity on hysteresis. Invest Ophthalmol Vis Sci 2008; 49(9): 3919–3926. [DOI] [PubMed] [Google Scholar]
- 7Dias J, Ziebarth NM. Impact of Hydration Media on Ex Vivo Corneal Elasticity Measurements. Eye Contact Lens 2015; 41(5): 281–286. [DOI] [PMC free article] [PubMed] [Google Scholar]
- 8Elsheikh A, Alhasso D, Rama P. Biomechanical properties of human and porcine corneas. Exp Eye Res 2008; 86(5): 783–790. [DOI] [PubMed] [Google Scholar]
- 9Hjortdal JO. Regional elastic performance of the human cornea. J Biomech 1996; 29(7): 931–942. [DOI] [PubMed] [Google Scholar]
- 10Petsche SJ, Chernyak D, Martiz J, Levenston ME, Pinsky PM. Depth-dependent transverse shear properties of the human corneal stroma. Invest Ophthalmol Vis Sci 2012; 53(2): 873–880. [DOI] [PMC free article] [PubMed] [Google Scholar]
- 11Scarcelli G, Yun SH. In vivo Brillouin optical microscopy of the human eye. Opt Express 2012; 20(8): 9197–9202. [DOI] [PMC free article] [PubMed] [Google Scholar]
- 12Garcia-Porta N, Fernandes P, Queiros A, Salgado-Borges J, Parafita-Mato M, González-Méijome JM. Corneal biomechanical properties in different ocular conditions and new measurement techniques. ISRN Ophthalmol 2014; 2014: 724546. [DOI] [PMC free article] [PubMed] [Google Scholar]
- 13Elsheikh A, Anderson K. Comparative study of corneal strip extensometry and inflation tests. J R Soc Interface 2005; 2(3): 177–185. [DOI] [PMC free article] [PubMed] [Google Scholar]
- 14Zhang ZY, Richardson MOW, Wisheart M, Tyrer JR, Petzing J. ESPI non-destructive testing of GRP composite materials containing impact damage. Compos Part A Appl Sci Manuf 1998; 29(7): 721–729. [Google Scholar]
- 15Ibrahim JS, Tyrer JR. Deformation analysis of aircraft wheels using a speckle shearing interferometer. J Aerosp Eng 2004; 218(4): 287–295. [Google Scholar]
- 16Tyrer JR, Heras-Palou C, Slater T. Three-dimensional human femoral strain analysis using ESPI. Opt Lasers Eng 1995; 23(5): 291–303. [Google Scholar]
- 17Roman JF, Petzing JN, Tyrer JR. Analysis of loaded mandible behaviour using speckle pattern interferometry. Strain 1999; 35(1): 3–6. [Google Scholar]
- 18Jaycock PD, Lobo L, Ibrahim J, Tyrer J, Marshall J. Interferometric technique to measure biomechanical changes in the cornea induced by refractive surgery. J Cataract Refract Surg 2005; 31(1): 175–184. [DOI] [PubMed] [Google Scholar]
- 19Knox Cartwright NE, Tyrer JR, Jaycock PD, Marshall J. Effects of variation in depth and side cut angulations in LASIK and thin-flap LASIK using a femtosecond laser: a biomechanical study. J Refract Surg 2012; 28(6): 419–425. [DOI] [PubMed] [Google Scholar]
- 20Cartwright NEK, Tyrer JR, Marshall J. Age-related differences in the elasticity of the human cornea. Invest Ophthalmol Vis Sci 2011; 52(7): 4324–4329. [DOI] [PubMed] [Google Scholar]
- 21Knox Cartwright NE, Tyrer JR, Marshall J. In vitro quantification of the stiffening effect of corneal cross-linking in the human cornea using radial shearing speckle pattern interferometry. J Refract Surg 2012; 28(7): 503–508. [DOI] [PubMed] [Google Scholar]
- 22Steinchen W, Yang L. Digital Shearography: Theory and Application of Digital Speckle Pattern Shearing Interferometry. SPIE Optical Engineering Press: Bellingham, Washington, USA, 2003. [Google Scholar]
- 23Tyrer JR, Petzing JN. In-plane electronic speckle pattern shearing interferometry. Opt Lasers Eng 1997; 26(4-5): 395–406. [Google Scholar]
- 24Hung YY, Wang JQ. Dual-beam phase shift shearography for measurement of in-plane strains. Opt Lasers Eng 1996; 24(5–6): 403–413. [Google Scholar]
- 25Patorski K, Olszak A. Digital in-plane electronic speckle pattern shearing interferometry. Opt Eng 1997; 36(7): 2010–2015. [Google Scholar]
- 26Ouyang PB, Li CY, Zhu XH, Duan XC. Assessment of intraocular pressure measured by Reichert Ocular Response Analyzer, Goldmann Applanation Tonometry, and Dynamic Contour Tonometry in healthy individuals. Int J Ophthalmol 2012; 5(1): 102–107. [DOI] [PMC free article] [PubMed] [Google Scholar]
- 27Schneider E, Grehn F. Intraocular pressure measurement-comparison of dynamic contour tonometry and goldmann applanation tonometry. J Glaucoma 2006; 15(1): 2–6. [DOI] [PubMed] [Google Scholar]


